matplotlib 进阶之Tight Layout guide
matplotlib教程学习笔记
如何使用tight_layout?
tight_layout作用于ticklabels, axis, labels, titles等Artist
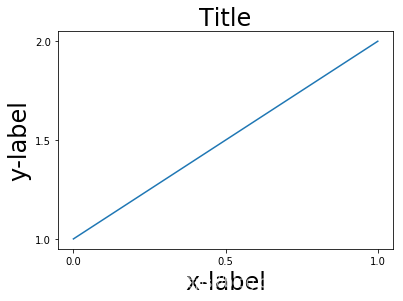
简单的例子
import matplotlib.pyplot as plt

import numpy as np
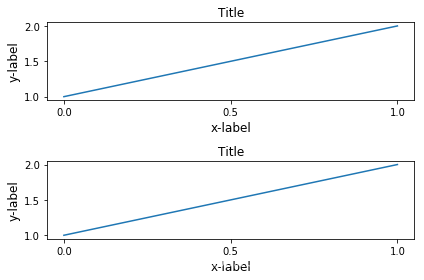
下面的例子和constrained_layout中的是一样的,notebook没有显示出其中的问题,就是labels被遮挡了
plt.rcParams['savefig.facecolor'] = "0.8"

def example_plot(ax, fontsize=12):

    ax.plot([1, 2])

    ax.locator_params(nbins=3)

    ax.set_xlabel('x-label', fontsize=fontsize)

    ax.set_ylabel('y-label', fontsize=fontsize)

    ax.set_title('Title', fontsize=fontsize)

plt.close('all')

fig, ax = plt.subplots()

example_plot(ax, fontsize=24)
fig, ax = plt.subplots()

example_plot(ax, fontsize=24)

plt.tight_layout()
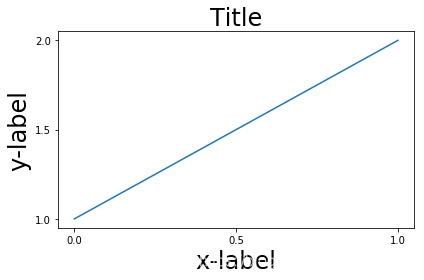
注意到,每次作图,我们都需要通过使用plt.tight_layout()函数来激活,我们也可以通过
fig.set_tight_layout(True)使得每次作图都会自动tight布局,当然,还可以通过将
figure.autolayout rcParam设置为True来实现。
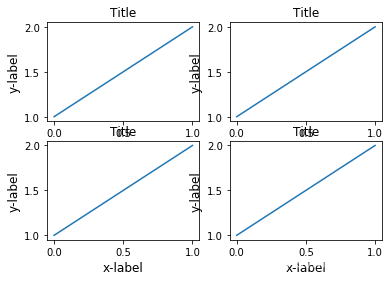
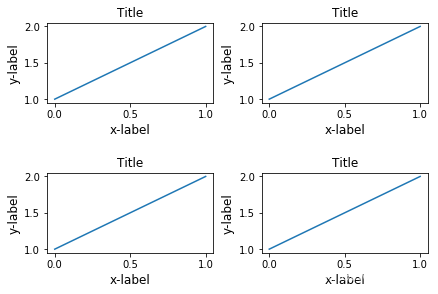
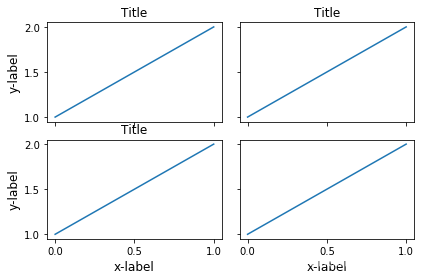
有多个plots的时候,会出现重叠的现象,通过tight_layout可以解决
plt.close('all')

fig, ((ax1, ax2), (ax3, ax4)) = plt.subplots(nrows=2, ncols=2)

example_plot(ax1)

example_plot(ax2)

example_plot(ax3)

example_plot(ax4)
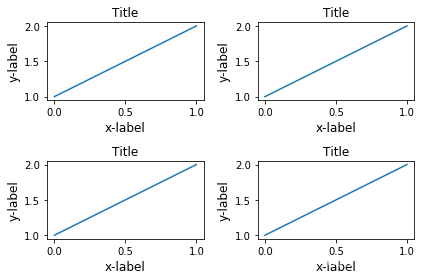
fig, ((ax1, ax2), (ax3, ax4)) = plt.subplots(nrows=2, ncols=2)

example_plot(ax1)

example_plot(ax2)

example_plot(ax3)

example_plot(ax4)

plt.tight_layout()
tight_layout可以通过参数pad, w_pad, h_pad来设置一些布局的细节
fig, ((ax1, ax2), (ax3, ax4)) = plt.subplots(nrows=2, ncols=2)

example_plot(ax1)

example_plot(ax2)

example_plot(ax3)

example_plot(ax4)

plt.tight_layout(pad=0.4, w_pad=0.5, h_pad=2)
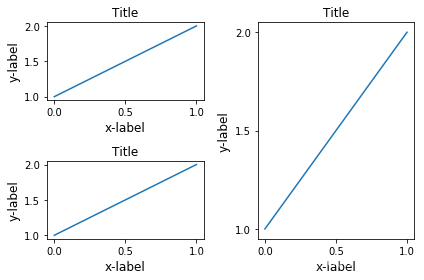
即使subplots的大小不一致,tight_layout依旧能够工作
plt.close('all')

fig = plt.figure()

ax1 = plt.subplot(221)

ax2 = plt.subplot(223)

ax3 = plt.subplot(122)

example_plot(ax1)

example_plot(ax2)

example_plot(ax3)

plt.tight_layout()
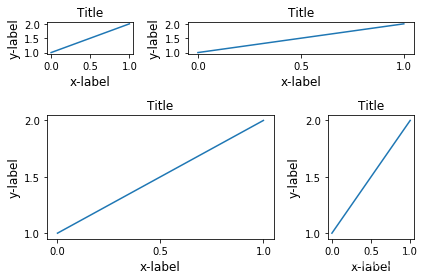
对subplot2grid也有效,注意subplot2grid参数为:
shape: e.g. (3, 3) 表示\(3 \times 3\)个格子
loc: e.g. (0, 1) 表示从第一行第二列个格子开始
rowspan: 跨行
colspan: 跨列
plt.close('all')

fig = plt.figure()

ax1 = plt.subplot2grid((3, 3), (0, 0))

ax2 = plt.subplot2grid((3, 3), (0, 1), colspan=2)

ax3 = plt.subplot2grid((3, 3), (1, 0), colspan=2, rowspan=2)

ax4 = plt.subplot2grid((3, 3), (1, 2), rowspan=2)

example_plot(ax1)

example_plot(ax2)

example_plot(ax3)

example_plot(ax4)

plt.tight_layout()
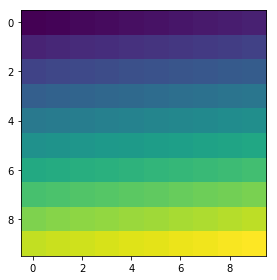
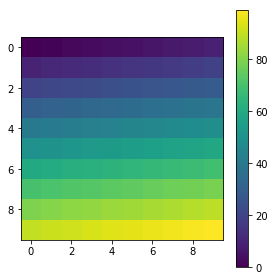
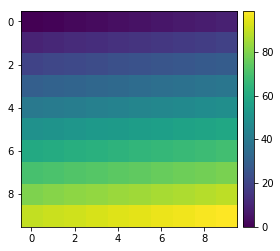
arr = np.arange(100).reshape((10, 10))

plt.close('all')

fig = plt.figure(figsize=(5, 4))

ax = plt.subplot(111)

im = ax.imshow(arr, interpolation="none")

plt.tight_layout()
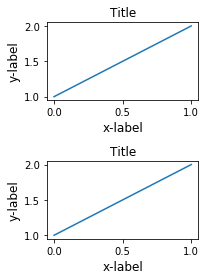
Use with GridSpec
Gridspec 拥有自己的tight_layout()方法, 当然,plt.tight_layout也是有效的
import matplotlib.gridspec as gridspec

plt.close('all')

fig = plt.figure()

gs1 = gridspec.GridSpec(2, 1)

ax1 = fig.add_subplot(gs1[0])

ax2 = fig.add_subplot(gs1[1])

example_plot(ax1)

example_plot(ax2)

gs1.tight_layout(fig)
gs.tight_layout提供rect参数,表示一个外界的框框
默认是(0, 0, 1, 1)
(x1, y1, x2, y2)
(x1, y1)矩形限制框左下角点
(x2, y2)矩形限制框右上角点
fig = plt.figure()

gs1 = gridspec.GridSpec(2, 1)

ax1 = fig.add_subplot(gs1[0])

ax2 = fig.add_subplot(gs1[1])

example_plot(ax1)

example_plot(ax2)

gs1.tight_layout(fig, rect=[0, 0, 0.5, 1])
这个功能可以很好的用在分割图形,以及分块操作上
fig = plt.figure()
gs1 = gridspec.GridSpec(2, 1)
ax1 = fig.add_subplot(gs1[0])
ax2 = fig.add_subplot(gs1[1])
example_plot(ax1)
example_plot(ax2)
gs1.tight_layout(fig, rect=[0, 0, 0.5, 1])
gs2 = gridspec.GridSpec(3, 1)
for ss in gs2:
ax = fig.add_subplot(ss)
example_plot(ax)
ax.set_title("")
ax.set_xlabel("")
ax.set_xlabel("x-label", fontsize=12)
gs2.tight_layout(fig, rect=[0.5, 0, 1, 1], h_pad=0.5)
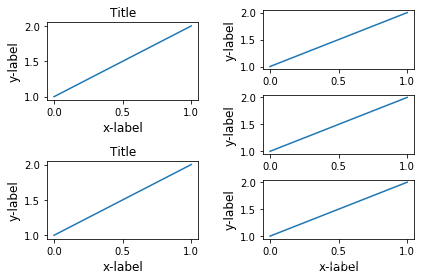
# We may try to match the top and bottom of two grids ::
#为了让俩块图形上下一致,需要进行下面的操作
top = min(gs1.top, gs2.top)
bottom = max(gs1.bottom, gs2.bottom)
gs1.update(top=top, bottom=bottom)
gs2.update(top=top, bottom=bottom)
plt.show()
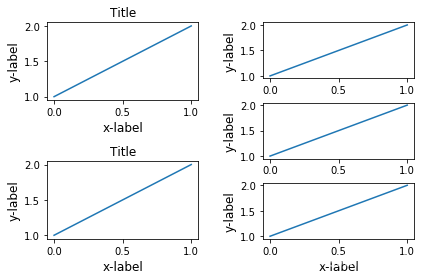
但是呢,Title和右边的边边不齐,所以框框是不包含title的?
fig = plt.gcf()

gs1 = gridspec.GridSpec(2, 1)

ax1 = fig.add_subplot(gs1[0])

ax2 = fig.add_subplot(gs1[1])

example_plot(ax1)

example_plot(ax2)

gs1.tight_layout(fig, rect=[0, 0, 0.5, 1])

gs2 = gridspec.GridSpec(3, 1)

for ss in gs2:

    ax = fig.add_subplot(ss)

    example_plot(ax)

    ax.set_title("")

    ax.set_xlabel("")

ax.set_xlabel("x-label", fontsize=12)

gs2.tight_layout(fig, rect=[0.5, 0, 1, 1], h_pad=0.5)

top = min(gs1.top, gs2.top)

bottom = max(gs1.bottom, gs2.bottom)

gs1.update(top=top, bottom=bottom)

gs2.update(top=top, bottom=bottom)

top = min(gs1.top, gs2.top)

bottom = max(gs1.bottom, gs2.bottom)

gs1.tight_layout(fig, rect=[None, 0 + (bottom-gs1.bottom),

                            0.5, 1 - (gs1.top-top)])

gs2.tight_layout(fig, rect=[0.5, 0 + (bottom-gs2.bottom),

                            None, 1 - (gs2.top-top)],

                 h_pad=0.5)
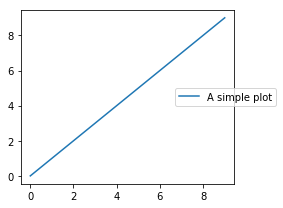
Legend and Annotations
fig, ax = plt.subplots(figsize=(4, 3))

lines = ax.plot(range(10), label='A simple plot')

ax.legend(bbox_to_anchor=(0.7, 0.5), loc='center left',)

fig.tight_layout()

plt.show()
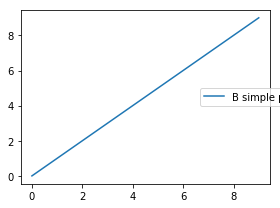
有些时候,我们不希望legend也在tight_layout的掌控范围之内,这个时候,我们可以设置leg.set_in_layout(False)
fig, ax = plt.subplots(figsize=(4, 3))

lines = ax.plot(range(10), label='B simple plot')

leg = ax.legend(bbox_to_anchor=(0.7, 0.5), loc='center left',)

leg.set_in_layout(False)

fig.tight_layout()

plt.show()
Use with AxesGrid1
没看懂
from mpl_toolkits.axes_grid1 import Grid

plt.close('all')

fig = plt.figure()

grid = Grid(fig, rect=111, nrows_ncols=(2, 2),

            axes_pad=0.25, label_mode='L',

            )

for ax in grid:

    example_plot(ax)

ax.title.set_visible(False)

plt.tight_layout()
Colorbar
plt.close('all')

arr = np.arange(100).reshape((10, 10))

fig = plt.figure(figsize=(4, 4))

im = plt.imshow(arr, interpolation="none")

plt.colorbar(im, use_gridspec=True)

plt.close('all')

arr = np.arange(100).reshape((10, 10))

fig = plt.figure(figsize=(4, 4))

im = plt.imshow(arr, interpolation="none")

plt.colorbar(im, use_gridspec=True)

plt.tight_layout()
from mpl_toolkits.axes_grid1 import make_axes_locatable

plt.close('all')

arr = np.arange(100).reshape((10, 10))

fig = plt.figure(figsize=(4, 4))

im = plt.imshow(arr, interpolation="none")

divider = make_axes_locatable(plt.gca())

cax = divider.append_axes("right", "5%", pad="3%")

plt.colorbar(im, cax=cax)

plt.tight_layout()
函数链接
matplotlib 进阶之Tight Layout guide的更多相关文章
- matplotlib 进阶之Constrained Layout Guide
目录 简单的例子 Colorbars Suptitle Legends Padding and Spacing spacing with colobars rcParams Use with Grid ...
- Safe Area Layout Guide
原文:Safe Area Layout Guide Apple在iOS 7中引入了topLayoutGuide和bottomLayoutGuide作为UIViewController属性.它们允许您创 ...
- xcode9报错 Safe Area Layout Guide before iOS9.0
运行工程的时候会遇到 Safe Area Layout Guide before iOS9.0 这是因为xcode9 storyboard的设置里面多了 个 Safe Area Layout Gu ...
- Xcode 9.0 报错, Safe Area Layout Guide Before IOS 9.0
Xcode 9.0 新建工程报错 xcode Safe Area Layout Guide Before IOS 9.0 如下图,在Builds for 选择iOS9.0 and Later,不勾选U ...
- Safe Area Layout Guide before iOS 9.0
今天使用Xcode9.1重建项目,什么都没写运行报错:Safe Area Layout Guide before iOS 9.0!目前为止,不晓得原因,现记录解决方法:
- matplotlib 进阶之Legend guide
目录 matplotlib.pyplot.legend 方法1自动检测 方法2为现有的Artist添加 方3显示添加图例 控制图例的输入 为一类Artist设置图例 Legend 的位置 loc, b ...
- Log4j2进阶使用(Pattern Layout详细设置)
1.进阶说明 通过配置Layout打印格式化的日志, Log4j2支持很多的Layouts: CSV GELF HTML JSON Pattern Serialized Syslog XML YAML ...
- iOS---------- Safe Area Layout Guide before iOS 9.0
如果你们的项目不做iOS9以下支持就打开main.storyboard 去除Use safe Area Layout 如果不考虑iOS9以下支持就按照下面的步骤 选中控制器,右边面板的Build ...
- 【python】matplotlib进阶
参考文章:https://liam0205.me/2014/09/11/matplotlib-tutorial-zh-cn/ 几个重要对象:图像.子图.坐标轴.记号 figure:图像, subplo ...
随机推荐
- Redis | 第11章 服务器的复制《Redis设计与实现》
目录 前言 1. 旧版复制功能的实现 1.1 同步与命令传播 1.2 旧版复制功能的缺陷 2. 新版复制功能的实现 2.1 部分重同步的实现原理 3. PSYNC 命令的实现 4. 复制的详细步骤 4 ...
- 零基础学习java------day3-运算符 以及eclipse的使用
今日内容: 1. 算数运算符 2. 赋值运算符 3. 关系运算符 4. 逻辑运算符 5. 位运算符 6.三目运算符 一 运算符 运算:对常量和变量进行操作的过程称为运算 运算符:对常量和变量进行操作的 ...
- 【Git项目管理】git新手入门——基础教程
一.Git工作流程 直接上手看图,了解Git工具的工作流程: 以上包括一些简单而常用的命令,但是先不关心这些,先来了解下面这4个专有名词. Workspace:工作区 Index / Stage:暂存 ...
- 集合类——Map集合、Properties属性文件操作
1.Map集合 Collection集合的特点是每次进行单个对象的保存,若要对一对对象来进行保存就只能用Map集合来保存.即Map集合中一次可以保存两个对象,且这两个对象的关系是key = value ...
- OSGi系列 - 使用Eclipse查看Bundle源码
使用Eclipse开发OSGi Bundle时,会发现有很多现成的Bundle可以用.但如何使用这些Bundle呢?除了上网搜索查资料外,阅读这些Bundle的源码也是一个很好的方法. 本文以org. ...
- request获取请求参数通用方式
package com.hopetesting.web.request;import javax.servlet.ServletException;import javax.servlet.annot ...
- java代码从出生到执行的过程浅析
阅读<深入理解java虚拟机 第二版 JVM高级特性与最佳实践> - jdk版本为1.6 1.什么是编译型语言.解释型语言 解释型语言:源代码不是直接翻译成机器语言,而是先翻译成中间代码, ...
- C++STL标准库学习笔记(三)multiset
C++STL标准库学习笔记(三)multiset STL中的平衡二叉树数据结构 前言: 在这个笔记中,我把大多数代码都加了注释,我的一些想法和注解用蓝色字体标记了出来,重点和需要关注的地方用红色字体标 ...
- 如何查看电脑IP地址
如何查看电脑的IP地址 win+r输入cmd回车,然后输入:ipconfig回车
- python函数概念
函数介绍 函数就类似与一个工具,作用就是在有需求时可以直接使用. 函数作用 1.精简代码,不需要重复写代码. 2.提高代码兼容性 3.提供返回值 函数语法结构 def 函数名(参数1, 参数2): & ...