
Jqplot 使用总结之一(线条及节点颜色)
好不容易抽出时间将Jqplot做下最后的总结,下面通过四个例子来学习Jqplot的一些常见技巧:
示例1. 设置线条颜色(包括背景色及线条颜色的批量赋值)
<!DOCTYPE html>

<html>

<head>

    <title>Jqplot Testing</title>

    <link class="include" rel="stylesheet" type="text/css" href="../jquery.jqplot.min.css" />

    <script class="include" type="text/javascript" src="http://ajax.googleapis.com/ajax/libs/jquery/1.9.1/jquery.min.js"></script>

</head>

<body>

 <div id="Chart1" style="height:400px; width:600px;"></div>

    <script type="text/javascript" class="code">

    $(document).ready(function(){

        var d1 = [[0, -10.3], [1, 7.0], [2, 15.7], [3, 0.5], [4, -10.4], [5, 1.1], [6, 13.2],[7, 1.8], [8, -4.5], [9, -1.8], [10, 2.0], [11, 3.0], [12, -3.5], [13, -7.4], [14, -11.3]];

        var d2 = [[0, 1.3], [1, 12.8], [2, -8.2], [3, -5.2], [4, 16.4], [5, -5.3], [6, 8.1],[7, 15.1], [8, -4.4], [9, 7.8], [10, -1.4], [11, 0.2], [12, 1.3], [13, 11.7], [14, -9.7]];

        var plot1 = $.jqplot('Chart1', [d1, d2], {

            grid: {

                drawBorder: false,

                shadow: false,

                //The background color of the whole chart.

                background: '#FFFFFF'

            },

            highlighter: { show: true },

            seriesDefaults: {

                shadowAlpha: 0.1,

                shadowDepth: 2,

                fillToZero: true

            },

            series: [

                {

                    color: 'red',

                    showMarker: true,

                    showLine: true,

                    markerOptions: {

                        style: 'filledCircle',

                        size: 8

                    },

                    rendererOptions: {

                        smooth: true

                    }

                },

                {

                    color: 'yellow',

                    showMarker: true,

                    showLine: true,

                    rendererOptions: {

                        smooth: true,

                    },

                    markerOptions: {

                        style: 'filledSquare',

                        size: 8

                    },

                }

            ],

            axes: {

                xaxis: {

                    pad: 1.0,

                    tickOptions: {

                      showGridline: false

                    }

                },

                yaxis: {

                    pad: 1.05

                }

            }

        });

    });

    </script>

    <script class="include" type="text/javascript" src="../jquery.jqplot.min.js"></script>

    <script class="include" type="text/javascript" src="../plugins/jqplot.highlighter.min.js"></script>

</body>

</html>
效果演示:
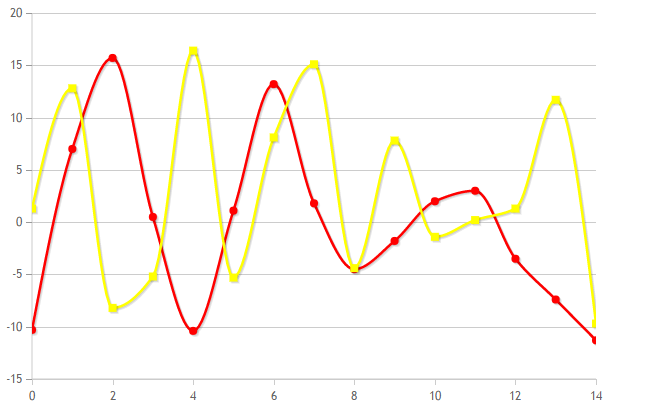
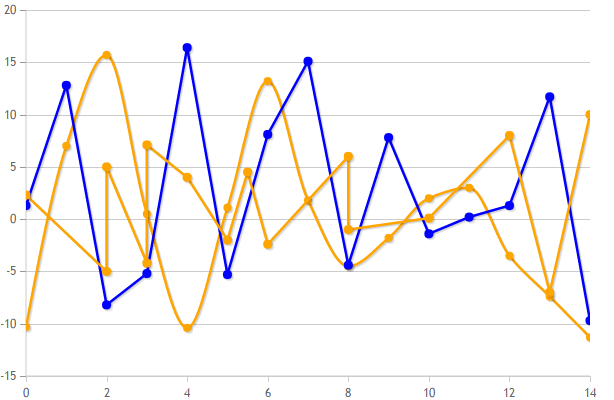
示例2. 线条常见的属性控制及特点,本例中需要注意一下两点:
A. 本例定义了两种颜色,但共有三条线,所以颜色会轮流显示;
*有时鼠标放在节点上没有值显示或线条颜色显示黑色,有可能是加的颜色Chart无法识别;
B. series: [{ show: true }, { showLine: true, showLabel: false }]
此处需要注意的是如果需要精确控制每条线的显示,有几组数据,就要写几组属性控制列表.
<!DOCTYPE html>

<html>

<head>

    <title>Jqplot Testing</title>

    <link class="include" rel="stylesheet" type="text/css" href="../jquery.jqplot.min.css" />

    <script class="include" type="text/javascript" src="http://ajax.googleapis.com/ajax/libs/jquery/1.9.1/jquery.min.js"></script>

</head>

<body>

 <div id="Chart2" style="height:400px; width:600px;"></div>

    <script type="text/javascript" class="code">

    $(document).ready(function(){

        var d1 = [[0, -10.3], [1, 7.0], [2, 15.7], [3, 0.5], [4, -10.4], [5, 1.1], [6, 13.2],[7, 1.8], [8, -4.5], [9, -1.8], [10, 2.0], [11, 3.0], [12, -3.5], [13, -7.4], [14, -11.3]];

        var d2 = [[0, 1.3], [1, 12.8], [2, -8.2], [3, -5.2], [4, 16.4], [5, -5.3], [6, 8.1],[7, 15.1], [8, -4.4], [9, 7.8], [10, -1.4], [11, 0.2], [12, 1.3], [13, 11.7], [14, -9.7]];

        var d3 = [[0, 2.3], [2, 5], [2, -5], [3, -4.2], [4, 4], [5, -2], [5.5,4.5],[3, 7.1], [6, -2.4], [8, 6], [8, -1], [10, 0.1], [12, 8], [14, 10], [13, -7]];

        var colorListForChart2 = ['orange','blue'];

        var plot2 = $.jqplot('Chart2', [d1,d2,d3], {

            grid: {

                drawBorder: false,

                shadow: false,

                //The background color of the whole chart.

                background: '#FFFFFF'

            },

            highlighter: { show: true },

            seriesDefaults: {

                shadowAlpha: 0.1,

                shadowDepth: 2,

                fillToZero: true

            },

            //总括:和chart1相比,chart2中对chart1的series进行了合并;

            //A. The usage of seriesColors;此处定义了两种颜色,但共有三条线,所以颜色会轮流显示;

            //PS.有时鼠标放在节点上没有值显示或线条颜色显示黑色,有可能是加的颜色Chart无法识别;

            seriesColors: colorListForChart2,

            //B. series: [{ show: true }, { showLine: true, showLabel: false }]

            //此处需要注意的是如果需要精确控制每条线,有几组数据,就要写几组属性控制列表.

            //此处共有三组数据,如果要精确控制每条线的显示情况,要写三组属性控制,如:[{ show: true }, { showLine: true, showLabel: false },{ showLine: true, showLabel: false }]

            series: [

                {

                    showMarker: true,

                    showLine: true,

                    markerOptions: {

                        style: 'filledCircle',

                        size: 8

                    },

                    rendererOptions: {

                        smooth: true

                    }

                }

            ],

            axes: {

                xaxis: {

                    pad: 1.0,

                    tickOptions: {

                        showGridline: false

                    }

                },

                yaxis: {

                    pad: 1.05

                }

            }

        });

    });

    </script>

    <script class="include" type="text/javascript" src="../jquery.jqplot.min.js"></script>

    <script class="include" type="text/javascript" src="../plugins/jqplot.highlighter.min.js"></script>

</body>

</html>
效果演示:
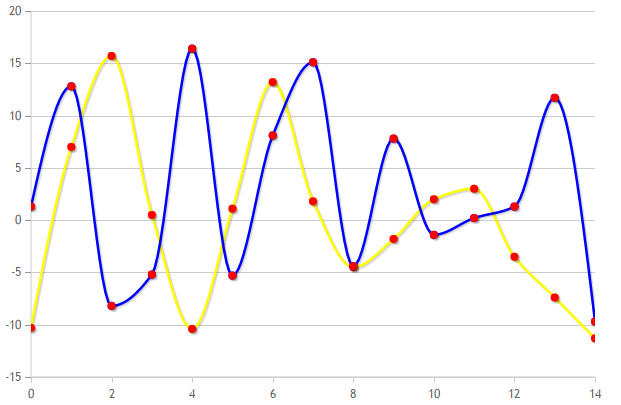
示例3. 自定义线条节点的颜色:
<!DOCTYPE html>

<html>

<head>

    <title>Jqplot Testing</title>

    <link class="include" rel="stylesheet" type="text/css" href="../jquery.jqplot.min.css" />

    <script class="include" type="text/javascript" src="http://ajax.googleapis.com/ajax/libs/jquery/1.9.1/jquery.min.js"></script>

</head>

<body>

 <div id="Chart1" style="height:400px; width:600px;"></div>

 <div id="Chart2" style="height:400px; width:600px;"></div>

 <div id="Chart3" style="height:400px; width:600px;"></div>

    <script type="text/javascript" class="code">

    $(document).ready(function(){

        var d11 = [[0, -10.3], [1, 7.0], [2, 15.7], [3, 0.5], [4, -10.4], [5, 1.1], [6, 13.2], [7, 1.8], [8, -4.5], [9, -1.8], [10, 2.0], [11, 3.0], [12, -3.5], [13, -7.4], [14, -11.3]];

        var d12 = [[0, -10.3], [1, 7.0], [2, 15.7], [3, 0.5], [4, -10.4], [5, 1.1], [6, 13.2], [7, 1.8], [8, -4.5], [9, -1.8], [10, 2.0], [11, 3.0], [12, -3.5], [13, -7.4], [14, -11.3]];

        var d21 = [[0, 1.3], [1, 12.8], [2, -8.2], [3, -5.2], [4, 16.4], [5, -5.3], [6, 8.1], [7, 15.1], [8, -4.4], [9, 7.8], [10, -1.4], [11, 0.2], [12, 1.3], [13, 11.7], [14, -9.7]];

        var d22 = [[0, 1.3], [1, 12.8], [2, -8.2], [3, -5.2], [4, 16.4], [5, -5.3], [6, 8.1], [7, 15.1], [8, -4.4], [9, 7.8], [10, -1.4], [11, 0.2], [12, 1.3], [13, 11.7], [14, -9.7]];

        var colorListForChart3 = ['yellow','red', 'blue', 'red'];

        var plot3 = $.jqplot('Chart3', [d11, d12, d21,d22], {

            grid: {

                drawBorder: false,

                shadow: false,

                //The background color of the whole chart.

                background: '#FFFFFF'

            },

            highlighter: { show: true },

            seriesDefaults: {

                shadowAlpha: 0.1,

                shadowDepth: 2,

                fillToZero: true

            },

            seriesColors: colorListForChart3,

            series: [

                {

                    showMarker: true,

                    showLine: true,

                    markerOptions: {

                        style: 'filledCircle',

                        size: 8

                    },

                    rendererOptions: {

                        smooth: true

                    }

                },

                {

                    showMarker: true,

                    showLine: false,

                    markerOptions: {

                        style: 'filledCircle',

                        size: 8

                    },

                    rendererOptions: {

                        smooth: true

                    }

                },

                {

                    showMarker: true,

                    showLine: true,

                    markerOptions: {

                        style: 'filledCircle',

                        size: 8

                    },

                    rendererOptions: {

                        smooth: true

                    }

                },

                {

                    showMarker: true,

                    showLine: false,

                    markerOptions: {

                        style: 'filledCircle',

                        size: 8

                    },

                    rendererOptions: {

                        smooth: true

                    }

                }

            ],

            axes: {

                xaxis: {

                    pad: 1.0,

                    tickOptions: {

                        showGridline: false

                    }

                },

                yaxis: {

                    pad: 1.05

                }

            }

        });

    });

    </script>

    <script class="include" type="text/javascript" src="../jquery.jqplot.min.js"></script>

    <script class="include" type="text/javascript" src="../plugins/jqplot.highlighter.min.js"></script>

</body>

</html>
效果演示:
示例4. Jqplot的实时显示效果:
关于Jqplot的实时显示效果,主要是通过setTimeout(JqplotEvent, 1000)来进行调用的,其他逻辑及显示与以上均保持一致。
Jqplot 使用总结之一(线条及节点颜色)的更多相关文章
- jqPlot图表插件学习之数据节点高亮和光标提示
一.准备工作 首先我们需要到官网下载所需的文件: 官网下载(笔者选择的是jquery.jqplot.1.0.8r1250.zip这个版本) 然后读者需要根据自己的情况新建一个项目并且按照如下的方式加载 ...
- 炎黄流程中改流程节点颜色的js
- iOS 动画绘制线条颜色渐变的折线图
效果图 .................... 概述 现状 折线图的应用比较广泛,为了增强用户体验,很多应用中都嵌入了折线图.折线图可以更加直观的表示数据的变化.网络上有很多绘制折线图的demo,有 ...
- NS2 nam中节点及数据流颜色设置
NS2 节点颜色设置在http://hi.baidu.com/jrwen0/item/d105c642f4c3ce36fb89601b说明的比較具体,大家能够參见. 我这里想说的是数据流颜色的设置,相 ...
- gephi——怎样上传节点表格而且为节点设定颜色类型
使用gephi过程中出现两个问题: 一.节点编号不安给定的属性(Nodes)编号,而是莫名其妙地从1w+開始 解决:数据列名中需包括 id.则默觉得节点编号 二.怎样在上传的数据中指定节点颜色 须要一 ...
- Tree树节点选中及取消和指定节点的隐藏
指定节点变色 指定节点隐藏 单击节点 未选中则选中该节点 已选中则取消该节点 前台: 1.HTML <ul id="listDept" name="listDept ...
- HTML5填充颜色的fillStyle测试
效果:http://hovertree.com/texiao/html5/canvas/1/ 代码: <html> <head> <meta http-equiv=&qu ...
- HTML5 Canvas 颜色填充学习
---恢复内容开始--- 如果我们想要给图形上色,有两个重要的属性可以做到:fillStyle 和 strokeStyle. fillStyle = color strokeStyle = color ...
- 大名鼎鼎的红黑树,你get了么?2-3树 绝对平衡 右旋转 左旋转 颜色反转
前言 11.1新的一月加油!这个购物狂欢的季节,一看,已囊中羞涩!赶紧来恶补一下红黑树和2-3树吧!红黑树真的算是大名鼎鼎了吧?即使你不了解它,但一定听过吧?下面跟随我来揭开神秘的面纱吧! 一.2-3 ...
随机推荐
- 关于js SDK的程序,java SDK的程序
一:JS SDK 1.修改配置workspace 2.导入 3.Demo.html <!DOCTYPE html PUBLIC "-//W3C//DTD HTML 4.01 Trans ...
- android NumberPicker 数组越界的坑
被这个问题耽误了一个多小时... 直接上解决方案,参考红色部分. private void initViews() { wheel = (NumberPicker) findViewById(R.id ...
- ios 父VIew的宽度 等于较大view的宽度,并且垂直居中
白色view上面有两个子View,红色view和橙色view.白色view的宽度等于橙色view和红色view宽度较大的一个,并且橙色view和红色view垂直居中, Masonry布局如下: ...
- php截取字符串
1.substr(源字符串,其实位置[,长度])-截取字符串返回部分字符串 <?php $str ="phpddt.com"; echo substr($str, 2); / ...
- VMware下安装虚拟机Ubuntu14.04 Server设置桥接方式
我本地的采用的上网方式的拨号上网,IP段是一公网下的通过路由设置的局域网,网段182.18.1.* 本地连接包含以下: 其中无线上网卡的.WMware桥接是自定义的局域网IP段:192.168.253 ...
- 简明python教程 --C++程序员的视角(一):数值类型、字符串、运算符和控制流
最初的步骤 Python是大小写敏感的 任何在#符号右面的内容都是注释 >>> help('print')在“print”上使用引号,那样Python就可以理解我是希望获取关于“pr ...
- Python快速建站系列-Part.Four-首页内容填充
|版权声明:本文为博主原创文章,未经博主允许不得转载. Part.Three中实现了注册和登录的功能,那这一节完成主页内容的填充,并且主页中要实现简单的可以查找代码的功能. 而且有于公共代码部分存储在 ...
- MFC 框架技术简单研讨
引用:http://www.cnblogs.com/chinazhangjie/archive/2011/09/20/2181986.html 正文: 第一讲 Win32 App 和 MFC Fr ...
- 分列:将excel单元格的内容拆分为两列
提要:处理excel数据时有时需要把单元格的内容拆分为两列,可能方便外部软件的链接,可能使数据显示更明晰等等,有人说直接剪切加粘贴不就可以了吗,但是有时数据过多,这样处理很不效率,网上搜索的方法说插入 ...
- Couchbase学习记录
Couchbase是membase的升级版,membase与memcache是同一家公司出的,Couchbase包含了memcache的功能. 从其官网上下载最新的版本安装即可.安装成功后会弹出设置页 ...