elk,centos7,filebeat,elasticsearch-head详细安装步骤
先来张图,大致结构应该晓得,对吧!

安装jdk:至少1.8以上
yum -y localinstall jdk-8u73-linux-x64.rpm
安装elasticsearch5.2.1 用普通用户安装es:
tar -zxvf elasticsearch-5.2.1.tar.gz
[es@node elasticsearch-5.2.1]$ ./bin/elasticsearch
处理错误:
ERROR: bootstrap checks failed
max file descriptors [4096] for elasticsearch process is too low, increase to at least [65536]
max virtual memory areas vm.max_map_count [65530] is too low, increase to at least [262144]
cat /etc/security/limits.conf 加上下面这个:
* soft nofile 65536
* hard nofile 131072
* soft nproc 2048
* hard nproc 4096
cat /etc/sysctl.conf
vm.max_map_count=262144
fs.file-max=65536
然后启动成功!
也可以指定名字启动:
./elasticsearch -Ecluster.name=my_cluster_name -Enode.name=my_node_name

健康基本检测
[es@node bin]$ curl -XGET '192.168.36.141:9200/_cat/master?v&pretty'
id host ip node
lbWUxIvITHy_0SufW6fBtw 192.168.36.141 192.168.36.141 my_node_name
[es@node bin]$ curl -XGET '192.168.36.141:9200/_cat/health?v&pretty'
epoch timestamp cluster status node.total node.data shards pri relo init unassign pending_tasks max_task_wait_time active_shards_percent
1499173093 08:58:13 my_cluster_name green 1 1 0 0 0 0 0 0 - 100.0%
[es@node bin]$
练习索引和文档:
新建索引,显示索引:
[es@node bin]$ curl -XPUT 'localhost:9200/customer?pretty&pretty'
[2017-07-04T09:02:16,302][INFO ][o.e.c.m.MetaDataCreateIndexService] [my_node_name] [customer] creating index, cause [api], templates [], shards [5]/[1], mappings []
{
"acknowledged" : true,
"shards_acknowledged" : true
}
[es@node bin]$ curl -XGET 'localhost:9200/_cat/indices?v&pretty'
health status index uuid pri rep docs.count docs.deleted store.size pri.store.size
yellow open customer gtxHBupjSQ-4DNgMAMnuqQ 5 1 0 0 650b 650b
[es@node bin]$
56 curl -XPUT 'localhost:9200/customer?pretty&pretty'
57 curl -XGET 'localhost:9200/_cat/indices?v&pretty'
58 curl -XPUT 'localhost:9200/customer/external/1?pretty&pretty' -H 'Content-Type: application/json' -d'
{
"name": "John Doe"
}
'
59 curl -XGET 'localhost:9200/customer/external/1?pretty&pretty'
60 curl -XDELETE 'localhost:9200/customer?pretty&pretty'
61 curl -XGET 'localhost:9200/_cat/indices?v&pretty'
62 curl -XPUT 'localhost:9200/customer/external/1?pretty&pretty' -H 'Content-Type: application/json' -d'
{
"name": "John Doe"
}
'
63 PUT /customer/external/1?pretty
64 { "name": "Jane Doe"; }
65 curl -XPUT 'localhost:9200/customer/external/1?pretty&pretty' -H 'Content-Type: application/json' -d'
{
"name": "Jane Doe"
}
'
66 PUT /customer/external/2?pretty
67 { "name": "Jane Doe"; }
68 curl -XPUT 'localhost:9200/customer/external/2?pretty&pretty' -H 'Content-Type: application/json' -d'
{
"name": "Jane Doe"
}
'
69 curl -XDELETE 'localhost:9200/customer/external/2?pretty&pretty'
官方文档说可以在kibana里面写更加直观。
反正这个装好了!下一个
安装kibana:
tar zxvf kibana-5.2.1-linux-x86_64.tar.gz
./kibana &
http://192.168.36.141:5601/status#?_g=()

先安装filebeat:
docker run -itd --name java -p 5000:22 bc74bce8afa1 镜像是我以前做的,直接用,在另外自己的一个网站上,有时间弄下来:
测试:启动我的java包nohup java -jar /data/exchange/exchange-1.4.jar & > nohup.out >/dev/null
获取 nohup.out
tar zxvf filebeat-5.2.1-linux-x86_64.tar.gz
配置:
[root@4e07f322e28f ~]# cat filebeat-5.2.1-linux-x86_64/filebeat.yml
#filebeat.prospectors:
#- input_type: log
# paths:
# - /root/logstash-tutorial.log
#output.logstash:
# hosts: ["192.168.36.150:5043"]
filebeat.prospectors:
- input_type: log
paths:
- /root/nohup.out
# - /var/log/secure
# - /var/log/messages
# - /var/log/*.log
fields:
type: syslog
output.logstash:
hosts: ["192.168.36.141:5043"]
[root@4e07f322e28f ~]#
启动filebeat:./filebeat-5.2.1-linux-x86_64/filebeat -e -c filebeat-5.2.1-linux-x86_64/filebeat.yml -d "publish"
安装logstach:
tar zxvf logstash-5.2.1.tar.gz
配置pip:
[root@node logstash-5.2.1]# cat first-pipline.conf
input {
beats {
port => 5043
# ssl => true
# ssl_certificate => "/etc/pki/tls/certs/logstash-forwarder.crt"
# ssl_key => "/etc/pki/tls/private/logstash-forwarder.key"
}
}
filter {
if [type] == "syslog" {
grok {
match => { "message" => "%{SYSLOGTIMESTAMP:syslog_timestamp} %{SYSLOGHOST:syslog_hostname} %{DATA:syslog_program}(?:\[%{POSINT:syslog_pid}\])?: %{GREEDYDATA:syslog_message}" }
add_field => [ "received_at", "%{@timestamp}" ]
add_field => [ "received_from", "%{host}" ]
}
syslog_pri { }
date {
match => [ "syslog_timestamp", "MMM d HH:mm:ss", "MMM dd HH:mm:ss" ]
}
}
}
output {
elasticsearch {
hosts => ["192.168.36.141:9200"]
sniffing => true
manage_template => false
index => "%{[@metadata][beat]}-%{+YYYY.MM.dd}"
document_type => "%{[@metadata][type]}"
}
}
启动起来:
./bin/logstash -f first-pipline.conf --config.reload.automatic
最后在kibana上面建一个索引:
好了数据出来了:

安装一个elasticsearch-head:
这里下载:https://github.com/mobz/elasticsearch-head
1050 unzip elasticsearch-head-master.zip
1051 wget https://nodejs.org/dist/v5.10.1/node-v5.10.1-linux-x64.tar.gz
1052 tar zxvf node-v5.10.1-linux-x64.tar.gz
1053 ln -s /root/node-v5.10.1-linux-x64/bin/node /usr/local/bin/node
1054 ln -s /root/node-v5.10.1-linux-x64/bin/npm /usr/local/bin/npm
1055 cd elasticsearch-head-master
1056 npm install
1057 npm install -g cnpm --registry=https://registry.npm.taobao.org
1058 su es
1059 ll
1060 vi Gruntfile.js
1061 npm install -g grunt--registry=https://registry.npm.taobao.org
1062 npm install
cat _site/app.js
this.base_uri = this.config.base_uri || this.prefs.get("app-base_uri") || "http://192.168.36.141:9200";
cat Gruntfile.js:
server: {
options: {
hostname: '192.168.36.141',
port: 9100,
base: '.',
keepalive: true
1063 cd node_modules/
1064 cd grunt
1065 cd bin/
1066 ./grunt server
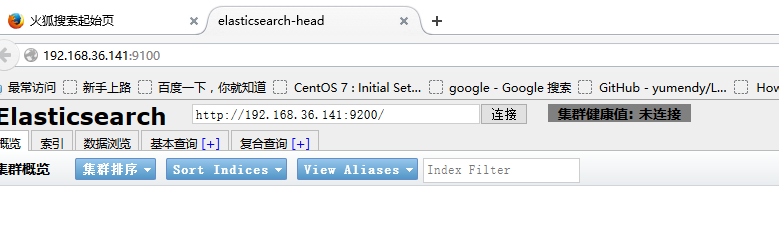
OK!!!!!
---------------我是有底线的--------------------
作者:jt
出处:http://www.cnblogs.com/Jt00/
本文版权归作者和博客园共有,欢迎转载,但未经作者同意必须保留此段声明,且在文章页面明显位置给出原文连接,否则保留追究法律责任的权利。
如果文中有什么错误,欢迎指出。以免更多的人被误导。
elk,centos7,filebeat,elasticsearch-head详细安装步骤的更多相关文章
- Linux详细安装步骤
Linux详细安装步骤(CentOS_6.7_64位) 1.先安装好VMware10软件 2.验证VM是否安装成功: (有些机器在安装vmware的时候会出现一个错误:virtual XT,这需要重启 ...
- LAMP----linux+apache+mysql+php详细安装步骤之一APACHE篇(openldap等)
LAMP----linux+apache+mysql+php详细安装步骤之一APACHE篇(openldap等) linux详细版本为RHEL5.3 [root@localhost mail]# un ...
- Hadoop HA(高可用) 详细安装步骤
什么是HA? HA是High Availability的简写,即高可用,指当当前工作中的机器宕机后,会自动处理这个异常,并将工作无缝地转移到其他备用机器上去,以来保证服务的高可用.(简言之,有两台机器 ...
- Windows下Oracle安装图解----oracle-win-64-11g 详细安装步骤
一. Oracle 下载 官方下地址 http://www.oracle.com/technetwork/database/enterprise-edition/downloads/index.htm ...
- Anaconda的详细安装步骤图文并茂
Anaconda(官方网站)就是可以便捷获取包且对包能够进行管理,同时对环境可以统一管理的发行版本.Anaconda包含了conda.Python在内的超过180个科学包及其依赖项. 事实上Anaco ...
- --nodejs详细安装步骤
什么是nodejs? 脚本语言需要一个解析器才能运行,JavaScript是脚本语言,在不同的位置有不一样的解析器,如写入html的js语言,浏览器是它的解析器角色.而对于需要独立运行的JS,node ...
- Oracle(11g)详细安装步骤
最详细的Oracle安装步骤就在这里,话不多说直接给大家上安装Oracle的详细教程 如果没有安装包,可以先点击下载下载地址:http://download.oracle.com/otn/nt/o ...
- 如何搭建SVN服务器,详细安装步骤。
SVN服务器端安装 下载: VisualSVN是一款图形化svn服务器.官网 http://www.visualsvn.com/server/ 下载地址: http://www.visualsvn.c ...
- SQL Server系列之SQL Server 2016 中文企业版详细安装步骤(超多图)
1. 下载地址 下载地址 :https://www.microsoft.com/en-us/server-cloud/products/sql-server-2016/ 官方技术文档:https:// ...
随机推荐
- 当安装mongodb客户端出现了Failed to load list of databases
在装mongodb最新版(4.1.5开发版)服务后,我用robo3t打开它的时候遇到了这个问题. 最直接的解决办法就是换一个mongodb版本,https://github.com/Studio3T/ ...
- RHCE7认证学习笔记17——KickStart安装系统
一.自动化安装系统工具 1.Cobbler 另一个自动化安装工具: 2.Kickstart 二.使用kickstart自动化安装系统 服务器安装的软件: 1.dhcp服务 [root@lin ...
- 面试官常问的10个Linux问题
1.如何暂停一个正在运行的进程,把其放在后台(不运行)? 为了停止正在运行的进程,让其再后台运行,我们可以使用组合键Ctrl+Z. 2.什么是安装Linux所需的最小分区数量,以及如何查看系统启动信息 ...
- 0301001_Lesson1&2
Lesson 1 Excuse me! 对不起! Listen to the tape then answer this question.Whose handbag is it?听录音,然后回答问题 ...
- vi编辑图
vi使用方法
- 使用Entity Framework时,序列化出错
在使用Entity Framework时,如果数据库中有两个表是一对多或者是多对多的关系,那么生成的实体类中就有一个导航属性.这个导航属性前面都加上了一个virtual关键字.这个v ...
- abtest-system后台系统设计与搭建
本文来自网易云社区 作者:刘颂 1 项目背景: 2017年5月:客户端提出增加https&dns以及双cdn业务功能 后台配合实现使用disconf配置 针对不同的域名或者请求配置不同的htt ...
- 【数据库】 SQL 通配符
[数据库] SQL 通配符 1. % : 替代一个或多个字符 2. _ : 仅替代一个字符 3. [] : 字符列中的任何单一字符 4. [^charlist] 或者 [!charlist] : 不 ...
- Redis进阶:数据持久化,安全,在PHP中使用
一.redis数据持久化 由于redis是一个内存数据库,如果系统遇到致命问题需要关机或重启,内存中的数据就会丢失,这是生产环境所不能允许的.所以redis提供了数据持久化的能力. redis提供了两 ...
- JDBC剖析篇(2):JDBC之PreparedStatement
一次有人问我为什么要使用JDBC中的PreparedStatement,我说可以“防止SQL注入”,其他的却不能说出个一二三,现在来看看其中的秘密 参考文章: http://www.jb51.net/ ...