
WPF绘制图表-LiveCharts
LiveCharts是一款非常好用的WPF图表绘制类库,相比其他同类类库,LiveCharts的UI风格样式更加多样更加美观。
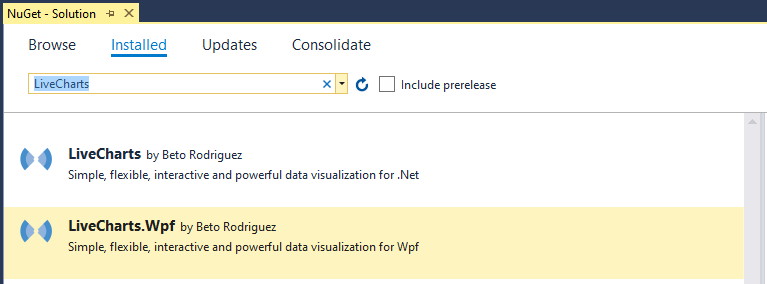
准备工作:安装以下两个类库:
1、甘特图
前台View代码


 1 <lvc:CartesianChart Grid.Row="2" Zoom="None" Margin="0,40">

 2     <lvc:CartesianChart.AxisX>

 3         <!--LabelFormatter-轴坐标标签样式;MinValue-轴坐标起点;MaxValue-轴坐标终点-->

 4         <lvc:Axis Style="{StaticResource FontChartAxis}"

 5                   LabelFormatter="{Binding Path=Formatter}"

 6                   MinValue="{Binding Path=From, Mode=TwoWay}"

 7                   MaxValue="{Binding Path=To, Mode=TwoWay}">

 8             <!--Separator-坐标平面分割线 StrokeDashArray-分割线虚线间隔-->

 9             <lvc:Axis.Separator>

10                 <lvc:Separator Stroke="#33ffffff" StrokeDashArray="10"/>

11             </lvc:Axis.Separator>

12         </lvc:Axis>

13     </lvc:CartesianChart.AxisX>

14     <lvc:CartesianChart.AxisY>

15         <!--Labels-轴坐标标签列表-->

16         <lvc:Axis Style="{StaticResource FontChartAxis}"

17                   Labels="{Binding Path=Labels}">

18             <lvc:Axis.Separator>

19                 <lvc:Separator Stroke="#33ffffff" StrokeDashArray="10"/>

20             </lvc:Axis.Separator>

21         </lvc:Axis>

22     </lvc:CartesianChart.AxisY>

23     <!--Series-数据序列-->

24     <lvc:CartesianChart.Series>

25         <!--RowSeries-数据序列按行显示 LabelPosition-数据标签位置 DataLabels-是否显示数据标签 Values-数据序列值-->

26         <lvc:RowSeries Style="{StaticResource FontRowSeries}"

27                        Fill="#008bd3" LabelsPosition="Parallel" DataLabels="True" Values="{Binding Path=Values}"/>

28     </lvc:CartesianChart.Series>

29 </lvc:CartesianChart>
Gantt Chart xaml
后台ViewModel代码
 1 private double _from;

 2 private double _to;

 3 private Func<double, string> _formatter;

 4 private string[] _labels;

 5 private ChartValues<GanttPoint> _values;

 6 public double From { get { return _from; } set { _from = value; NotifyOfPropertyChange(() => From); } }

 7 public double To { get { return _to; } set { _to = value; NotifyOfPropertyChange(() => To); } }

 8 public Func<double, string> Formatter { get { return _formatter; } set { _formatter = value; NotifyOfPropertyChange(() => Formatter); } }

 9 public string[] Labels { get { return _labels; } set { _labels = value; NotifyOfPropertyChange(() => Labels); } }

10 public ChartValues<GanttPoint> Values { get { return _values; } set { _values = value; NotifyOfPropertyChange(() => Values); } }

11

12 public void ShowGanttChart()

13 {

14     var now = DateTime.Now;

15

16     Values = new ChartValues<GanttPoint>

17     {

18         new GanttPoint(now.Ticks, now.AddSeconds(2).Ticks),

19         new GanttPoint(now.AddSeconds(1).Ticks, now.AddSeconds(3).Ticks),

20         new GanttPoint(now.AddSeconds(3).Ticks, now.AddSeconds(5).Ticks),

21         new GanttPoint(now.AddSeconds(5).Ticks, now.AddSeconds(8).Ticks),

22         new GanttPoint(now.AddSeconds(6).Ticks, now.AddSeconds(10).Ticks)

23     };

24

25     Formatter = value => new DateTime((long)value).ToString("MM-dd HH:mm:ss");

26

27     Labels = new[]

28     {

29         "原材料出库", "智能装配","个性化定制", "智能包装", "智能仓储"

30     };

31     From = _values.First().StartPoint;

32     To = _values.Last().EndPoint;

33 }
Gantt Chart cs
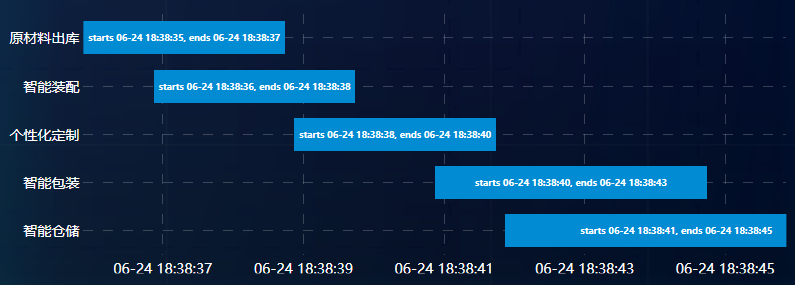
效果图
2、进度环
前台View代码
 1 <!--Gauge进度环 GaugeBackground背景环颜色 HighFontSize环内数字字号 Uses360Mode半圆还是整圆 InnerRadius内圆半径 Value环内数字值-->

 2 <lvc:Gauge Grid.Row="0" GaugeBackground="#11ffffff" HighFontSize="24"

 3            Uses360Mode="False" From="0" To="100" InnerRadius="35" Value="{Binding OrderProgress}" >

 4     <!--该设置:起点零点 方向逆时针-->

 5     <lvc:Gauge.GaugeRenderTransform>

 6         <TransformGroup>

 7             <RotateTransform Angle="90"></RotateTransform>

 8             <ScaleTransform ScaleX="-1"></ScaleTransform>

 9         </TransformGroup>

10     </lvc:Gauge.GaugeRenderTransform>

11     <!--设置圆环的颜色渐变-->

12     <lvc:Gauge.GaugeActiveFill>

13         <LinearGradientBrush>

14             <GradientStop Color="#539fff" Offset="0.0" />

15             <GradientStop Color="#00eaff" Offset="0.5" />

16             <GradientStop Color="#6af0ff" Offset="1.0" />

17         </LinearGradientBrush>

18     </lvc:Gauge.GaugeActiveFill>

19 </lvc:Gauge>
Gauge xaml
后台ViewModel代码
1 private double _orderProgress;

2 public double OrderProgress { get { return _orderProgress; } set { _orderProgress = value; NotifyOfPropertyChange(() => OrderProgress); } }

3

4 private void ShowGauge()

5 {

6     OrderProgress = 90;

7 }
Gauge cs
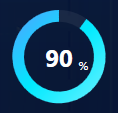
效果图
3、柱状堆积图
前台View代码
 1 <!--柱状堆积图-->

 2 <!--LegendLocation图例位置-->

 3 <lvc:CartesianChart Grid.Column="1" LegendLocation="Right" Margin="20,0">

 4     <lvc:CartesianChart.AxisX>

 5         <lvc:Axis Style="{StaticResource FontChartAxis}" Labels="{Binding Labels}" Title="时间">

 6             <lvc:Axis.Separator>

 7                 <!--Step柱间隔-->

 8                 <lvc:Separator Step="5" Stroke="#33ffffff" StrokeDashArray="10"/>

 9             </lvc:Axis.Separator>

10         </lvc:Axis>

11     </lvc:CartesianChart.AxisX>

12     <lvc:CartesianChart.AxisY>

13         <lvc:Axis Style="{StaticResource FontChartAxis}" Title="数量">

14             <lvc:Axis.Separator>

15                 <lvc:Separator Stroke="#33ffffff" StrokeDashArray="10"/>

16             </lvc:Axis.Separator>

17         </lvc:Axis>

18     </lvc:CartesianChart.AxisY>

19     <lvc:CartesianChart.Series>

20         <!--StackedColumnSeries要比较的其中一类 MaxColumnWidth柱状图宽度 DataLabels是否显示柱状图数值 Title图例中名称-->

21         <lvc:StackedColumnSeries Style="{StaticResource FontStackedColumnSeries}"

22                                  Fill="#222222" LabelsPosition="Merged" MaxColumnWidth="20" DataLabels="True"

23                                  Values="{Binding V1}" Title="黑色U盘">

24         </lvc:StackedColumnSeries>

25         <lvc:StackedColumnSeries Style="{StaticResource FontStackedColumnSeries}"

26                                  Fill="#26def2" LabelsPosition="Merged" MaxColumnWidth="20" DataLabels="True"

27                                  Values="{Binding V2}" Title="蓝色U盘">

28         </lvc:StackedColumnSeries>

29         <lvc:StackedColumnSeries Style="{StaticResource FontStackedColumnSeries}"

30                                  Fill="#ee6363" LabelsPosition="Merged" MaxColumnWidth="20" DataLabels="True"

31                                  Values="{Binding V3}" Title="红色U盘">

32         </lvc:StackedColumnSeries>

33     </lvc:CartesianChart.Series>

34     <lvc:CartesianChart.ChartLegend>

35         <!--BulletSize图例中圆点尺寸-->

36         <lvc:DefaultLegend BulletSize="12" Style="{StaticResource FontChartLegend}"/>

37     </lvc:CartesianChart.ChartLegend>

38 </lvc:CartesianChart>
StackedColumn xaml
后台ViewModel代码
 1 private string[] _labels;

 2 private IChartValues _v1;

 3 private IChartValues _v2;

 4 private IChartValues _v3;

 5 public IChartValues V1 { get { return _v1; } set { _v1 = value; NotifyOfPropertyChange(() => V1); } }

 6 public IChartValues V2 { get { return _v2; } set { _v2 = value; NotifyOfPropertyChange(() => V2); } }

 7 public IChartValues V3 { get { return _v3; } set { _v3 = value; NotifyOfPropertyChange(() => V3); } }

 8 public string[] Labels { get { return _labels; } set { _labels = value; NotifyOfPropertyChange(() => Labels); } }

 9 private void ShowStackedColumn()

10 {

11     V1 = new ChartValues<ObservableValue>

12             {

13                 new ObservableValue(5),

14                 new ObservableValue(8),

15                 new ObservableValue(2),

16                 new ObservableValue(4),

17                 new ObservableValue(6),

18                 new ObservableValue(2),

19                 new ObservableValue(9),

20                 new ObservableValue(4),

21                 new ObservableValue(6),

22                 new ObservableValue(2),

23                 new ObservableValue(9),

24                 new ObservableValue(3)

25             };

26     V2 = new ChartValues<ObservableValue>

27             {

28                 new ObservableValue(5),

29                 new ObservableValue(8),

30                 new ObservableValue(2),

31                 new ObservableValue(4),

32                 new ObservableValue(6),

33                 new ObservableValue(2),

34                 new ObservableValue(9),

35                 new ObservableValue(4),

36                 new ObservableValue(6),

37                 new ObservableValue(2),

38                 new ObservableValue(9),

39                 new ObservableValue(3)

40             };

41     V3 = new ChartValues<ObservableValue>

42             {

43                 new ObservableValue(5),

44                 new ObservableValue(8),

45                 new ObservableValue(2),

46                 new ObservableValue(4),

47                 new ObservableValue(6),

48                 new ObservableValue(2),

49                 new ObservableValue(9),

50                 new ObservableValue(4),

51                 new ObservableValue(6),

52                 new ObservableValue(2),

53                 new ObservableValue(9),

54                 new ObservableValue(3)

55             };

56

57     Labels = new[]

58     {

59         "1月", "2月","3月", "4月", "5月", "6月", "7月", "8月", "9月", "10月", "11月", "12月"

60     };

61 }
StackedColumn cs
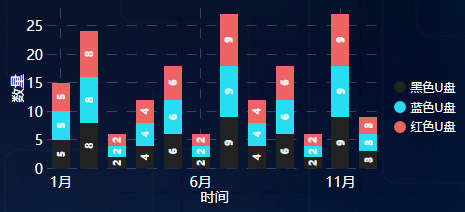
效果图
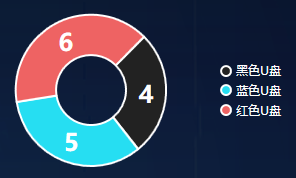
4、饼状图
前台代码
 1 <!--环形饼状图-->

 2 <!--InnerRadius内圆半径-->

 3 <lvc:PieChart Grid.Column="0"  Margin="80,25" LegendLocation="Right" InnerRadius="35">

 4     <lvc:PieChart.Series>

 5         <!--PieSeries要比较的其中一类 -->

 6         <lvc:PieSeries Style="{StaticResource FontPieSeries}" Fill="#222222" DataLabels="True" Values="4" Title="黑色U盘"/>

 7         <lvc:PieSeries Style="{StaticResource FontPieSeries}" Fill="#26def2" DataLabels="True" Values="5" Title="蓝色U盘"/>

 8         <lvc:PieSeries Style="{StaticResource FontPieSeries}" Fill="#ee6363" DataLabels="True" Values="6" Title="红色U盘"/>

 9     </lvc:PieChart.Series>

10     <lvc:PieChart.ChartLegend>

11         <lvc:DefaultLegend BulletSize="12" Style="{StaticResource FontChartLegend}"/>

12     </lvc:PieChart.ChartLegend>

13 </lvc:PieChart>
Pie xaml
效果图
或者:
前台代码
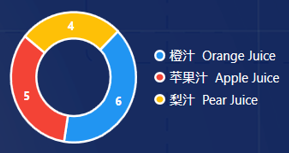
1 <lvc:PieChart Name="Chart" Grid.Row="1" Grid.Column="3" Grid.ColumnSpan="4"

2                               Series="{Binding OrderCountSeries}" Margin="0,0,35,0" LegendLocation="Right" InnerRadius="25">

3                     <lvc:PieChart.ChartLegend>

4                         <lvc:DefaultLegend BulletSize="18" Style="{StaticResource FontDefaultStyle}"></lvc:DefaultLegend>

5                     </lvc:PieChart.ChartLegend>

6                 </lvc:PieChart>
Pie2 xaml
后台代码
 1 private SeriesCollection _orderCountSeries;

 2 public SeriesCollection OrderCountSeries { get { return _orderCountSeries; } set { _orderCountSeries = value; NotifyOfPropertyChange(() => OrderCountSeries); } }

 3 public ObservableValue OrangeOrderCount { get; set; } = new ObservableValue();

 4 public ObservableValue AppleOrderCount { get; set; } = new ObservableValue();

 5 public ObservableValue PearOrderCount { get; set; } = new ObservableValue();

 6

 7 private void InitializeChartSeries()

 8 {

 9     OrderCountSeries = new SeriesCollection

10     {

11         new PieSeries

12         {

13             Title = "橙    汁    Orange",

14             Values = new ChartValues<ObservableValue> { new ObservableValue() },

15             DataLabels = true,

16             FontSize = 28

17         },

18         new PieSeries

19         {

20             Title = "苹果汁    Apple",

21             Values = new ChartValues<ObservableValue> { new ObservableValue() },

22             DataLabels = true,

23             FontSize = 28

24         },

25         new PieSeries

26         {

27             Title = "梨    汁    Pear",

28             Values = new ChartValues<ObservableValue> { new ObservableValue() },

29             DataLabels = true,

30             FontSize = 28

31         }

32     };

33 }

34

35 private void UpdateChartSeries()

36 {

37     OrangeOrderCount.Value = TodaysFinishedOrderList != null ? TodaysFinishedOrderList.FindAll(o => o.PRODUCT_CODE == (int)ItemType.Orange).Count : 0;

38     AppleOrderCount.Value = TodaysFinishedOrderList != null ? TodaysFinishedOrderList.FindAll(o => o.PRODUCT_CODE == (int)ItemType.Apple).Count : 0;

39     PearOrderCount.Value = TodaysFinishedOrderList != null ? TodaysFinishedOrderList.FindAll(o => o.PRODUCT_CODE == (int)ItemType.Pear).Count : 0;

40

41     OrderCountSeries[0].Values[0] = OrangeOrderCount;

42     OrderCountSeries[1].Values[0] = AppleOrderCount;

43     OrderCountSeries[2].Values[0] = PearOrderCount;

44 }
Pie2 cs
效果图
5、柱状图
前台代码
 1 <!--LegendLocation图例位置-->

 2 <lvc:CartesianChart Margin="20,75,20,15">

 3     <lvc:CartesianChart.AxisX>

 4         <lvc:Axis Style="{StaticResource FontChartAxis}" FontSize="12" Labels="{Binding Path=StorageLabels}" Title="库位" LabelsRotation="20">

 5             <lvc:Axis.Separator>

 6                 <!--Step柱间隔-->

 7                 <lvc:Separator Step="1" IsEnabled="False"/>

 8             </lvc:Axis.Separator>

 9         </lvc:Axis>

10     </lvc:CartesianChart.AxisX>

11     <lvc:CartesianChart.AxisY>

12         <lvc:Axis Style="{StaticResource FontChartAxis}" FontSize="12" Title="百分比" LabelFormatter="{Binding Path=AxisPercentage}">

13             <lvc:Axis.Separator>

14                 <lvc:Separator Stroke="#33ffffff" StrokeDashArray="10"/>

15             </lvc:Axis.Separator>

16         </lvc:Axis>

17     </lvc:CartesianChart.AxisY>

18     <lvc:CartesianChart.Series>

19         <lvc:ColumnSeries Style="{StaticResource FontColumnSeries}" Values="{Binding Path=StoragePercentages}"

20                           DataLabels="True" LabelsPosition="Top"/>

21     </lvc:CartesianChart.Series>

22     <lvc:CartesianChart.ChartLegend>

23         <!--BulletSize图例中圆点尺寸-->

24         <lvc:DefaultLegend BulletSize="12" Style="{StaticResource FontChartLegend}"/>

25     </lvc:CartesianChart.ChartLegend>

26 </lvc:CartesianChart>
Column xaml
后台代码
 1 private Func<double, string> _axisPercentage;

 2 private string[] _storageLabels;

 3 private IChartValues _storagePercentages;

 4 public Func<double, string> AxisPercentage { get { return _axisPercentage; } set { _axisPercentage = value; NotifyOfPropertyChange(() => AxisPercentage); } }

 5 public string[] StorageLabels { get { return _storageLabels; } set { _storageLabels = value; NotifyOfPropertyChange(() => StorageLabels); } }

 6 public IChartValues StoragePercentages { get { return _storagePercentages; } set { _storagePercentages = value; NotifyOfPropertyChange(() => StoragePercentages); } }

 7 private void ShowStoragePercentageColumnChart()

 8 {

 9     StorageLabels = new[]

10     {

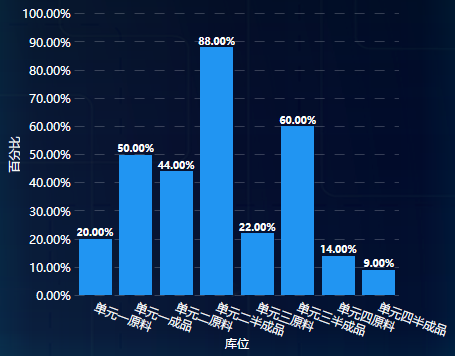
11         "单元一原料","单元一成品","单元二原料","单元二半成品","单元三原料","单元三半成品","单元四原料","单元四半成品"

12     };

13     AxisPercentage = val => val.ToString("P");

14     StoragePercentages = new ChartValues<double> { 0.2, 0.5, 0.44, 0.88, 0.22, 0.6, 0.14, 0.09 };

15 }
Column cs
效果图
6、折线图
前台代码
 1 <lvc:CartesianChart Grid.Column="2" LegendLocation="Right" Margin="15,0">

 2     <lvc:CartesianChart.AxisX>

 3         <lvc:Axis Style="{StaticResource FontChartAxis}" FontSize="12" Labels="{Binding Path=XTimeLabels}" Title="时间" LabelsRotation="40">

 4             <lvc:Axis.Separator>

 5                 <!--Step柱间隔-->

 6                 <lvc:Separator Step="1" IsEnabled="False"/>

 7             </lvc:Axis.Separator>

 8         </lvc:Axis>

 9     </lvc:CartesianChart.AxisX>

10     <lvc:CartesianChart.AxisY>

11         <lvc:Axis Style="{StaticResource FontChartAxis}" FontSize="12" Title="百分比" LabelFormatter="{Binding Path=YPercentageFormat}">

12             <lvc:Axis.Separator>

13                 <lvc:Separator Stroke="#33ffffff" StrokeDashArray="10"/>

14             </lvc:Axis.Separator>

15         </lvc:Axis>

16     </lvc:CartesianChart.AxisY>

17     <lvc:CartesianChart.Series>

18         <lvc:LineSeries Values="{Binding OccupancyRatesCell1}" PointGeometrySize="2" Stroke="#00f5ff" Fill="#1100f5ff" LineSmoothness="0" Title="一单元"/>

19         <lvc:LineSeries Values="{Binding OccupancyRatesCell2}" PointGeometrySize="2" Stroke="#ccffcc" Fill="#11ccffcc" LineSmoothness="0" Title="二单元"/>

20         <lvc:LineSeries Values="{Binding OccupancyRatesCell3}" PointGeometrySize="2" Stroke="#333399" Fill="#11333399" LineSmoothness="0" Title="三单元"/>

21         <lvc:LineSeries Values="{Binding OccupancyRatesCell4}" PointGeometrySize="2" Stroke="#9966cc" Fill="#119966cc" LineSmoothness="0" Title="四单元"/>

22     </lvc:CartesianChart.Series>

23     <lvc:CartesianChart.ChartLegend>

24         <!--BulletSize图例中圆点尺寸-->

25         <lvc:DefaultLegend BulletSize="12" Style="{StaticResource FontChartLegend}"/>

26     </lvc:CartesianChart.ChartLegend>

27 </lvc:CartesianChart>
Line xaml
后台代码
 1 private string[] _xTimeLabels;

 2 private Func<double, string> _yPercentageFormat;

 3 private ChartValues<double> _occupancyRatesCell1;

 4 private ChartValues<double> _occupancyRatesCell2;

 5 private ChartValues<double> _occupancyRatesCell3;

 6 private ChartValues<double> _occupancyRatesCell4;

 7 public string[] XTimeLabels { get { return _xTimeLabels; } set { _xTimeLabels = value; NotifyOfPropertyChange(() => XTimeLabels); } }

 8 public Func<double, string> YPercentageFormat { get { return _yPercentageFormat; } set { _yPercentageFormat = value; NotifyOfPropertyChange(() => YPercentageFormat); } }

 9 public ChartValues<double> OccupancyRatesCell1 { get { return _occupancyRatesCell1; } set { _occupancyRatesCell1 = value; NotifyOfPropertyChange(() => OccupancyRatesCell1); } }

10 public ChartValues<double> OccupancyRatesCell2 { get { return _occupancyRatesCell2; } set { _occupancyRatesCell2 = value; NotifyOfPropertyChange(() => OccupancyRatesCell2); } }

11 public ChartValues<double> OccupancyRatesCell3 { get { return _occupancyRatesCell3; } set { _occupancyRatesCell3 = value; NotifyOfPropertyChange(() => OccupancyRatesCell3); } }

12 public ChartValues<double> OccupancyRatesCell4 { get { return _occupancyRatesCell4; } set { _occupancyRatesCell4 = value; NotifyOfPropertyChange(() => OccupancyRatesCell4); } }

13 private void InitOccupancyRate()

14 {

15     YPercentageFormat = value => value.ToString("P0"); //P0表示只保留整数,P表示保留小数点后两位

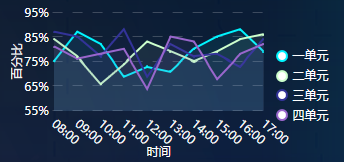
16     XTimeLabels = new[] { "08:00", "09:00", "10:00", "11:00", "12:00", "13:00", "14:00", "15:00", "16:00", "17:00" }; ;

17     OccupancyRatesCell1 = new ChartValues<double> { 0.75, 0.87, 0.82, 0.69, 0.73, 0.71, 0.80, 0.85, 0.88, 0.79 };

18     OccupancyRatesCell2 = new ChartValues<double> { 0.84, 0.77, 0.66, 0.74, 0.83, 0.79, 0.75, 0.79, 0.84, 0.86 };

19     OccupancyRatesCell3 = new ChartValues<double> { 0.87, 0.85, 0.77, 0.88, 0.69, 0.82, 0.77, 0.78, 0.73, 0.84 };

20     OccupancyRatesCell4 = new ChartValues<double> { 0.81, 0.76, 0.78, 0.80, 0.64, 0.85, 0.83, 0.68, 0.78, 0.82 };

21 }
Line cs
效果图
7、LiveCharts所用到的样式Style.xaml
 1 <!--LiveCharts文字样式-->

 2 <!--图表坐标轴文字-->

 3 <Style x:Key="FontChartAxis" TargetType="{x:Type lvc:Axis}">

 4     <Setter Property="HorizontalAlignment" Value="Center"/>

 5     <Setter Property="VerticalAlignment" Value="Center"/>

 6     <Setter Property="FontFamily" Value="Microsoft Yahei"/>

 7     <Setter Property="FontSize" Value="14"/>

 8     <Setter Property="Foreground" Value="White"/>

 9 </Style>

10 <!--柱状堆积图文字-->

11 <Style x:Key="FontStackedColumnSeries" TargetType="{x:Type lvc:StackedColumnSeries}">

12     <Setter Property="HorizontalAlignment" Value="Center"/>

13     <Setter Property="VerticalAlignment" Value="Center"/>

14     <Setter Property="FontFamily" Value="Microsoft Yahei"/>

15     <Setter Property="FontSize" Value="10"/>

16     <Setter Property="Foreground" Value="White"/>

17 </Style>

18 <!--柱状图文字-->

19 <Style x:Key="FontColumnSeries" TargetType="{x:Type lvc:ColumnSeries}">

20     <Setter Property="HorizontalAlignment" Value="Center"/>

21     <Setter Property="VerticalAlignment" Value="Center"/>

22     <Setter Property="FontFamily" Value="Microsoft Yahei"/>

23     <Setter Property="FontSize" Value="10"/>

24     <Setter Property="Foreground" Value="White"/>

25 </Style>

26 <!--图例文字-->

27 <Style x:Key="FontChartLegend" TargetType="{x:Type lvc:DefaultLegend}">

28     <Setter Property="HorizontalAlignment" Value="Center"/>

29     <Setter Property="VerticalAlignment" Value="Center"/>

30     <Setter Property="FontFamily" Value="Microsoft Yahei"/>

31     <Setter Property="FontSize" Value="12"/>

32     <Setter Property="Foreground" Value="White"/>

33 </Style>

34 <!--图表行文字-->

35 <Style x:Key="FontRowSeries" TargetType="{x:Type lvc:RowSeries}">

36     <Setter Property="HorizontalAlignment" Value="Center"/>

37     <Setter Property="VerticalAlignment" Value="Center"/>

38     <Setter Property="FontFamily" Value="Microsoft Yahei"/>

39     <Setter Property="FontSize" Value="9"/>

40     <Setter Property="Foreground" Value="White"/>

41 </Style>

42 <!--饼状图文字-->

43 <Style x:Key="FontPieSeries" TargetType="{x:Type lvc:PieSeries}">

44     <Setter Property="HorizontalAlignment" Value="Center"/>

45     <Setter Property="VerticalAlignment" Value="Center"/>

46     <Setter Property="FontFamily" Value="Microsoft Yahei"/>

47     <Setter Property="FontSize" Value="24"/>

48     <Setter Property="Foreground" Value="White"/>

49 </Style>
style
WPF绘制图表-LiveCharts的更多相关文章
- WPF 应用 - 图表 LiveCharts
引用:LiveCharts,LiveCharts.Wpf 1. 示例 折线图 <Window ... xmlns:lvc="clr-namespace:LiveCharts.Wpf;a ...
- 使用D3绘制图表(7)--饼状图
这次是绘制饼状图,也是这一次使用D3绘制图表的最后一篇,大家可以从其他地方深入学习D3绘制图表,也可以直接查看D3的API进行学习,本次绘制饼状图的数据跟之前的卸载数组里面的不一样,这一次是使用d3的 ...
- 网页绘制图表 Google Charts with JavaScript #2 ....与ASP.NET网页结合 (ClientScriptManager.RegisterStartupScript 方法)
此为文章备份,原文出处(我的网站) 网页绘制图表 Google Charts with JavaScript #2 ....与ASP.NET网页结合 (ClientScriptManager.Regi ...
- 网页绘制图表 Google Charts with JavaScript #1....好强、好简单啊!
此为文章备份,原文出处(我的网站) 网页绘制图表 Google Charts with JavaScript....好强.好简单啊!#1 http://www.dotblogs.com.tw/mis2 ...
- DevExpress使用之ChartControl控件绘制图表(多坐标折线图、柱状图、饼状图)
最近因为公司项目需要用到WinForm的DecExpress控件,在这里把一些使用方法总结一下. DevExpress中有一个专门用来绘制图表的插件ChartControl,可以绘制折线图.饼状图.柱 ...
- ZedGrap控件绘制图表曲线
问题描述: 使用C#中ZedGrap控件绘制图表曲线图 ZedGrap 介绍说明: 安装ZedGrap控件 ZedGraph控件dll文件: 添加ZedGraph控件,首先在新建立的C#图像工 ...
- c#调用Excel绘制图表
c#调用Excel需要引用命名空间 using Microsoft.Office.Interop.Excel; 由于该程序不复杂,主要是根据不同数据画表和图,画的图像也并不复杂,因为画图和画表的操作会 ...
- WPF绘制党徽(立体效果,Cool)
原文:WPF绘制党徽(立体效果,Cool) 前面用WPF方式绘制了党旗(WPF制作的党旗) ,去年3月份利用C# 及GDI+绘制过党徽,这次使用WPF来绘制党徽. ------------------ ...
- vue+echarts 动态绘制图表以及异步加载数据
前言 背景:vue写的后台管理,需要将表格数据绘制成图表(折线图,柱状图),图表数据都是通过接口请求回来的. 安装 cnpm install echarts --s (我这里用了淘宝镜像,不知道同学自 ...
随机推荐
- Photoshop如何快速扣取图标
由于图标往往与背景色区别很大,因此首先使用魔棒工具快速选择出图标 有时候选择出来是图标,有时候是背景色 可以通过选择反向来调节(右键即可) ctrl + J 提取出选择的区域 这时进行等分裁剪即可 点 ...
- Python 序列类型小结
序列是python中最基本的数据结构. 序列中每一个元素都有其对应的索引,索引是从0开始,0,1,2......依次类推 python中的序列类型有:字符串str.列表list.元组tuple.Uni ...
- hadoop面试
hadoop.apache.orgspark.apache.orgflink.apache.orghadoop :HDFS/YARN/MAPREDUCE HDFS读写流程 NameNode DataN ...
- IO多路复用原理&场景
目录 IO多路复用的历史 阻塞 IO 非阻塞 IO IO 多路复用 select poll epoll IO多路复用高效的原因 IO多路复用解决的什么问题 epoll比selector性能一定更好吗 ...
- LVS调度算法总结
LVS 调试算法分为两种:静态方法和动态方法. 静态方法 RR:轮询 WRR:加权轮询 SH:源地址哈希,将来自于同一个IP地址的请求始终发往第一次挑中的RS,从而实现会话绑定 DH:目标地址哈希,第 ...
- 利用Tensorboard可视化模型、数据和训练过程
在60分钟闪电战中,我们像你展示了如何加载数据,通过为我们定义的nn.Module的子类的model提供数据,在训练集上训练模型,在测试集上测试模型.为了了解发生了什么,我们在模型训练时打印了一些统计 ...
- dfs+search
1.数的划分 点击查看搜索 #include<iostream> #include<cstdio> #include<cmath> #include<algo ...
- Solution -「ARC 101E」「AT 4352」Ribbons on Tree
\(\mathcal{Description}\) Link. 给定一棵 \(n\) 个点的树,其中 \(2|n\),你需要把这些点两两配对,并把每对点间的路径染色.求使得所有边被染色的方案数 ...
- 今天你花里胡哨了吗 --- 定制属于自己的linux ssh迎宾信息
请开始你的表演 linux-oz6w:~ # cat << 'eof' > /etc/profile.d/ssh-login-info.sh #!/bin/sh # 输出一个图像 e ...
- 多端开发之uniapp开发app
最近在给f做一些工具app,学习了不少关于uniapp编写android应用的知识. 首先,App应用的创建的时候要选择项目类型为uniapp类型.最开始我选择的是h5+项目,这种项目就比较容易写成纯 ...