zabbix4.2配置监控nginx服务
1.监控原理
通过status模块监控(--with-http_stub_status_module)

2.修改nginx配置(/etc/nginx/conf.d/default.conf)
在被监控的主机上修改nginx配置文件,在配置文件中添加(一个location)下面的内容,修改后记得重启nginx服务:
 location /nginx_status {

                stub_status on;

                allow 192.168.10.100;    #表示允许该主机访问url:http://192.168.10.100/nginx_status

                allow 192.168.10.2;

                access_log off;

        }
3.添加监控脚本
在nginx服务器主机上添加监控nginx脚本(/etc/zabbix/zabbix_agent.d/nginx_status.sh,同时赋予该脚本可执行权限chmod a+x nginx_status.sh
#!/bin/bash

#Script to fetch nginx statuses for monitoring systems

    HOST="192.168.10.100"   #IP地址为装有nginx服务的主机地址

    PORT="80"

    function ping {

        /sbin/pidof nginx | wc -l

    }

    function active {

        /usr/bin/curl "http://$HOST:$PORT/nginx_status/" 2>/dev/null| grep 'Active' | awk '{print $NF}'

    }

    function reading {

        /usr/bin/curl "http://$HOST:$PORT/nginx_status/" 2>/dev/null| grep 'Reading' | awk '{print $2}'

    }

    function writing {

        /usr/bin/curl "http://$HOST:$PORT/nginx_status/" 2>/dev/null| grep 'Writing' | awk '{print $4}'

    }

    function waiting {

        /usr/bin/curl "http://$HOST:$PORT/nginx_status/" 2>/dev/null| grep 'Waiting' | awk '{print $6}'

    }

    function accepts {

        /usr/bin/curl "http://$HOST:$PORT/nginx_status/" 2>/dev/null| awk NR==3 | awk '{print $1}'

    }

    function handled {

        /usr/bin/curl "http://$HOST:$PORT/nginx_status/" 2>/dev/null| awk NR==3 | awk '{print $2}'

    }

    function requests {

        /usr/bin/curl "http://$HOST:$PORT/nginx_status/" 2>/dev/null| awk NR==3 | awk '{print $3}'

    }

    $1
4.进行访问测试检测
[root@zabbix-server-center alertscripts]# curl http://192.168.10.100/nginx_status   #IP地址为nginx服务器的主机地址

Active connections: 1

server accepts handled requests

 1 1 1

Reading: 0 Writing: 1 Waiting: 0
5.检测脚本测试
关于nginx状态的一些概念:
Active connections  Nginx正处理的活动链接数个数;重要

server              Nginx启动到现在共处理了多少个连接。

accepts             Nginx启动到现在共成功创建几次握手。

handled requests    Nginx总共处理了几次请求。

Reading             Nginx读取到客户端的 Header 信息数。

Writing             Nginx返回给客户端的 Header 信息数。

Waiting             Nginx已经处理完正在等候下一次请求指令的驻留链接,开启。

Keep-alive的情况下,Waiting这个值等于active-(reading + writing)。

请求丢失数=(握手数-连接数)可以看出,本次状态显示没有丢失请求。
[root@zabbix-server-center alertscripts]# sh nginx_status.sh active

1

[root@zabbix-server-center alertscripts]# sh nginx_status.sh reading

0

[root@zabbix-server-center alertscripts]# sh nginx_status.sh writing

1

[root@zabbix-server-center alertscripts]# sh nginx_status.sh accepts

20
6.在装有nginx服务的主机上修改zabbix_agentd.conf配置文件(/etc/zabbix/zabbix_agentd.conf)
修改:UnsafeUserParameters 等于 1 :UnsafeUserParameters=1
7.添加zabbix配置文件,放于 /etc/zabbix/zabbix_agentd.d/目录下(agent的配置文件 /etc/zabbix/zabbix_agentd.conf 中定义了其他key的包含目录)创建配置文件nginx_status.conf
添加:UserParameter=nginx[*], /etc/zabbix/zabbix_agentd.d/nginx_status.sh $1

                                                    #后面路径是监控脚本的位置

8.重启zabbix-agent服务
[root@ansible-control zabbix_agentd.d]# systemctl restart zabbix-agent.service
9.在zabbix server服务器上测试,是否能正常获取数据
[root@zabbix-server-center /]# zabbix_get -s 192.168.10.100 -p 10050 -k nginx.status[ping]

1

[root@zabbix-server-center /]# zabbix_get -s 192.168.10.100 -p 10050 -k nginx.status[requests]

2304

[root@zabbix-server-center /]# zabbix_get -s 192.168.10.100 -p 10050 -k nginx.status[accepts]

6285

[root@zabbix-server-center /]# zabbix_get -s 192.168.10.100 -p 10050 -k nginx.status[handled]

6286
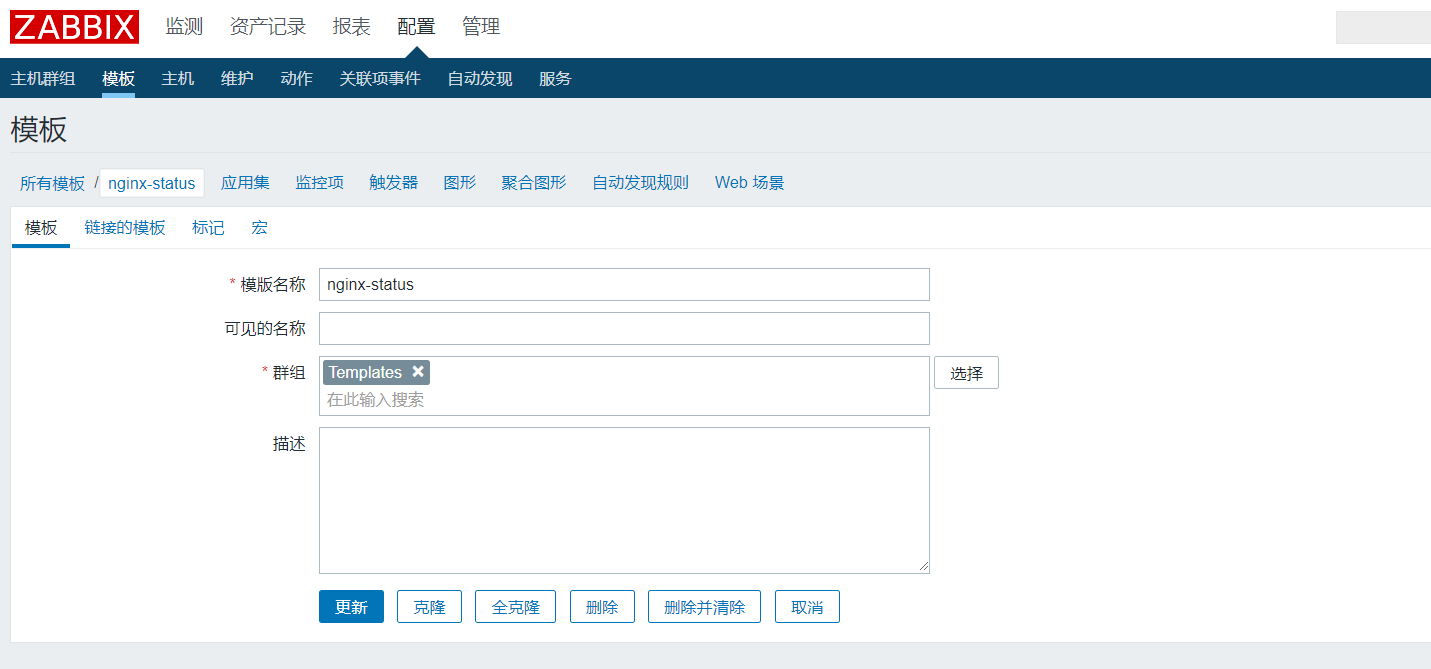
7.进入zabbix界面配置监控模板
(1)创建模板:
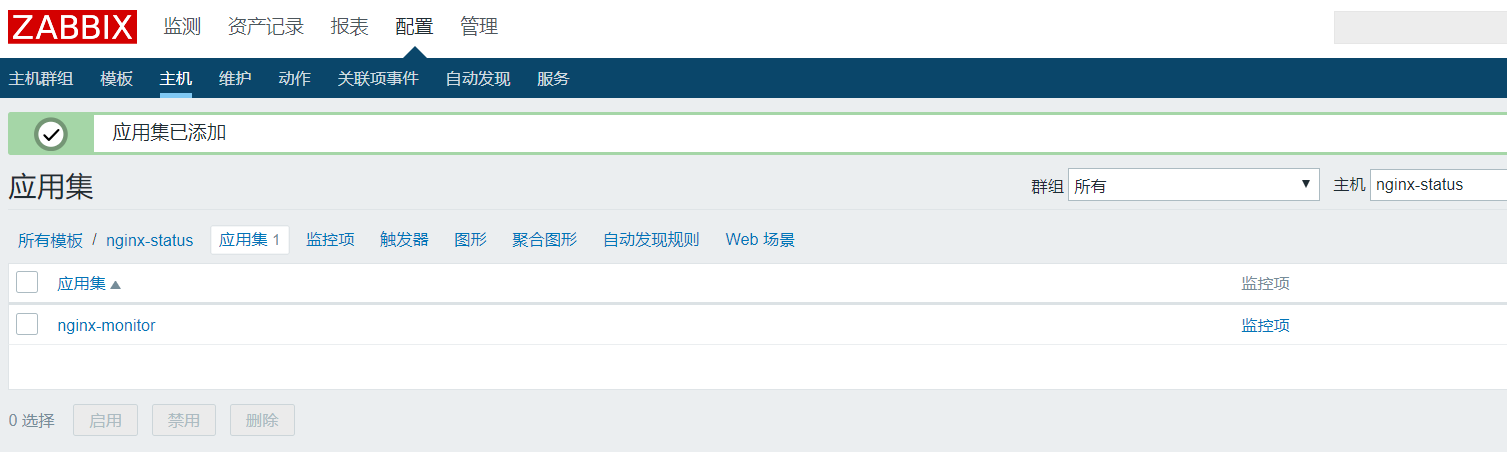
(2)添加应用集:
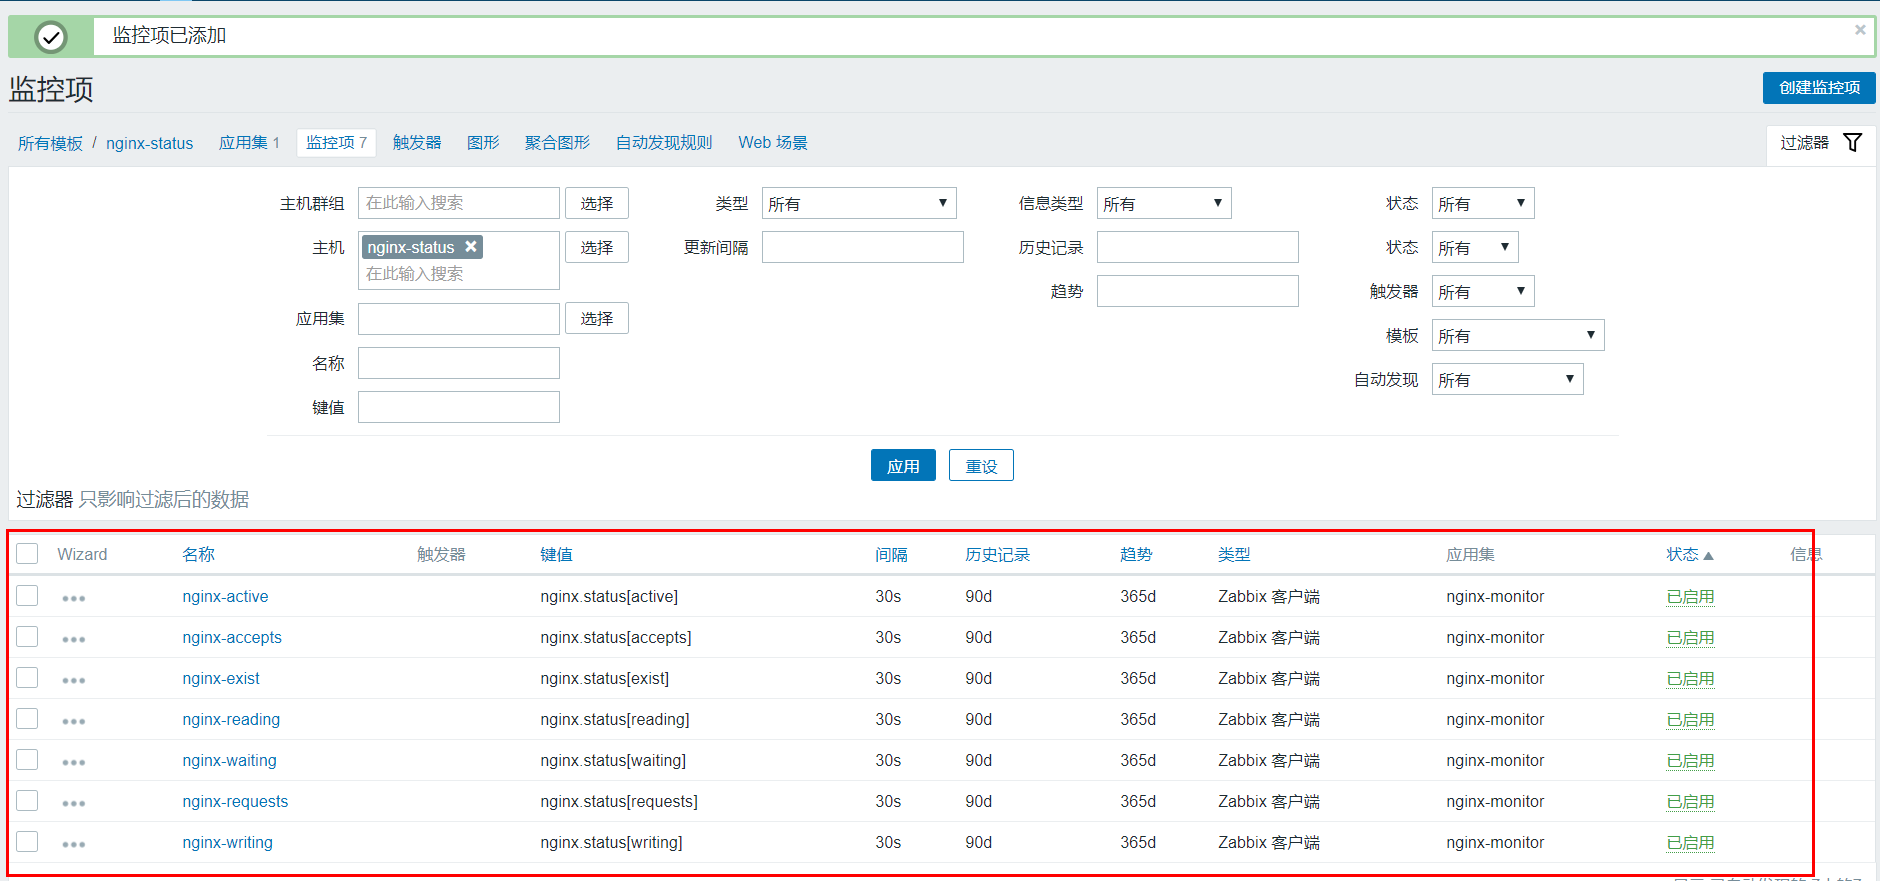
(3)创建监控项:

(4)创建多个监控项:
(5)创建触发器:触发器实时监控 Nginx 的存活状态,Nginx 一旦 Dump 机,就会发生报警。

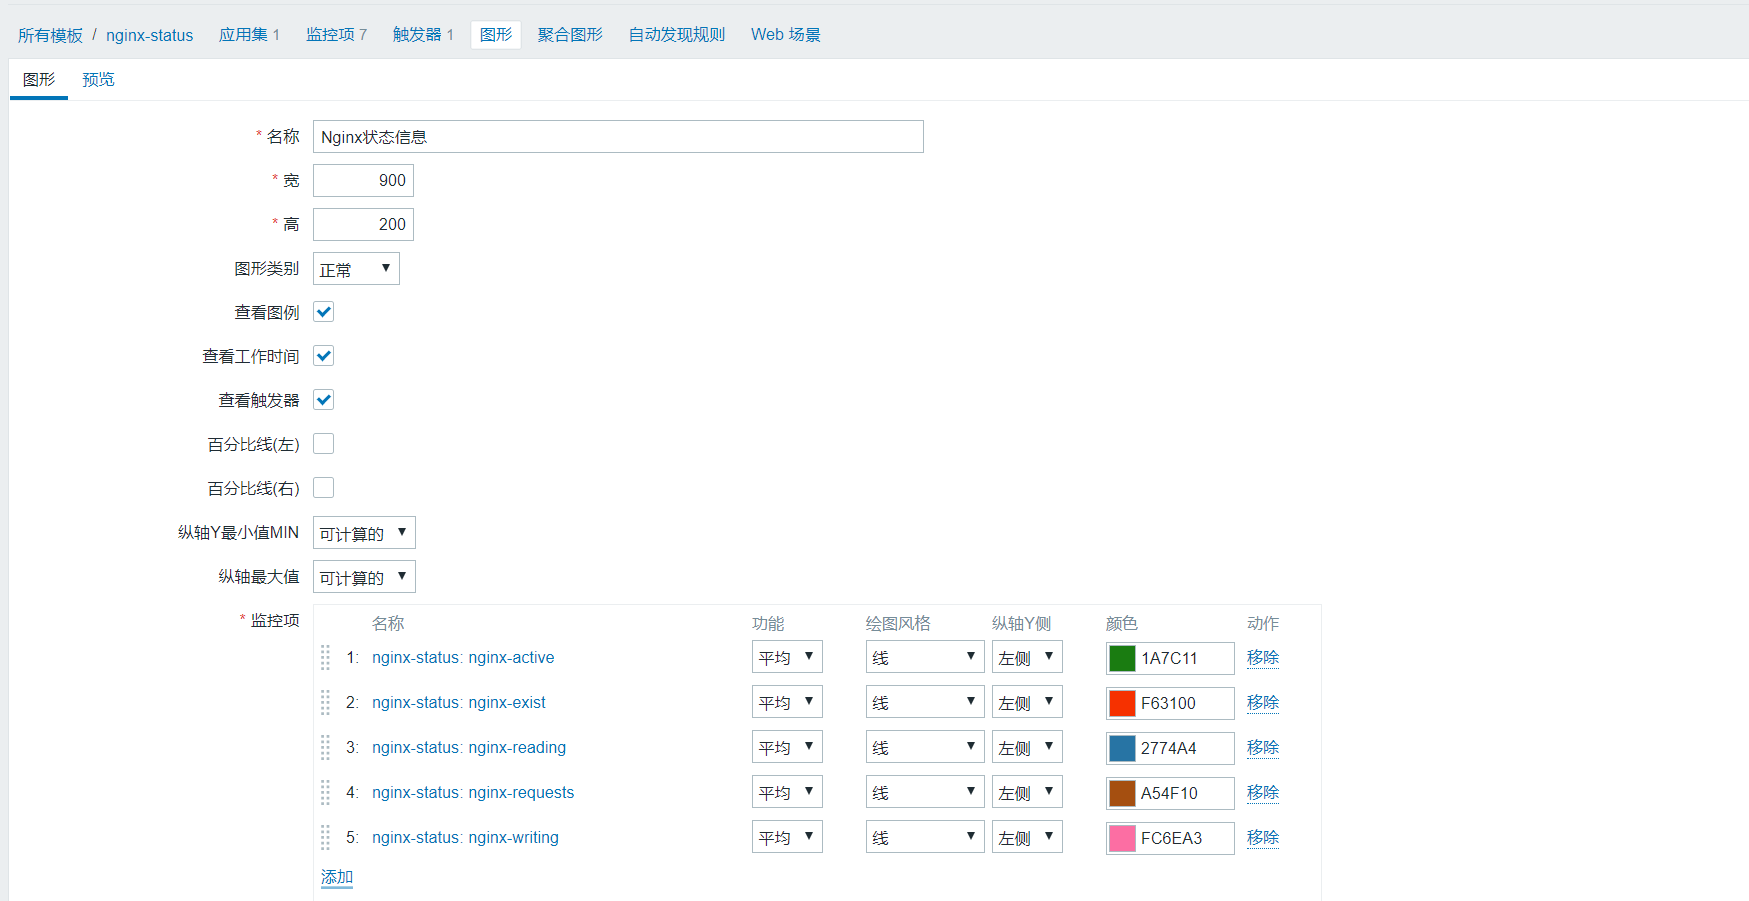
(6)创建图形:
8.将模板应用在装有Nginx服务的主机
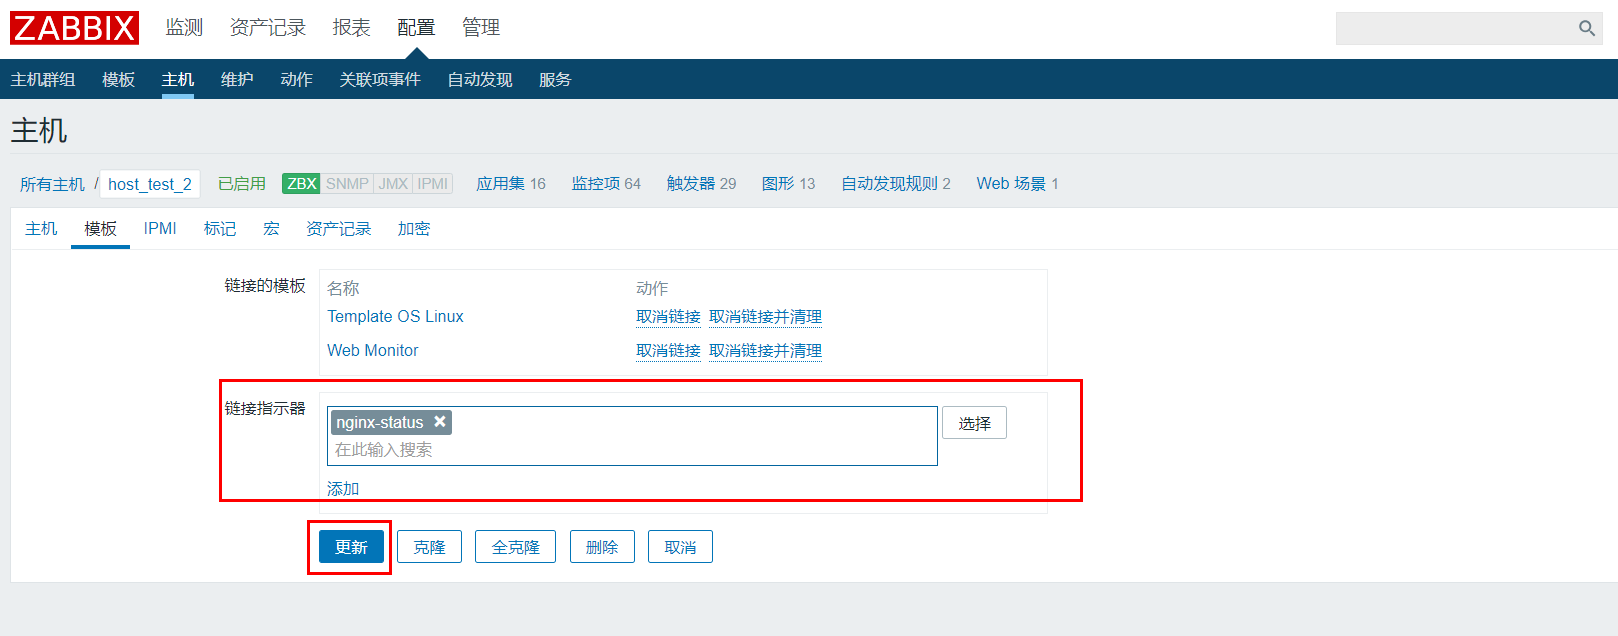
9.查看监控图形
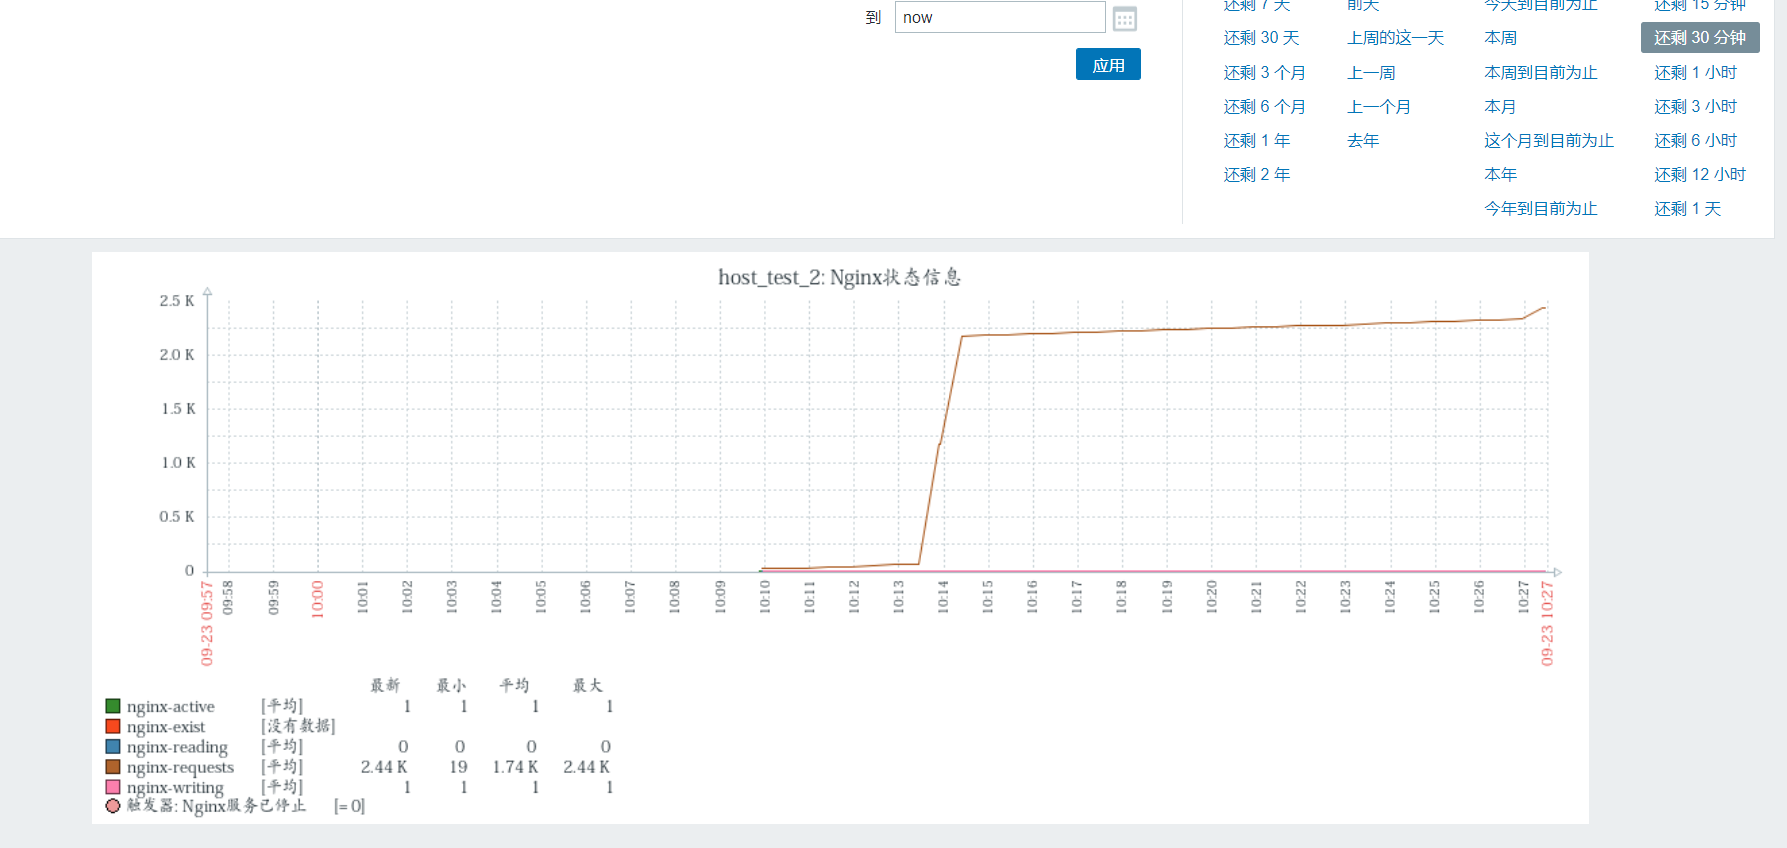
10.如果刚开始数值比较小,不利于查看图形,可以使用ab进行简单的压力测试(主要是requests),再查看数值变化
-n:在测试会话中所执行的请求个数。默认时,仅执行一个请求。
-c:一次产生的请求个数。默认是一次一个。
[root@zabbix-server-center /]# ab -n 1000 -c 1000 http://192.168.10.100:80/nginx_status
[root@zabbix-server-center /]# ab -n 1000 -c 1000 http://192.168.10.100:80/nginx_status

This is ApacheBench, Version 2.3 <$Revision: 1430300 $>

Copyright 1996 Adam Twiss, Zeus Technology Ltd, http://www.zeustech.net/

Licensed to The Apache Software Foundation, http://www.apache.org/

Benchmarking 192.168.10.100 (be patient)

Completed 100 requests

Completed 200 requests

Completed 300 requests

Completed 400 requests

Completed 500 requests

Completed 600 requests

Completed 700 requests

Completed 800 requests

Completed 900 requests

Completed 1000 requests

Finished 1000 requests

Server Software:        nginx/1.17.1

Server Hostname:        192.168.10.100

Server Port:            80

Document Path:          /nginx_status

Document Length:        106 bytes

Concurrency Level:      1000

Time taken for tests:   0.331 seconds

Complete requests:      1000

Failed requests:        819

   (Connect: 0, Receive: 0, Length: 819, Exceptions: 0)

Write errors:           0

Total transferred:      253092 bytes

HTML transferred:       109092 bytes

Requests per second:    3016.63 [#/sec] (mean)

Time per request:       331.496 [ms] (mean)

Time per request:       0.331 [ms] (mean, across all concurrent requests)

Transfer rate:          745.59 [Kbytes/sec] received

Connection Times (ms)

              min  mean[+/-sd] median   max

Connect:        3   31  15.1     26      69

Processing:    26   90  68.1     62     253

Waiting:        1   90  68.2     62     253

Total:         72  121  64.4     91     282

Percentage of the requests served within a certain time (ms)

  50%     91

  66%    103

  75%    109

  80%    113

  90%    239

  95%    280

  98%    282

  99%    282

 100%    282 (longest request)

值得参考的帖子:https://cloud.tencent.com/developer/article/1400917
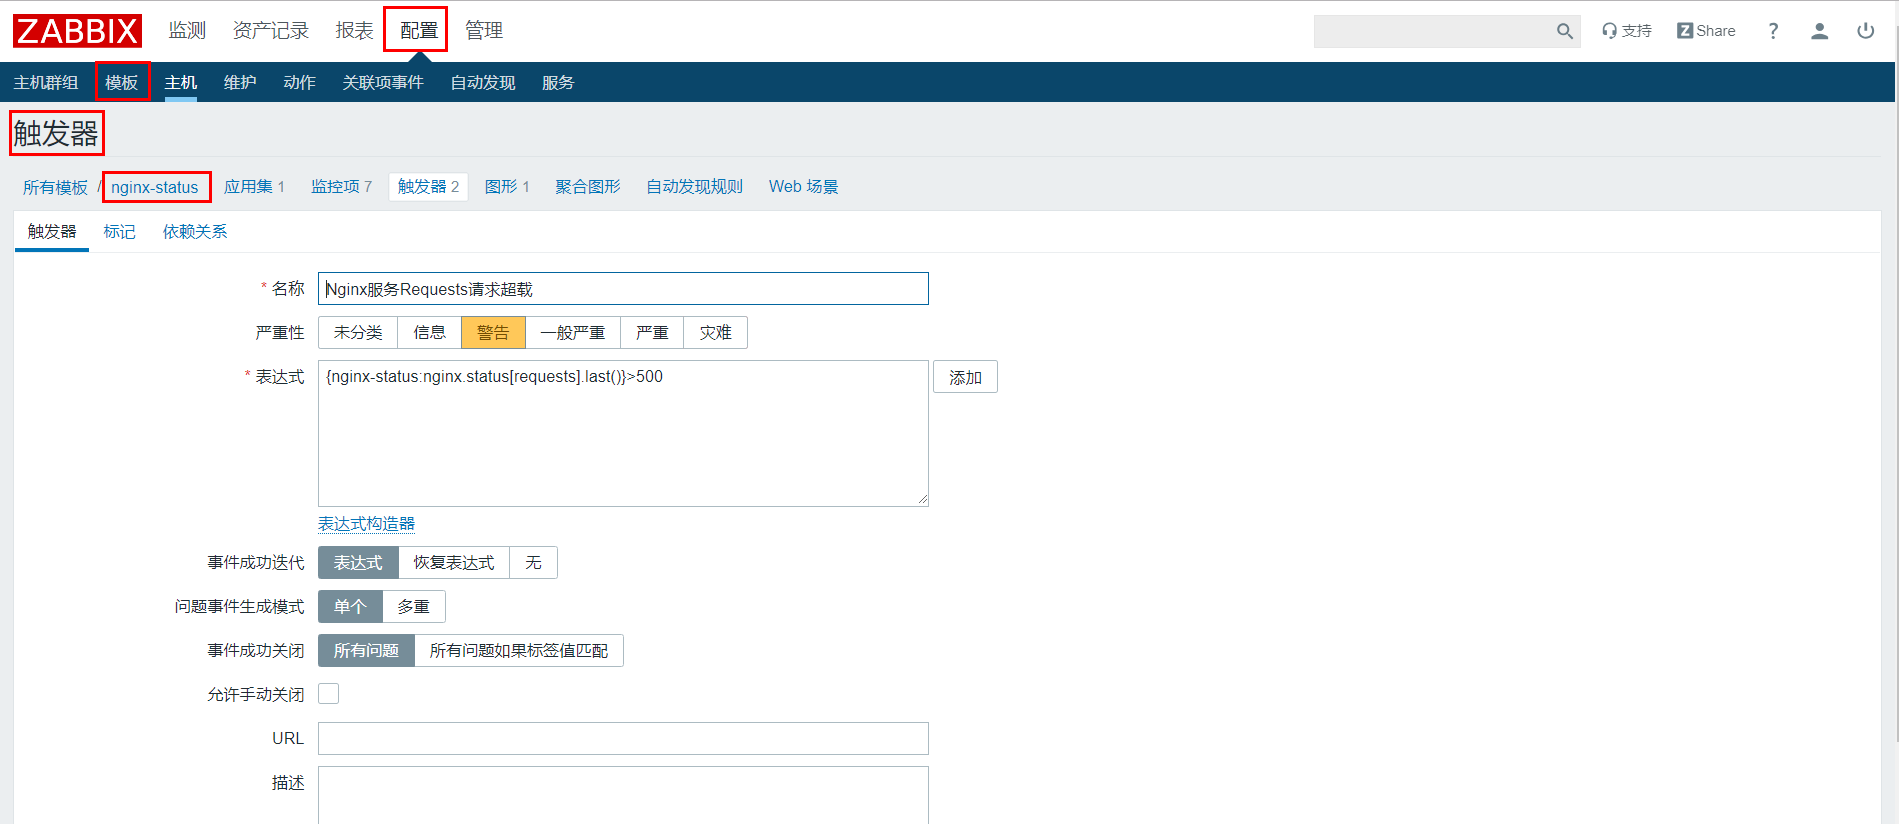
11.关于Nginx的一个告警测试
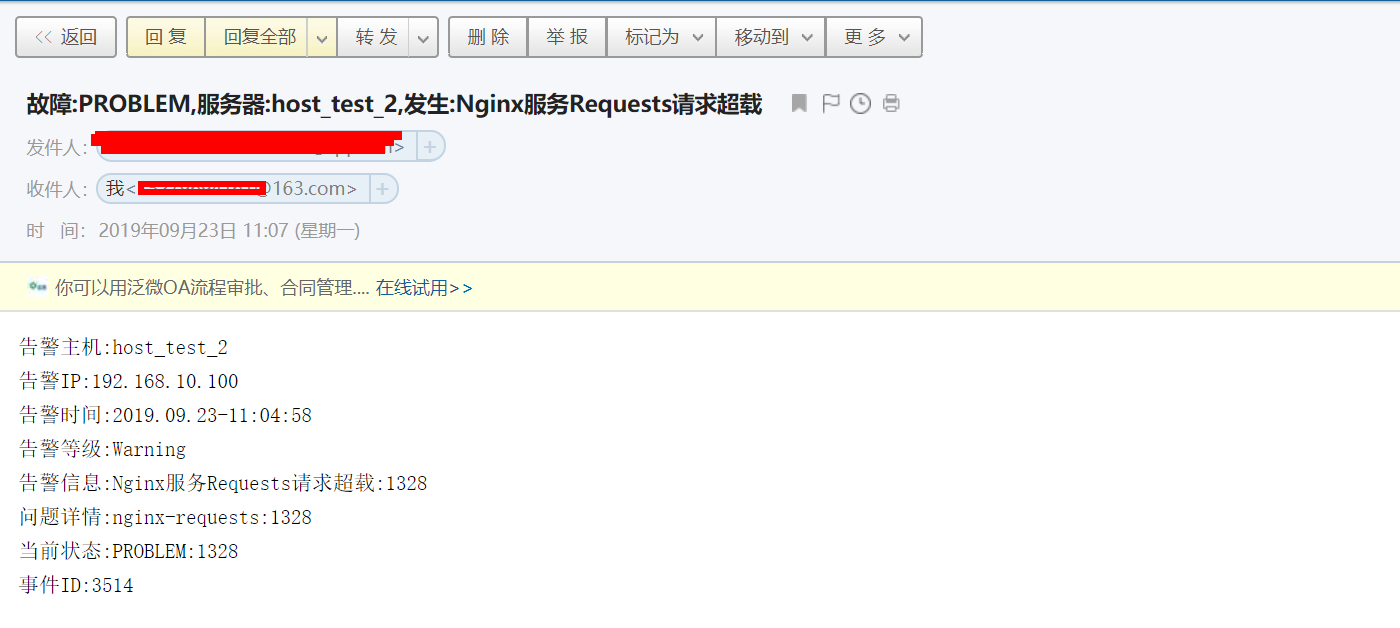
进入模板选择nginx-status模板,添加触发器,表示requests大于500就发送邮件报警。
在zabbix服务器上使用ab命令进行疯狂压力测试(发送requests请求),不一会requests请求就超过500,随后就会收到报警邮件。
[root@zabbix-server-center /]# ab -n 1000 -c 1000 http://192.168.10.100:80/nginx_status
zabbix4.2配置监控nginx服务的更多相关文章
- 【zabbix告警监控】配置zabbix监控nginx服务
zabbix监控nginx,nginx需要添加--with-http_stub_status模块 使用zabbix监控nginx,首先nginx需要配置开启ngx_status.但是我这边nginx安 ...
- 使用Zabbix监控Nginx服务实战案例
使用Zabbix监控Nginx服务实战案例 作者:尹正杰 版权声明:原创作品,谢绝转载!否则将追究法律责任. 一.编译安装nginx步骤详解并开启状态页 博主推荐阅读: https://www.cn ...
- Nagios监控nginx服务具体过程
1在nginx 服务器上安装nrpe客户端: Nginx的服务须要监控起来.不然万一down了而不及时修复,会影响web应用.例如以下web应用上面启动的nginx后台进程[root@lb-net-2 ...
- Python 监控nginx服务是否正常
Python 监控nginx服务是否正常 #!/usr/bin/env python import os, sys, time from time import strftime while True ...
- 监控nginx服务
转自:http://www.cnblogs.com/silent2012/p/5310500.html 在Nginx的插件模块中有一个模块stub_status可以监控Nginx的一些状态信息,默认安 ...
- ZABBIX 3.0 配置监控NGINX性能【OK】
1.在agent端查看配置: nginx -V //查看编辑时是否加入状态监控模块:--with-http_stub_status_module --with-http_gzip_static_mod ...
- zabbix监控nginx服务状态
nginx需要安装--with-http_stub_status_module模块 $ nginx -V nginx version: nginx/1.12.2 built by gcc 4.8.5 ...
- 监控Nginx服务的Shell脚本
Nginx 虽然处理并发量比 apache 确实要强点,但它这种 php-cgi 模式不是太稳定,这点网上也有朋友总结了,我在实现项目中也感受到了. 我们一台支付机,偶尔会出现以下情况的:php-cg ...
- cacti系列(一)之cacti的安装及配置监控mysql服务
简介 Cacti是通过 snmpget来获取数据,使用 RRDtool绘画图形,而且你完全可以不需要了解RRDtool复杂的参数.它提供了非常强大的数据和用户管理功能,可以指定每一个用户能查看树状结构 ...
随机推荐
- 本地服务器热更新 插件 live-server
本地服务器热更新 插件 live-server 超级好用 强烈种草一波 无需安装到项目中 使用方法如下: 1.先全局安装live-server: npm i http-server -g 2.在需要热 ...
- 关于将sublime中的代码高亮导出到博客中
第一步:打开sublime编辑器,用快捷键ctrl+shift+p调出control panel,在出现的输入框中输入install,按回车键 第二步:然后输入插件名称sublimehighlight ...
- phpcms抛出的二维数组转移到js,js中for....in遍历数组,用“.”连接来读出一维数组值
直切正题: 1.phpcms在模版中读出数组有很多中方法,如,{pc:content action="lists"}或{pc:get sql=""},经过{lo ...
- Spring学习笔记-高级装配-03
主要内容: ●Spring profile ●条件化的bean声明 ●自动装配与歧义性 ● Spring表达式语言 本章介绍一些高级的装配技术,可实现更为高级的装配功能. 环境与profile 软件开 ...
- 递归查询 start with connect by prior
1.语法:start with 子节点ID='...' connect by prior 子节点ID = 父节点ID 含义:查询结果我所有的后代节点(包括我) 例子: select id,parent ...
- docker 安装 jenkins touch: cannot touch ‘/var/jenkins_home/copy_reference_file.log’: Permission denied Can not write to /var/jenkins_home/copy_reference_file.log. Wrong volume permissions?
拉取镜像 docker pull jenkins/jenkins:lts 官方下载 运行容器 docker run -it -v /home/jenkins:/var/jenkins_home -p ...
- .Net Core的总结
一.什么是.NET Core .NET Core是一个开源通用的开发框架,支持跨平台,即支持在Window,macOS,Linux等系统上的开发和部署,并且可以在硬件设备,云服务,和嵌入式/物联网方案 ...
- poj1042题解
h [1,16] hours all_v=h*12 intervals n [2,25] lakes fi inital intervals fi-di*v v [0,all_v) 题意,做每件事情的 ...
- MySql快速入门(四)
在之前我们对MySql已经有了基本的了解,接下来我们就来接触MySql的分库分表,请往下阅读: 分库分表之MyCat实现 分库分表介绍: 随着微服务这种架构的兴起,我们应用从一个完整的大的应用,切分为 ...
- CSS-使用CSS样式的方式
1.HTML<!DOCTYPE>声明标签 (1)定义和用法 <!DOCTYPE>声明必须是HTML文档的第一行,位于<html>标签之前. <!DOCTYPE ...