超好用的自带火焰图的 Java 性能分析工具 Async-profiler 了解一下
如果你经常遇到 Java 线上性能问题束手无策,看着线上服务 CPU 飙升一筹莫展,发现内存不断泄露满脸茫然。别慌,这里有一款低开销、自带火焰图、让你大呼好用的 Java 性能分析工具 - async-profiler。
最近 Arthas 性能分析工具上线了火焰图分析功能,Arthas 使用 async-profiler 生成 CPU/内存火焰图进行性能分析,弥补了之前内存分析的不足。在 Arthas 上使用还是比较方便的,使用方式可以看官方文档。这篇文章介绍 async-profiler 相关内容。
Arthas 火焰图官方文档:https://alibaba.github.io/arthas/profiler.html
如果你想了解更多 Arthas 信息,可以参考之前文章:Arthas - Java 线上问题定位处理的终极利器
async-profiler 介绍
async-profiler 是一款开源的 Java 性能分析工具,原理是基于 HotSpot 的 API,以微乎其微的性能开销收集程序运行中的堆栈信息、内存分配等信息进行分析。
使用 async-profiler 可以做下面几个方面的分析。
- CPU cycles
- Hardware and Software performance counters like cache misses, branch misses, page faults, context switches etc.
- Allocations in Java Heap
- Contented lock attempts, including both Java object monitors and ReentrantLocks
我们常用的是 CPU 性能分析和 Heap 内存分配分析。在进行 CPU 性能分析时,仅需要非常低的性能开销就可以进行分析,这也是这个工具的优点之一。
在进行 Heap 分配分析时,async-profiler 工具会收集内存分配信息,而不是去检测占用 CPU 的代码。async-profiler 不使用侵入性的技术,例如字节码检测工具或者探针检测等,这也说明 async-profiler 的内存分配分析像 CPU 性能分析一样,不会产生太大的性能开销,同时也不用写出庞大的堆栈文件再去进行进一步处理,。
async-profile 目前支持 Linux 和 macOS 平台(macOS 下只能分析用户空间的代码)。
- Linux / x64 / x86 / ARM / AArch64
- macOS / x64
async-profiler 工具在采样后可以生成采样结果的日志报告,也可以生成 SVG 格式的火焰图,在之前生成火焰图要使用 FlameGraph 工具。现在已经不需要了,从 1.2 版本开始,就已经内置了开箱即用的 SVG 文件生成功能。
其他信息可以看官方文档:https://github.com/jvm-profiling-tools/async-profiler
async-profiler 安装
下载 async-profiler 工具可以在官方的 Github 上直接下载编译好的文件,如果你就是想体验手动挡的感觉,也可以克隆项目,手动编译一下,不得不说这个工具十分的易用,我在手动编译的过程十分顺滑,没有出现任何问题。
如果你想下载编译好的,可以到这里下载。
https://github.com/jvm-profiling-tools/async-profiler/releases
如果想体验手动挡的感觉,可以克隆整个项目,进项项目编译。
手动编译的环境要求。
- JDK
- GCC
下面是手动安装的操作命令。
git clone https://github.com/jvm-profiling-tools/async-profiler

cd async-profiler

make
执行 make 命令编译后会在项目的目录下生成一个 build 文件夹,里面存放着编译的结果。下面是我手动编译的过程输出。
➜  develop git clone https://github.com/jvm-profiling-tools/async-profiler

Cloning into 'async-profiler'...

remote: Enumerating objects: 69, done.

remote: Counting objects: 100% (69/69), done.

remote: Compressing objects: 100% (54/54), done.

remote: Total 1805 (delta 34), reused 32 (delta 15), pack-reused 1736

Receiving objects: 100% (1805/1805), 590.78 KiB | 23.00 KiB/s, done.

Resolving deltas: 100% (1288/1288), done.

➜  develop cd async-profiler

➜  async-profiler git:(master) make

mkdir -p build

g++ -O2 -D_XOPEN_SOURCE -D_DARWIN_C_SOURCE -DPROFILER_VERSION=\"1.6\" -I/Library/Java/JavaVirtualMachines/jdk1.8.0_181.jdk/Contents/Home/include -I/Library/Java/JavaVirtualMachines/jdk1.8.0_181.jdk/Contents/Home/include/darwin -fPIC -shared -o build/libasyncProfiler.so src/*.cpp -ldl -lpthread

gcc -O2 -DJATTACH_VERSION=\"1.5\" -o build/jattach src/jattach/jattach.c

mkdir -p build/classes

/Library/Java/JavaVirtualMachines/jdk1.8.0_181.jdk/Contents/Home/bin/javac -source 6 -target 6 -d build/classes src/java/one/profiler/AsyncProfiler.java src/java/one/profiler/AsyncProfilerMXBean.java src/java/one/profiler/Counter.java src/java/one/profiler/Events.java

警告: [options] 未与 -source 1.6 一起设置引导类路径

1 个警告

/Library/Java/JavaVirtualMachines/jdk1.8.0_181.jdk/Contents/Home/bin/jar cvf build/async-profiler.jar -C build/classes .

已添加清单

正在添加: one/(输入 = 0) (输出 = 0)(存储了 0%)

正在添加: one/profiler/(输入 = 0) (输出 = 0)(存储了 0%)

正在添加: one/profiler/AsyncProfiler.class(输入 = 1885) (输出 = 908)(压缩了 51%)

正在添加: one/profiler/Events.class(输入 = 405) (输出 = 286)(压缩了 29%)

正在添加: one/profiler/Counter.class(输入 = 845) (输出 = 473)(压缩了 44%)

正在添加: one/profiler/AsyncProfilerMXBean.class(输入 = 631) (输出 = 344)(压缩了 45%)

rm -rf build/classes

➜  async-profiler git:(master)
async-profiler 使用
运行项目里的 profiler.sh 可以看到 async-profiler 的使用帮助文档。
➜  async-profiler git:(master) ./profiler.sh

Usage: ./profiler.sh [action] [options] <pid>

Actions:

  start             start profiling and return immediately

  resume            resume profiling without resetting collected data

  stop              stop profiling

  status            print profiling status

  list              list profiling events supported by the target JVM

  collect           collect profile for the specified period of time

                    and then stop (default action)

Options:

  -e event          profiling event: cpu|alloc|lock|cache-misses etc.

  -d duration       run profiling for <duration> seconds

  -f filename       dump output to <filename>

  -i interval       sampling interval in nanoseconds

  -j jstackdepth    maximum Java stack depth

  -b bufsize        frame buffer size

  -t                profile different threads separately

  -s                simple class names instead of FQN

  -g                print method signatures

  -a                annotate Java method names

  -o fmt            output format: summary|traces|flat|collapsed|svg|tree|jfr

  -v, --version     display version string

  --title string    SVG title

  --width px        SVG width

  --height px       SVG frame height

  --minwidth px     skip frames smaller than px

  --reverse         generate stack-reversed FlameGraph / Call tree

  --all-kernel      only include kernel-mode events

  --all-user        only include user-mode events

  --sync-walk       use synchronous JVMTI stack walker (dangerous!)

<pid> is a numeric process ID of the target JVM

      or 'jps' keyword to find running JVM automatically

Example: ./profiler.sh -d 30 -f profile.svg 3456

         ./profiler.sh start -i 999000 jps

         ./profiler.sh stop -o summary,flat jps
可以看到使用的方式是:Usage: ./profiler.sh [action] [options] ,也就是 命令+操作+参数+PID。
常用的使用的几个步骤:
- 查看 java 进程的 PID(可以使用 jps )。
- 使用 ./profiler.sh start 开始采样。
- 使用 ./profiler.sh status 查看已经采样的时间。
- 使用 ./profiler.sh stop 停止采样,输出结果。
这种方式使用起来多费劲啊,而且最后输出的是文本结果,看起来更是费劲,为了不那么费劲,可以使用帮助里给的采样后生成 SVG 文件例子。
./profiler.sh -d 30 -f profile.svg 3456
这个命令的意思是,对 PID 为 3456 的 java 进程采样 30 秒,然后生成 profile.svg 结果文件。
默认情况下是分析 CPU 性能,如果要进行其他分析,可以使用 -e 参数。
-e event profiling event: cpu|alloc|lock|cache-misses etc.
可以看到支持的分析事件有 CPU、Alloc、Lock、Cache-misses 。
async-profiler 案例
上面说完了 async-profiler 工具的作用和使用方式,既然能进行 CPU 性能分析和 Heap 内存分配分析,那么我们就写几个不一般的方法分析试试看。看看是不是有像上面介绍的那么好用。
Java 案例编码
很简单的几个方法,hotmethod 方法写了几个常见操作,三个方法中很明显 hotmethod3 方法里的生成 UUID 和 replace(需要正则匹配)操作消耗的 CPU 性能会较多。allocate 方法里因为要不断的创建长度为 6万的数组,消耗的内存空间一定是最多的。
import java.util.ArrayList;

import java.util.Random;

import java.util.UUID;

/**

 * <p>

 * 模拟热点代码

 *

 * @Author niujinpeng

 */

public class HotCode {

    private static volatile int value;

    private static Object array;

    public static void main(String[] args) {

        while (true) {

            hotmethod1();

            hotmethod2();

            hotmethod3();

            allocate();

        }

    }

    /**

     * 生成 6万长度的数组

     */

    private static void allocate() {

        array = new int[6 * 1000];

        array = new Integer[6 * 1000];

    }

    /**

     * 生成一个UUID

     */

    private static void hotmethod3() {

        ArrayList<String> list = new ArrayList<>();

        UUID uuid = UUID.randomUUID();

        String str = uuid.toString().replace("-", "");

        list.add(str);

    }

    /**

     * 数字累加

     */

    private static void hotmethod2() {

        value++;

    }

    /**

     * 生成一个随机数

     */

    private static void hotmethod1() {

        Random random = new Random();

        int anInt = random.nextInt();

    }

}
CPU 性能分析
运行上面的程序,然后使用 JPS 命令查看 PID 信息。
➜  develop jps

2800 Jps

2449 HotCode

2450 Launcher

805 RemoteMavenServer36

470 NutstoreGUI

699

➜  develop
上面运行的类名是 HotCode,可以看到对应的 PID 是 2449。
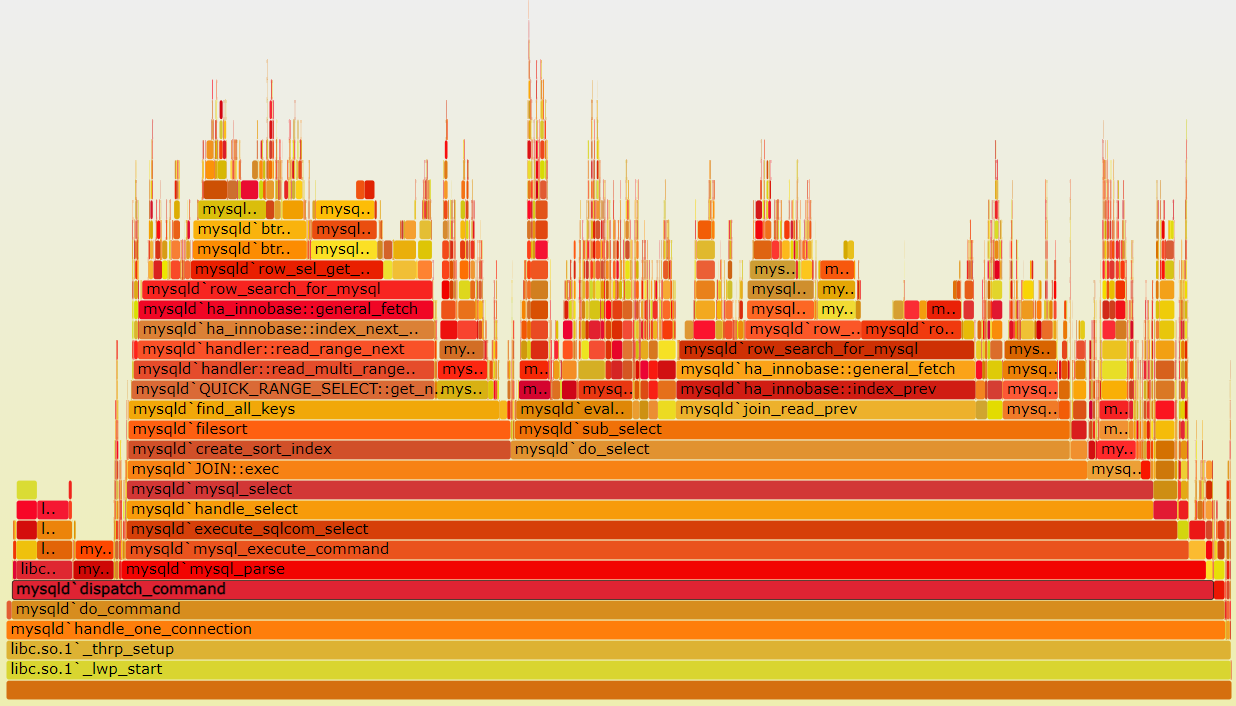
使用 ./profiler.sh -d 20 -f 2449.svg 2449 命令对 2449 号进程采样20秒,然后得到生成的 2449.svg 文件,然后我们使用浏览器打开这个文件,可以看到 CPU 的使用火焰图。
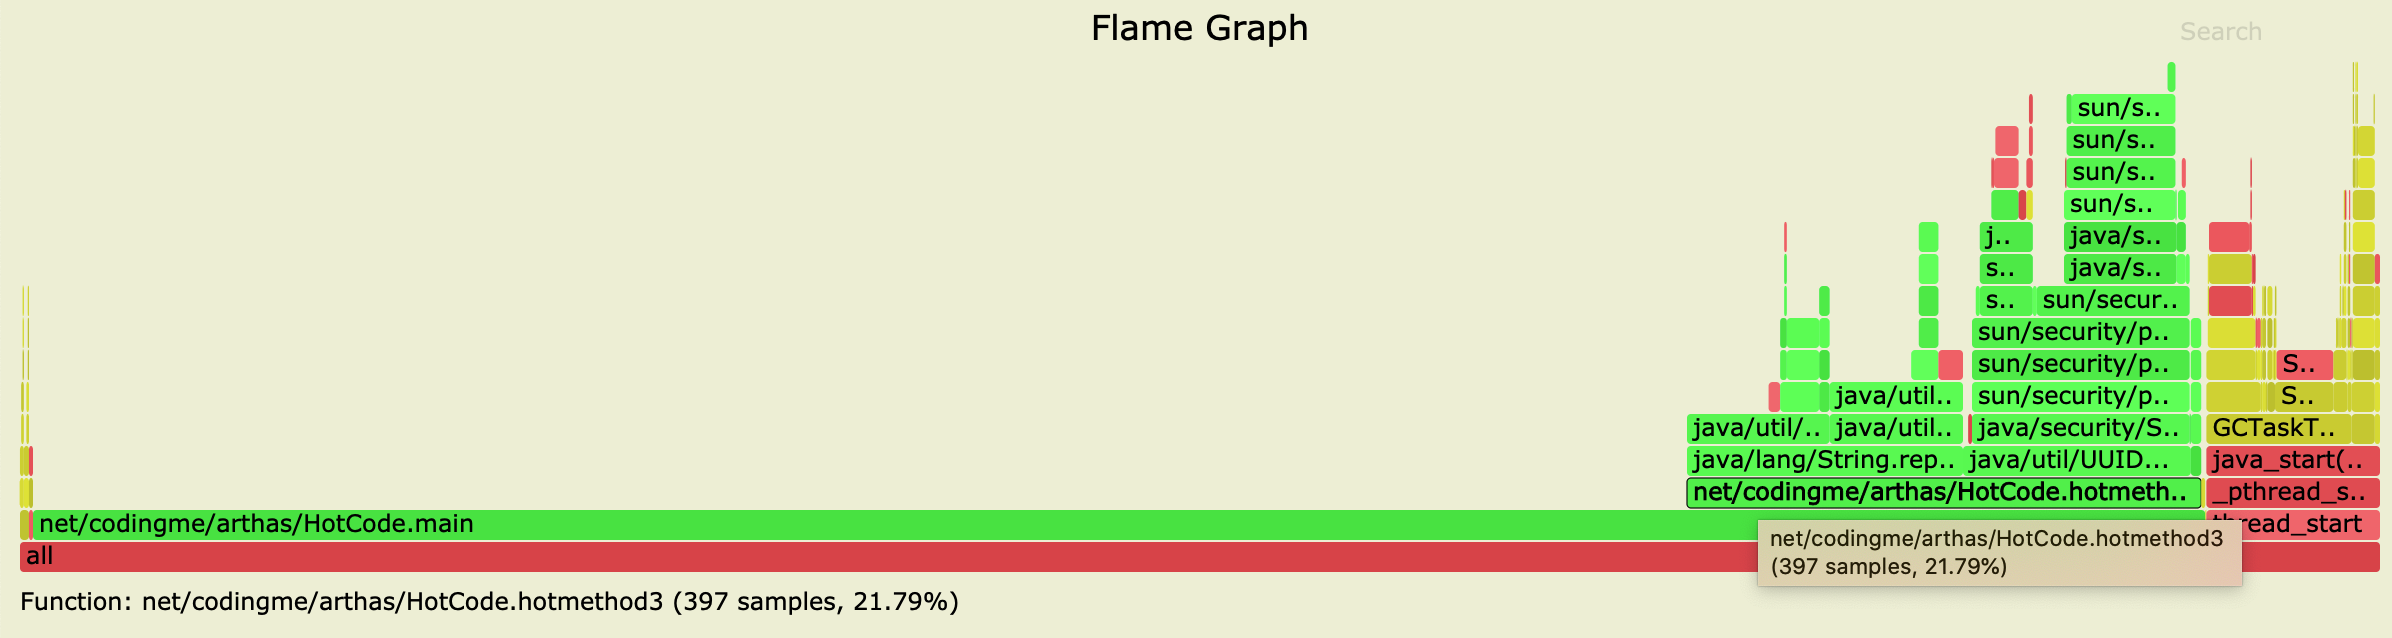
关于火焰图怎么看,一言以蔽之:火焰图里,横条越长,代表使用的越多,从下到上是调用堆栈信息。在这个图里可以看到 main 方法上面的调用中 hotmethod3 方法的 CPU 使用是最多的,点击这个方法。还可能看到更详细的信息。

可以看到 replace 方法占用的 CPU 最多,也是程序中性能问题所在,是需要注意的地方。
Heap 内存分析
还是上面运行的程序,进程 PID 还是 2449,这次使用 -e 参数分析内存使用情况。
命令:./profiler.sh -d 20 -e alloc -f 2449-alloc.svg 2449
命令的意思是收集进程号是 2449 的进程的内存信息 20 秒,然后输出为 2449-alloc.svg 文件。20秒后得到 svg 文件使用浏览器打开,可以看到内存分配情况。
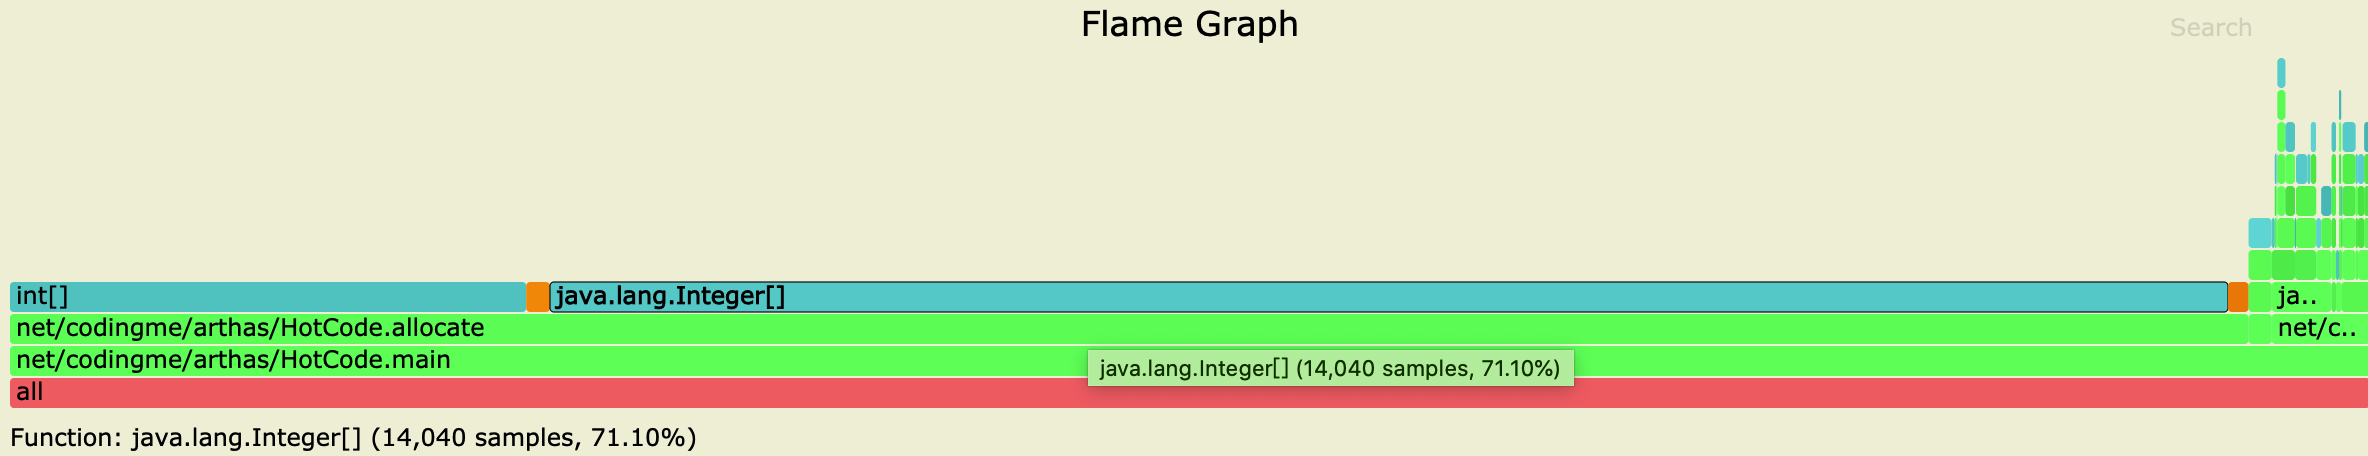
依旧是横条越长,代表使用的越多,从下到上是调用堆栈信息。从图里可以看出来 main 方法调用的 allocate 方法使用的内存最多,这个方法里的 Integer 类型数组占用的内存又最多,为 71%。
文中测试代码已经上传到 Github:https://github.com/niumoo/lab-notes
<完>
个人网站:https://www.codingme.net
如果你喜欢这篇文章,可以关注公众号,一起成长。
关注公众号回复资源可以没有套路的获取全网最火的的 Java 核心知识整理&面试核心资料。

超好用的自带火焰图的 Java 性能分析工具 Async-profiler 了解一下的更多相关文章
- java面试-JDK自带的JVM 监控和性能分析工具用过哪些?
一.JDK的命令行工具 1.jps(JVM Process Status Tools):虚拟机进程状况工具 jps -l 2.jinfo(Configuration Info for java):Ja ...
- 如何利用火焰图定位 Java 的 CPU 性能问题
常见 CPU 性能问题 你所负责的服务(下称:服务)是否遇到过以下现象: 休息的时候,手机突然收到大量告警短信,提示服务的 99.9 line 从 20ms 飙升至 10s: 正在敲代码实现业务功能 ...
- (转)超全整理!Linux性能分析工具汇总合集
超全整理!Linux性能分析工具汇总合集 原文:http://rdc.hundsun.com/portal/article/731.html 出于对Linux操作系统的兴趣,以及对底层知识的强烈欲望, ...
- Linux性能分析工具与图形化方法
欢迎大家前往腾讯云+社区,获取更多腾讯海量技术实践干货哦~. 作者:赵坤|腾讯魔王工作室后台开发工程师 在项目开发中,经常会遇到程序启动时间过长.CPU使用率过高等问题,这个时候需要依靠性能分析工具来 ...
- 超全整理!Linux性能分析工具汇总合集
转自:http://rdc.hundsun.com/portal/article/731.html?ref=myread 出于对Linux操作系统的兴趣,以及对底层知识的强烈欲望,因此整理了这篇文章. ...
- VS2010自带的性能分析工具分析.NET程序的性能
这篇博文给大家分享的是,如何使用VS自带的性能分析工具来分析我们编写的.NET程序,一边找出程序性能的瓶颈,改善代码的质量.在实际开发中,性能真的很重要,往往决定一个产品的生死~良好的用户体验的基础之 ...
- linux性能分析工具之火焰图
一.环境 1.1 jello@jello:~$ uname -a Linux jello 4.4.0-98-generic #121-Ubuntu SMP Tue Oct 10 14:24:03 UT ...
- java性能分析之火焰图
原由 最近因为kafka.zookeeper.ES和相关的Java应用的内存问题搞的头大,做运维将近4年,对Java调优.性能方面的知识了解的少之又少,是时候下定决心来对他多一个学习了.不能一口吃成一 ...
- perf学习-linux自带性能分析工具
目前在做性能分析的事情,之前没怎么接触perf,找了几篇文章梳理了一下,按照问题的形式记录在这里. 方便自己查看. 什么是perf? linux性能调优工具,32内核以上自带的工具,软件性能分析. ...
随机推荐
- 大数据之路week01--自学之集合_2(列表迭代器 ListIterator)
列表迭代器: ListIterator listerator():List集合特有的迭代器 该迭代器继承了Iterator迭代器,所以,就可以直接使用hasNext()和next()方法 特有功能: ...
- Java自学基础、进阶、项目实战网站推荐
推荐一个自学的好平台,有Java基础,前端,后端,基础的内容都有讲解,还有框架的讲解和实战项目,特别适合自学 JAVA 自学网站 JAVA 练习题 Spring 教程 Mybatis 教程 Sprin ...
- 数据结构之队列and栈总结分析
一.前言: 数据结构中队列和栈也是常见的两个数据结构,队列和栈在实际使用场景上也是相辅相成的,下面简单总结一下,如有不对之处,多多指点交流,谢谢. 二.队列简介 队列顾名思义就是排队的意思,根据我们的 ...
- ATM功能实现项目
一.模拟实现一个ATM + 购物商城程序 1.额度 15000或自定义2.实现购物商城,买东西加入 购物车,调用信用卡接口结账3.可以提现,手续费5%4.支持多账户登录5.支持账户间转账6.记录每月日 ...
- Java基础知识之常量变量(一)
1.什么是变量,什么是常量?java的基本数据类型是什么 变量: 会发生改变的数据,叫做变量,如自定义一个a,并且对a进行赋值操作为1,也可以让a等于2,此时a就是一个变量 常量: 不会发生改变的值, ...
- 使用Bootstrap制作简单的旅游主页
页面效果 代码: 需要导入bootstrapt文件,解压至项目中. 下载地址:https://v3.bootcss.com/getting-started/#download <!DOCTYPE ...
- [springboot 开发单体web shop] 6. 商品分类和轮播广告展示
商品分类&轮播广告 因最近又被困在了OSGI技术POC,更新进度有点慢,希望大家不要怪罪哦. 上节 我们实现了登录之后前端的展示,如: 接着,我们来实现左侧分类栏目的功能. ## 商品分类|P ...
- ReactJS的4行代码
Angular 2一个显著的变动是,把Angular 1的Promise pattern改成了Observer pattern,并且使用了ReactJS.这里有一篇值得一读的文章 要搞懂ReactJS ...
- mybatis什么时候必须指定jdbcType
#{property,javaType=int,jdbcType=NUMERIC}如果一个列允许 null 值,并且会传递值 null 的参数,就必须要指定 JDBC Type
- beyong Compare4解决30天的评估期结束
刚开始是删掉注册表的CacheId(无效) 1.在搜索栏中输入 regedit ,打开注册表2.删除项目CacheId :HKEY_CURRENT_USER\Software\Scooter Soft ...