excel2007VBA绘图2
 '--------------------------------------------------------Module1--------------------------------------------------------

 Sub Macro1()

     ActiveSheet.Range("B1:B40").Select

     ActiveSheet.Shapes.AddChart.Select

     ActiveChart.ChartType = xlXYScatter

     ActiveChart.SetSourceData Source:=Range("'Sheet1'!$A$1:$B$40")

     With ActiveChart

         .HasTitle = True                                    '为图表设置标题

         With .ChartTitle

             .Text = "交会图版"

             .Font.Name = "宋体"

             .Font.Size =

             .Font.ColorIndex =

             .Top =

             .Left =

         End With

         With .Axes(xlCategory)                             '为图表设置横坐标

             .HasTitle = True

             .AxisTitle.Text = "统计含量"

             .AxisTitle.Font.Name = "宋体"

             .AxisTitle.Font.Size =

             .AxisTitle.Font.Bold = False

             .AxisTitle.Font.ColorIndex =

             .MinimumScale = Cells(, ) - Cells(, ) * 0.2

             .MaximumScale = Cells(, ) + Cells(, ) * 0.2

         End With

         With .Axes(xlValue)                               '为图表设置纵坐标

             .HasTitle = True

             .AxisTitle.Text = "百分数"

             .AxisTitle.Font.Name = "宋体"

             .AxisTitle.Font.Size =

             .AxisTitle.Font.Bold = False

             .AxisTitle.Font.ColorIndex =

             ' i = Excel.Application.WorksheetFunction.Match("203", f, 0)

             .MinimumScale = Excel.Application.WorksheetFunction.Min(Range("B:B")) '**zbl**范围要加一个Range才不会出错,下面的不行

             .MaximumScale = Excel.Application.WorksheetFunction.Max(Range("B:B"))

 '            .MinimumScale = Excel.Application.WorksheetFunction.Min("B:B")

 '            .MaximumScale = Excel.Application.WorksheetFunction.Max("B:B")

 '            .MinimumScale = Application.WorksheetFunction.Min("b1:b40")

 '            .MaximumScale = Application.WorksheetFunction.Max("b4:b40")

 'Sub UseFunction()

 '    Dim myRange As Range

 '    Set myRange = Worksheets("Sheet1").Range("A1:C10")

 '    answer = Application.WorksheetFunction.Max搜索(myRange)

 '    MsgBox answer

 'End Sub

         End With

         .HasLegend = True                                      '为图表设置图例

         With .Legend

             .Position = xlLegendPositionRight

             .Font.ColorIndex =

             .Font.Bold = True

         End With

     End With

 End Sub
多个系列:

参考:http://club.excelhome.net/thread-1199400-1-1.html
'--------------------------------------------------------Module1--------------------------------------------------------
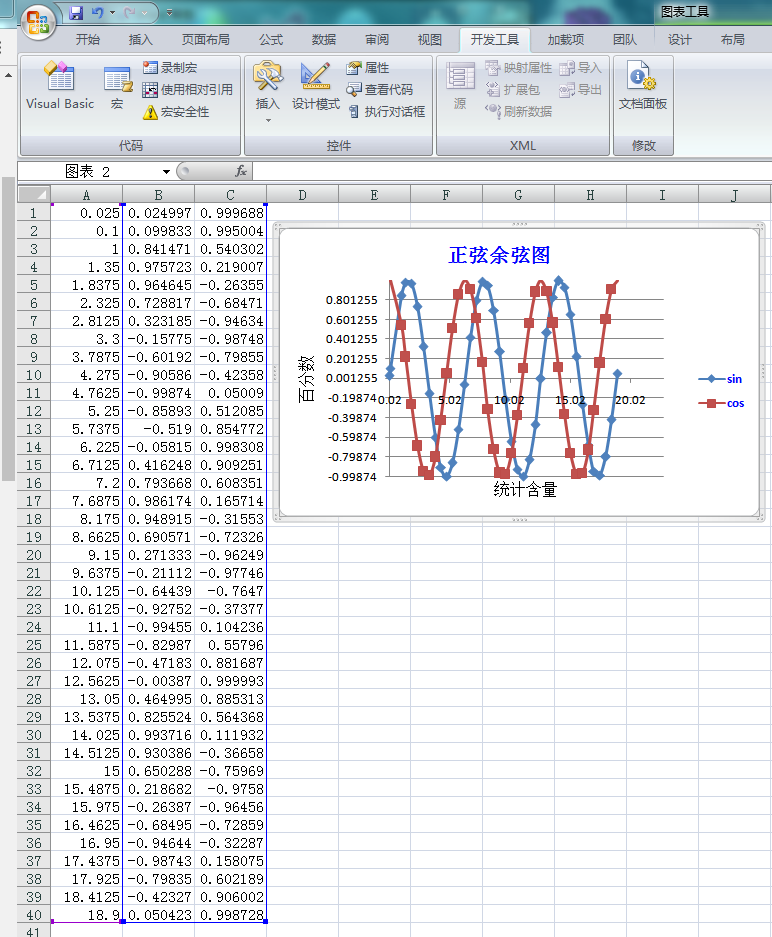
Sub Macro1()
ActiveSheet.Range("B1:C40").Select
ActiveSheet.Shapes.AddChart.Select
ActiveChart.ChartType = xlXYScatterSmooth '平滑线散点图
ActiveChart.SetSourceData Source:=Range("'Sheet1'!$A$1:$C$40")
With ActiveChart
.HasTitle = True '为图表设置标题
.SeriesCollection().Name = "sin" '为图例设置名称
.SeriesCollection().Name = "cos" '.SeriesCollection(i).Name=Worksheets("Sheet1").Range("A" & i)
With .ChartTitle
.Text = "正弦余弦图"
.Font.Name = "宋体"
.Font.Size =
.Font.ColorIndex =
.Top =
.Left =
End With
With .Axes(xlCategory) '为图表设置横坐标
.HasTitle = True
.AxisTitle.Text = "统计含量"
.AxisTitle.Font.Name = "宋体"
.AxisTitle.Font.Size =
.AxisTitle.Font.Bold = False
.AxisTitle.Font.ColorIndex =
.MinimumScale = Cells(, ) - Cells(, ) * 0.2
.MaximumScale = Cells(, ) + Cells(, ) * 0.2
End With With .Axes(xlValue) '为图表设置纵坐标
.HasTitle = True
.AxisTitle.Text = "百分数"
.AxisTitle.Font.Name = "宋体"
.AxisTitle.Font.Size =
.AxisTitle.Font.Bold = False
.AxisTitle.Font.ColorIndex =
' i = Excel.Application.WorksheetFunction.Match("203", f, 0)
.MinimumScale = Excel.Application.WorksheetFunction.Min(Range("B:B")) '**zbl**范围要加一个Range才不会出错,下面的不行
.MaximumScale = Excel.Application.WorksheetFunction.Max(Range("B:B"))
' .MinimumScale = Excel.Application.WorksheetFunction.Min("B:B")
' .MaximumScale = Excel.Application.WorksheetFunction.Max("B:B")
' .MinimumScale = Application.WorksheetFunction.Min("b1:b40")
' .MaximumScale = Application.WorksheetFunction.Max("b4:b40")
'Sub UseFunction()
' Dim myRange As Range
' Set myRange = Worksheets("Sheet1").Range("A1:C10")
' answer = Application.WorksheetFunction.Max搜索(myRange)
' MsgBox answer
'End Sub
End With
.HasLegend = True '为图表设置图例
With .Legend
.Position = xlLegendPositionRight
.Font.ColorIndex =
.Font.Bold = True
End With End With End Sub
设置网格线:

 '--------------------------------------------------------Module1--------------------------------------------------------

 Sub Macro1()

     ActiveSheet.Range("B1:C40").Select

     ActiveSheet.Shapes.AddChart.Select

     ActiveChart.ChartType = xlXYScatterSmooth '平滑线散点图

     ActiveChart.SetSourceData Source:=Range("'Sheet1'!$A$1:$C$40")

     ActiveWindow.GridlineColor = RGB(, , ) '窗体excel网格周围的线成红色了

     ActiveWindow.DisplayGridlines = False

     With ActiveChart

         .HasTitle = True                                    '为图表设置标题

         .SeriesCollection().Name = "sin"                   '为图例设置名称

         .SeriesCollection().Name = "cos"                   '.SeriesCollection(i).Name=Worksheets("Sheet1").Range("A" & i)

         With .ChartTitle

             .Text = "正弦余弦图"

             .Font.Name = "宋体"

             .Font.Size =

             .Font.ColorIndex =

             .Top =

             .Left =

         End With

         With .Axes(xlCategory)                             '为图表设置横坐标

             .HasTitle = True

             .AxisTitle.Text = "统计含量"

             .AxisTitle.Font.Name = "宋体"

             .AxisTitle.Font.Size =

             .AxisTitle.Font.Bold = False

             .AxisTitle.Font.ColorIndex =

             .MinimumScale = Cells(, ) - Cells(, ) * 0.2

             .MaximumScale = Cells(, ) + Cells(, ) * 0.2

         End With

         With .Axes(xlValue)                               '为图表设置纵坐标

             .HasTitle = True

             .AxisTitle.Text = "百分数"

             .AxisTitle.Font.Name = "宋体"

             .AxisTitle.Font.Size =

             .AxisTitle.Font.Bold = False

             .AxisTitle.Font.ColorIndex =

             ' i = Excel.Application.WorksheetFunction.Match("203", f, 0)

             .MinimumScale = Excel.Application.WorksheetFunction.Min(Range("B:B")) '**zbl**范围要加一个Range才不会出错,下面的不行

             .MaximumScale = Excel.Application.WorksheetFunction.Max(Range("B:B"))

 '            .MinimumScale = Excel.Application.WorksheetFunction.Min("B:B")

 '            .MaximumScale = Excel.Application.WorksheetFunction.Max("B:B")

 '            .MinimumScale = Application.WorksheetFunction.Min("b1:b40")

 '            .MaximumScale = Application.WorksheetFunction.Max("b4:b40")

 'Sub UseFunction()

 '    Dim myRange As Range

 '    Set myRange = Worksheets("Sheet1").Range("A1:C10")

 '    answer = Application.WorksheetFunction.Max搜索(myRange)

 '    MsgBox answer

 'End Sub

         End With

         .HasLegend = True                                      '为图表设置图例

         With .Legend

             .Position = xlLegendPositionRight

             .Font.ColorIndex =

             .Font.Bold = True

         End With

         Range("c1:d2").Borders.LineStyle = xlContinuous '区域全部设置线

         Range("c1:d2").Borders.LineStyle = xlNone          '取消单元格线’

         Range("d4").Borders(xlEdgeTop).LineStyle = xlContinuous '只设置单元格d3顶线 http://www.excelpx.com/thread-294531-1-1.html

         With Range("a1:b2").Borders

             .LineStyle = xlContinuous   '设置边框线

             .Weight = xlThick           '设置边框线为粗线

         End With

     End With

 End Sub
说明
每个 ChartObject 对象都代表一个嵌入图表。ChartObject 对象充当 Chart 对象的容器。ChartObject
对象的属性和方法控制工作表上嵌入图表的外观和大小。ChartObjects 集合
示例
使用 ChartObjects 方法返回 ChartObjects
集合。以下示例删除名为“Sheet1”的工作表上的所有嵌入图表。
| Visual Basic for Applications |
|---|
|
不能使用 ChartObjects 集合来调用以下属性和方法:
- RoundedCorners 属性
- Locked 属性
- Placement 属性
- PrintObject 属性
- Shadow属性
- SendToBack 方法
- BringToFront 方法
与早期版本不同,ChartObjects 集合现在可以读取有关高度、宽度、左对齐和顶对齐的属性。
使用 Add 方法可创建一个新的空嵌入图表并将它添加到集合中。使用 ChartWizard 方法可添加数据并设置新图表的格式。以下示例创建一个新嵌入图表,然后以折线图形式添加单元格 A1:A20 中的数据。
| Visual Basic for Applications |
|---|
|
使用 ChartObjects(index)(其中 index 是嵌入图表的索引号或名称)可以返回单个对象。以下示例设置名为“Sheet1”的工作表上嵌入图表 Chart 1 中的图表区图案。
| Visual Basic for Applications |
|---|
|
 Dim ch As ChartObject

 Set ch = Worksheets("sheet1").ChartObjects.Add(, , , )

 ch.Chart.ChartWizard source:=Worksheets("sheet1").Range("a1:a20"), _

     gallery:=xlLine, title:="New Chart"
excel2007VBA绘图2的更多相关文章
- excel2007vba绘图1
参考:http://club.excelhome.net/thread-480025-1-1.html '----------------------------------------------- ...
- Canvas绘图之平移translate、旋转rotate、缩放scale
画布操作介绍 画布绘图的环境通过translate(),scale(),rotate(), setTransform()和transform()来改变,它们会对画布的变换矩阵产生影响. 函数 方法 描 ...
- 用html5的canvas和JavaScript创建一个绘图程序
本文将引导你使用canvas和JavaScript创建一个简单的绘图程序. 创建canvas元素 首先准备容器Canvas元素,接下来所有的事情都会在JavaScript里面. <canvas ...
- echarts+php+mysql 绘图实例
最近在学习php+mysql,因为之前画图表都是直接在echart的实例demo中修改数据,便想着两相结合练习一下,通过ajax调用后台数据画图表. 我使用的是echart3,相比较第二版,echar ...
- html5 canvas常用api总结(二)--绘图API
canvas可以绘制出很多奇妙的样式和美丽的效果,通过几个简单的api就可以在画布上呈现出千变万化的效果,还可以制作网页游戏,接下来就总结一下和绘图有关的API. 绘画的时候canvas相当于画布,而 ...
- HTML5_04之SVG绘图
1.关于Canvas绘制图像: 问题:需要绘制多张图片时,必须等待所有图片加载完成才能开始绘制:而每张图片都是异步请求,彼此没有先后顺序,哪一张先加载完成完全无法预测: 方案: var progres ...
- HTML5 学习总结(四)——canvas绘图、WebGL、SVG
一.Canvas canvas是HTML5中新增一个HTML5标签与操作canvas的javascript API,它可以实现在网页中完成动态的2D与3D图像技术.<canvas> 标记和 ...
- AR创意分享:儿童涂鸦遇上程序绘图
第一节 临摹 小明经常临摹同桌小美的画作. 美术课上,老师表扬了小美的新作. 图1.1 小美的作品<蒙娜·毛虫的微笑> 临,是照着原作画:摹,是用薄纸张蒙在原作上面画. 第二节 借画 小明 ...
- C# 一段绘图代码 在form_load事件不能显示图
今天无意将一段绘图代码 写在form_load事件了,结果不能显示绘图.(代码:Graphics g = this.CreateGraphics();Pen pen = new Pen(Color.R ...
随机推荐
- 自定义进度条渐变色View
package com.jianke.stepCounter.Activity; import android.annotation.SuppressLint; import android.cont ...
- "//./root/CIMV2" because of error 0x80041003. Events cannot be delivered through this filter until the problem is corrected.
windows系统日志错误信息: Event filter with query "SELECT * FROM __InstanceModificationEvent WITHIN 60 W ...
- .net中使用XPath语言在xml中判断是否存在节点值的方法
book.xml<?xml version="1.0" encoding="utf-8" ?> <bookstore> <boo ...
- java8 数据结构的改变(一)
在JDK1.6,JDK1.7中,HashMap采用数组+链表实现,即使用链表处理冲突,同一hash值的链表都存储在一个链表里.但是当数组中一个位置上的元素较多,即hash值相等的元素较多时,通过key ...
- [转] initrd详解
转自:http://www.cnblogs.com/leaven/archive/2010/01/07/1641324.html 在Linux操作系统中,有一项特殊的功能——初始化内存盘INITRD( ...
- 如何通过class文件来查看java的版本
我们知道class文件是通过javac编译生成的,如果我们想知道是java的那个版本生成的,该怎么做? 很简单,Linux下只要使用od命令,如下: 前四个字节为固定的cafe babe,接下来的四个 ...
- 修改别人写的Hibernate数据库操作代码
最近正在维护别人写的一个关于Hibernate操作数据库的项目,在运行测试的时候(向表中插入记录),报了一个错误:cannot insert a null into column(XXX字段名,下文统 ...
- BZOJ3191或洛谷2059 [JLOI2013]卡牌游戏
BZOJ原题链接 洛谷原题链接 我们可以倒着来\(DP\). 设\(f[i][j]\)表示剩余\(i\)个人,从庄家数起第\(j\)个人的胜率,设当前枚举到第\(k\)张牌,该情况下这一轮淘汰的位置为 ...
- 爬虫初窥day1:urllib
模拟“豆瓣”网站的用户登录 # coding:utf-8 import urllib url = 'https://www.douban.com/' data = urllib.parse.urlen ...
- clean
启动tomcat 报 Could not delete D:/online/.metadata/.plugins/org.eclipse.wst.server.core/tm