MATLAB绘图
matlab绘制散点图
clc,clear
x=[11.9,11.5,14.5,15.2,15.9,16.3,14.6,12.9,15.8,14.1];
y=[196.84,196.84,197.14,197.03,197.05,197.13,197.04,196.96,196.95,196.98];
plot(x,y,'.')

Matlab将坐标系中的点连接起来
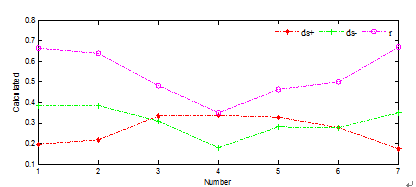
matlab绘制点线图
U
V
R=V./(U+V)
%图形展示出来
x=[1 2 3 4 5 6 7];
plot(x,U,'-.R*','LineWidth',2);
hold on;
plot(x,V,'-.G+','LineWidth',2);
hold on;
plot(x,R,'-.Mo','LineWidth',2);
%hold on;
%grid on;
xlabel('Number');
ylabel('Recognition rate (%)');
matlab:对单个矩阵plot绘图的说明
实例:a=magic(5)
a =
17 24 1 8 15
23 5 7 14 16
4 6 13 20 22
10 12 19 21 3
11 18 25 2 9
plot(a)
grid on

x=rand(10,1,40); % 随机取40个数 一个当横坐标 一个当纵坐标
y=rand(10,1,40);
%画图
plot(x( 1:10),y( 1:10),'r.');hold on; % 点    r=红色
plot(x(11:20),y(11:20),'g*');hold on; % 星星  g=绿色
plot(x(21:30),y(21:30),'o');hold on;  % 圆圈  默认是蓝色
plot(x(31:40),y(31:40),'mo','MarkerSize',15) % 大大的圆圈  m=紫色
分别按行组和行列绘制三维条形图
Y = round(rand(5,3)*10); %随机函数产生5*3的数组,对产生的数据取整
subplot(2,2,1)
bar(Y,'group')
title 'Group'
subplot(2,2,2)
bar(Y,'stack') %堆型二维垂直条形图
title 'Stack'
subplot(2,2,3)
barh(Y,'stack') %堆型二维水平条形图
title 'Stack'
subplot(2,2,4)
bar(Y,1.5) %设定条形的宽度为1.5
title 'Width = 1.5'
效果如图

Y = [1 2 3 4 5 6 7;
1 2 3 4 3 2 1;
76 5 4 3 2 1];
subplot(3,2,1)
bar3(Y,'detached')
title('Detached')
subplot(3,2,2)
bar3(Y,0.25,'detached')
title('Width = 0.25')
subplot(3,2,3)
bar3(Y,'grouped')
title('Grouped')
subplot(3,2,4)
bar3(Y,0.5,'grouped')
title('Width = 0.5')
subplot(3,2,5)
bar3(Y,'stacked')
title('Stacked')
subplot(3,2,6)
bar3h(Y,0.3,'stacked')
title('Width = 0.3')
效果如图

Matlab将坐标系中的点连接起来
- clc; clear all; close all;
- y=[60,58,55,53,53,53,51,50,49,46,41,41,41,40,39,40,40,40];
- x=[229,230,231,232,232,233,234,235,235,237,239,239,239,240,241,241,240,240];
- figure; hold on; box on;
- [x1, ind] = sort(x);
- y1 = y(ind);
- [b1, m1, n1] = unique(x1, 'first');
- xt = linspace(min(x), max(x));
- yt = interp1(x1(m1), y1(m1), xt, 'spline');
- plot(xt, yt, 'r-');
- plot(x, y, 'k*')

MATLAB绘图的更多相关文章
- Matlab绘图详解
Matlab绘图 强大的绘图功能是Matlab的特点之一,Matlab提供了一系列的绘图函数,用户不需要过多的考虑绘图的细节,只需要给出一些基本参数就能得到所需图形,这类函数称为高层绘图函数.此外,M ...
- 使用axes函数在matlab绘图中实现图中图的绘制
使用axes函数在matlab绘图中实现图中图的绘制 有时为了对细节进行详细说明,需要在一个较大坐标轴上绘制一个小图来对局部进行放大以阐述结果. 这可以通过调用axes函数实现. 下面通过绘制 y=1 ...
- matlab绘图--线性规划图解法示意
matlab绘图--线性规划图解法示意 图解法 matlab绘图 区域填充 线性规划问题: matlab绘图 L1=[4,0;4,4]; plot(L1(:,1),L1(:,2));hold on ...
- Matlab绘图(一二三维)
Matlab绘图 强大的绘图功能是Matlab的特点之一,Matlab提供了一系列的绘图函数,用户不需要过多的考虑绘图的细节,只需要给出一些基本参数就能得到所需图形,这类函数称为高层绘图函数.此外,M ...
- Matlab绘图高级部分
图形是呈现数据的一种直观方式,在用Matlab进行数据处理和计算后,我们一般都会以图形的形式将结果呈现出来.尤其在论文的撰写中,优雅的图形无疑会为文章加分.本篇文章非完全原创,我的工作就是把见到的Ma ...
- (转载)MatLab绘图
转载自:http://www.cnblogs.com/hxsyl/archive/2012/10/10/2718380.html 转载自:http://www.cnblogs.com/jeromebl ...
- Matlab绘图系列之高级绘图
Matlab绘图系列之高级绘图 原帖地址: http://blog.163.com/enjoy_world/blog/static/115033832007865616218/ Matlab绘图 20 ...
- matlab绘图(详细)(全面)
Matlab绘图 强大的绘图功能是Matlab的特点之一,Matlab提供了一系列的绘图函数,用户不需要过多的考虑绘图的细节,只需要给出一些基本参数就能得到所需图形,这类函数称为高层绘图函数.此外,M ...
- Matlab 绘图完整入门
Matlab绘图 强大的绘图功能是Matlab的特点之一,Matlab提供了一系列的绘图函数,用户不需要过多的考虑绘图的细节,只需要给出一些基本参数就能得到所需图形,这类函数称为高层绘图函数.此外,M ...
- 详尽全面的matlab绘图教程
Matlab绘图 强大的绘图功能是Matlab的特点之一,Matlab提供了一系列的绘图函数,用户不需要过多的考虑绘图的细节,只需要给出一些基本参数就能得到所需图形,这类函数称为高层绘图函数.此外,M ...
随机推荐
- mongodb用子文档做为查询条件的两种方法
{ "_id": ObjectId("52fc6617e97feebe05000000"), "age": 28, "level& ...
- STM32之GPIO操作
啊哈.没办法.外国人的芯片就喜欢用英文来命名,所以中文的:通用输入/输出 就用GPIO来代替..谁叫哥们都不是外国人呢.好啦.胡扯了一下,借用唐伯虎点秋香的话:小小书童,可笑可笑... 知道了GPI ...
- xampp安装
软件下载在以下网站 http://www.apachefriends.org/zh_cn/index.html XAMPP 是一个易于安装且包含 MySQL.PHP 和 Perl 的 Apache 发 ...
- HDU 1528 贪心模拟/二分图
Card Game Cheater Time Limit: 2000/1000 MS (Java/Others) Memory Limit: 65536/32768 K (Java/Others ...
- Service之三种服务方式
(一)StartService 运行Service的方法之一.任何继承于android.content.Context的Android组件(component)都可以使用一个Intent(androi ...
- 安卓中級教程(6):annotation的基本用法
package com.example.ele_me.activity; import android.annotation.SuppressLint; import android.app.Acti ...
- mysql求最大第二,最大第三个数
题目是这样的: 集团有多个部门,部门下有多个员工,求每个部门绩效排名第二的人员 sql语句是这样的 SELECT dep, MAX(score) FROM zx WHERE score NOT IN ...
- js事件模型与自定义事件
JavaScript 一个最简单的事件模型,需要有事件绑定与触发,还有事件删除. var eventModel = { list: {}, bind: function () { var args = ...
- 如果让你来做HashMap扩容,如何实现在不影响读写的情况下扩容?
我觉得逼格高,不是体现在问题多刁钻,知识点多深,而是一个非常明确,无歧义的问题,能考察出面试者多方面的能力.这个问题背后:1.了解java中,HashMap的实现:如果一个面试者了解这一点,说明至少他 ...
- 使用Qt5.7.0 VS2015版本生成兼容XP的可执行程序 good(从VS2012 update1开始支持xp和c++11)
一.直接使用VS2012/VS2013/VS2015生成XP兼容的可执行程序 Visual Studio刚发布时没打补丁,称为RTM版,之后会陆续发布补丁,进行bug修复和功能增强.VS2010及之前 ...