
Java Memory Management
How Memory works in Java
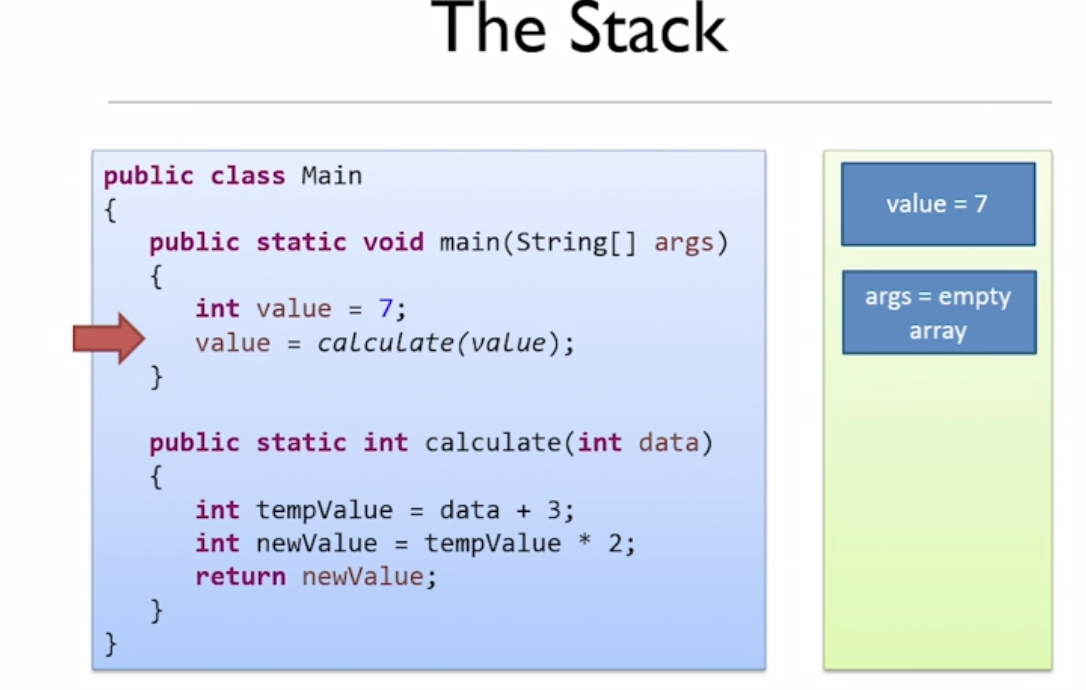
The role of the stack
- Each time you call a function, Java pushed the local variables for that function into the stack.
- When the method returns, all the data created on the stack for the method is popped or pulled from the stack.
- Whenever you reach a closing curly bracket, any local variables you declared inside the block that you're leaving is popped off the stack.
- Each thread has its own stack, so data on the stack can only be seen by the thread that owns the stack.
The role of the Heap
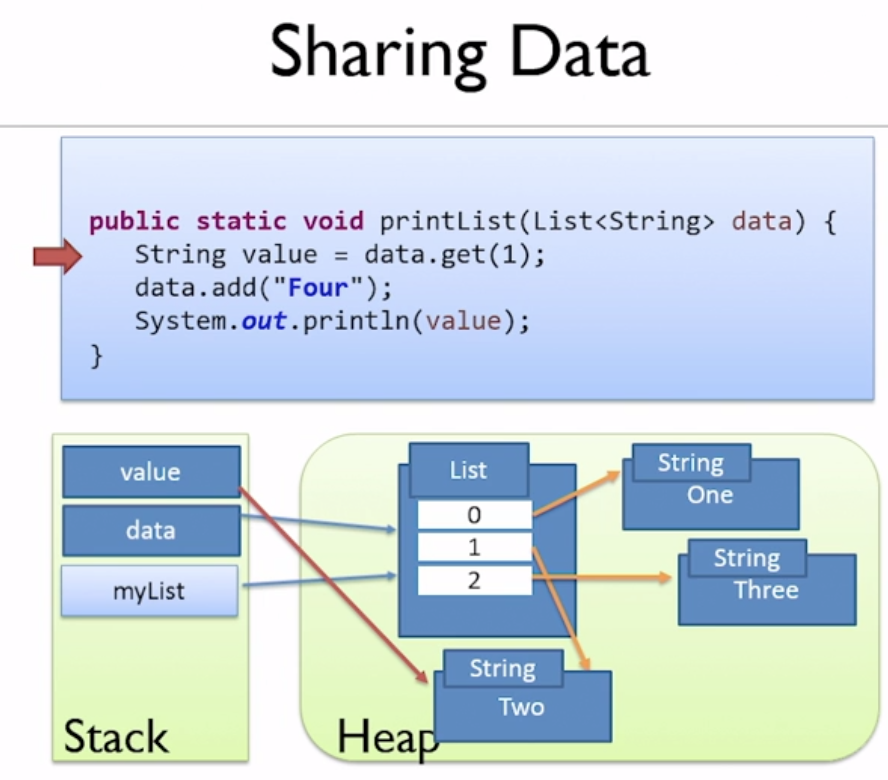
- All objects are stored on Heap, and shared across all threads.
- For the objects stored on the Heat there will be a pointer to the objects which is the variable reference stored on the stack.
Introduction to Garbage Collection
- String Pools
- Garbage Eligibility
Any objects on the Heap which cannot be reached through reference from the stack is eligible for GC.
- The gc() and finalize() methods
The gc() method suggests the JVM run GC process, but not guarantee that the JVM will do.
The finalize() method for the java.lang.object, this method is actually called by the gc. The gc might not run, so cannot rely on the finalize method being called.
Generational Garbage Collection
Mark and Sweep
- The general algorithm that GC use is called mark and sweep. It's a two stage process, the first stage is marking, and the second stage is sweeping.
- In the marking stage, the program's execution is first paused (stop the world event). It simply looks every variable in the stack and follows its reference, the object that it finds at the end of the reference is marked as being alive.
- In the sweeping stage, a full scan of the Heap take place, the memory occupied by the objects not marked of in use, can then be freed up. And finally, the objects are being kept are moved to a single continuous block of memory.
Using the Visual GC tool to view a soft leak
- Young generation (monor GC) VS. old generation (major GC)
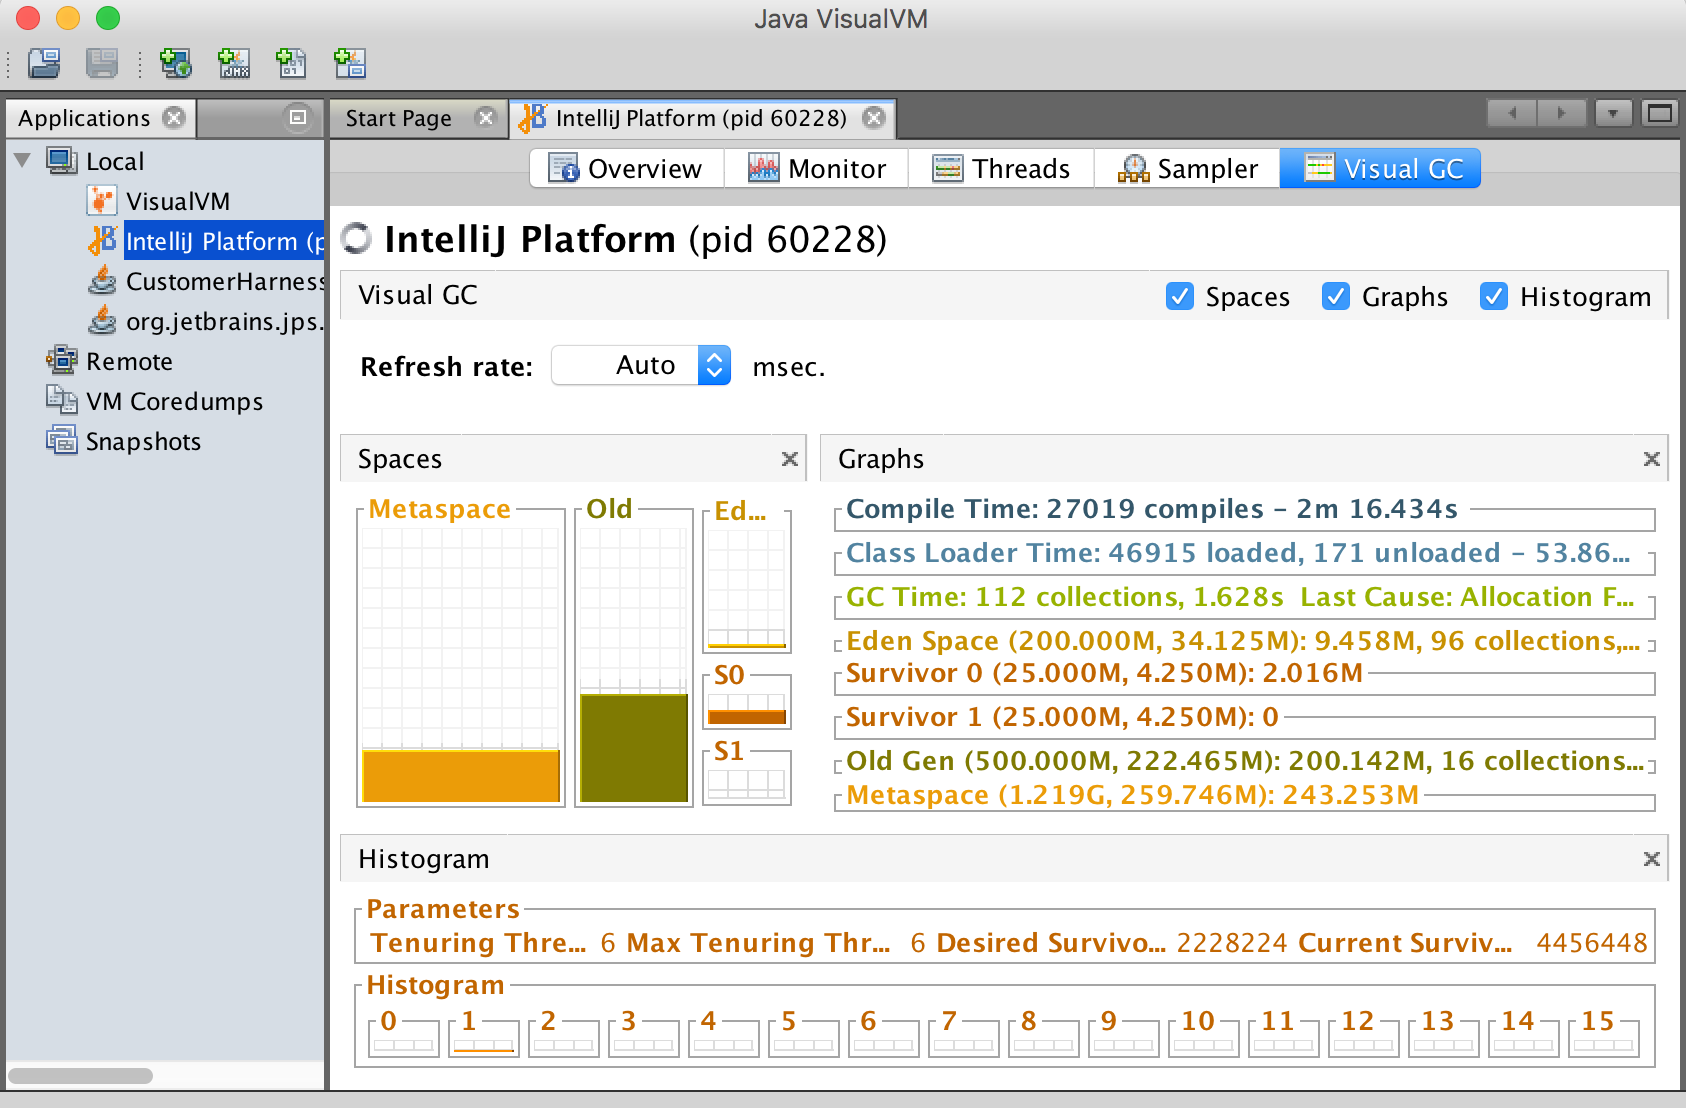
- Can view these generations by the visual VM tool
a. $cd $JAVA_HOME/bin
b. $open jvisualvm
c. Need to install a plugin, go to the tools menu -> plugins -> available plugin tab -> select visual GC -> install. After finish install, close and reopen to see the new tab "Visual GC" should appear.
d. Go to the Monitor tab -> Heap Dump, will create Heap dump file for further analyzing.
Using the Memory Analyzer tool
a. Download MAT from eclipse.org/mat
b. Open the Heap dump file by MAT.
** Hit below error when start MAT on MAC:
See the log file
/Users/$USER/.eclipse/227783881_macosx_cocoa_x86_64/configuration/1554282657960.log
!ENTRY org.eclipse.osgi 4 0 2019-04-03 17:11:18.252
10 !MESSAGE Application error
11 !STACK 1
12 java.lang.IllegalStateException: The platform metadata area could not be written: /privat e/var/folders/cp/bnmgrhws25b_3272ly4zn0d00000gn/T/AppTranslocation/94A1F89C-EF58-45B4-A82 5-3D7DCEF5963D/d/mat.app/Contents/MacOS/workspace/.metadata. By default the platform wri tes its content
13 under the current working directory when the platform is launched. Use the -data parameter to
14 specify a different content area for the platform.
Solution:
$ vi mat.app/Contents/Eclipse/MemoryAnalyzer.ini
edit your MemoryAnalyzer.ini file, and add those lines (on two separate lines, and before the vm arguments), replacing the second with the path where you want the MemoryAnalyzer to write its content:
-data

<desired path of your working directory>
PermGen and the Metaspace
- In the Java 6, there is a further part of the Heap called PermGen. PermGen is nerver garbage-collected. There are two types of objects that go to PermGen, internized strings, and metadata for class.
- From Java 7, internized strings are no longer stored in PermGen, this change means that the internized strings are in the old part of the Heap, and can be garbage-collected.
- From Java 8, they removed the PermGen altogether, instead created something else called MetaSpace, which is where the class metadata are placed.
- The MetaSpace is a separate area of memory and it's not part of the Heap. Instead it's allocated out the host's native memory so the maximum available space for the MetaSpace is the total available system memory for the computer.
Tuning the Virtual Machine
Heap size
-Xmx, -Xms are non-standard argumants, so they are not guaranteed to be implemented on every runtime.
Please reference below page for the Java command line options.
https://docs.oracle.com/javase/8/docs/technotes/tools/windows/java.html
Garbage collection and generation sizes
-verbose:gc
-Xmn : set the size of the young generation
Choosing a garbage collector
- Serial : a single thread
- Parallel : multiple threads running.
- Mostly Concurrent: the stop-the-world part of the GC process is mimimized.
Java Memory Management的更多相关文章
- Java Memory Management(1)
Java Memory Management, with its built-in garbage collection, is one of the language’s finest achiev ...
- 转)Understanding Java Memory Management
Understanding Java Memory Management - IBM Java Native Interface (JNI) Objects and Code Java Native ...
- Java Memory Management Skill List
Java内存管理小技巧: 尽量使用直接量 当需要使用字符串,还有Byte,Short,Integer,Long,Float,Double,Boolean,Character包装类的实例时,程序不应该采 ...
- Java (JVM) Memory Model – Memory Management in Java
原文地址:http://www.journaldev.com/2856/java-jvm-memory-model-memory-management-in-java Understanding JV ...
- Understanding Java Memory Model-理解java内存模型(JVM)
from https://medium.com/platform-engineer/understanding-java-memory-model-1d0863f6d973 Understanding ...
- jmap命令(Java Memory Map)(转)
JDK内置工具使用 一.javah命令(C Header and Stub File Generator) 二.jps命令(Java Virtual Machine Process Status To ...
- Android内存管理(1)WRANGLING DALVIK: MEMORY MANAGEMENT IN ANDROID PART 1
from : http://www.raizlabs.com/dev/2014/03/wrangling-dalvik-memory-management-in-android-part-1-of-2 ...
- The Introduction of Java Memory Leaks
One of the most significant advantages of Java is its memory management. You simply create objects a ...
- Understanding Memory Management(2)
Understanding Memory Management Memory management is the process of allocating new objects and remov ...
随机推荐
- css实现3D切换功能
Demo asdasdasd <!DOCTYPE html> <html lang="en"> <head> <title>De ...
- Android组件化探索与实践
什么是组件化 不用去纠结组件和模块语义上的区别,如果模块间不存在强依赖且模块间可以任意组合,我们就说这些模块是组件化的. 组件化的好处 实现组件化本身就是一个解耦的过程,同时也在不断对你的项目代码进行 ...
- Linux下ps -ef和ps aux的区别
Linux下显示系统进程的命令ps,最常用的有ps -ef 和ps aux.这两个到底有什么区别呢?两者没太大差别,讨论这个问题,要追溯到Unix系统中的两种风格,System V风格和BSD 风格, ...
- PHP全栈学习笔记7
图形图像处理技术,gd库的强大支持,PHP的图像可以是PHP的强项,PHP图形化类库,jpgraph是一款非常好用的强大的图形处理工具. 在PHP中加载GD库 gd官方网址下载: http://www ...
- Linux如何查看与测试磁盘IO性能
1. 查看磁盘 IO 性能 1.1 top 命令 top 命令通过查看 CPU 的 wa% 值来判断当前磁盘 IO 性能,如果这个数值过大,很可能是磁盘 IO 太高了,当然也可能是其他原因,例如网络 ...
- mac-os安装autojump
一 概念 autojump是一个命令行工具,它可以使用快捷命令,直接跳转到配置好的目录,而不用管现在身在何处,依赖zsh. 一 安装 安装zsh:sh -c "$(curl -fsSL ht ...
- [ZJOI2007] 捉迷藏
idea1 可能会死掉的想法:考虑点分治维护每个分治中心x到达分治块内的个点距离,具体是用堆维护分治快内的x的儿子y到y的子树内的所有点距离(记为C[y]),取所有C[y]的top+e(x,y)放入x ...
- 前端笔记之服务器&Ajax(上)服务器&PHP&数据交互&HTTP
一.服务器 1.1 什么是服务器,做什么的? 服务器,就是放在机房中的电脑,和我们的电脑的区别在与服务器有固定的IP,服务器的安全性和稳定性相当的高;性能一般就可以了,但是CPU的性能要比普通的客户机 ...
- zk分布式任务管理
在我们的系统开发过程 中不可避免的会使用到定时任务的功能,而当我们在生产环境部署的服务超过1台时,就需要考虑任务调度的问题,防止两台或多台服务器上执行同一个任务,这个问题今天咱们就用zookeeper ...
- 【Java】留下没有基础眼泪的面试题
前言 只有光头才能变强 本文力求简单讲清每个知识点,希望大家看完能有所收获 一.如何减少线程上下文切换 使用多线程时,不是多线程能提升程序的执行速度,使用多线程是为了更好地利用CPU资源! 程序在执行 ...