Analysis of Variance ANOVA versus T test 方差分析和T检验
Levels are different groupings within the same independent variable(factor).
Eg. if the independent variable is “eggs” the levels might be Non-Organic, Organic, and Free Range Organic.
Analysis of Variance ANOVA 方差分析
Goal
whether there is a significant difference between/among the levels of the independent variables.
Assumptions
- Independence of observations
- Normality the distributions of the residuals are normal
- Equality (or "homogeneity") of variances —the variance of data in groups should be the same.
Levels are different groupings within the same independent variable(factor).
Eg. if the independent variable is “eggs” the levels might be Non-Organic, Organic, and Free Range Organic.
Eg.
You recruit 9 anxious individuals and randomly assign them to receive CBT, EMDR, M, 3 kinds of treatment for 5 weeks
Treatment is a between-groups factor with 3 levels. It’s called a between-groups factor because patients are assigned to one and only one group.
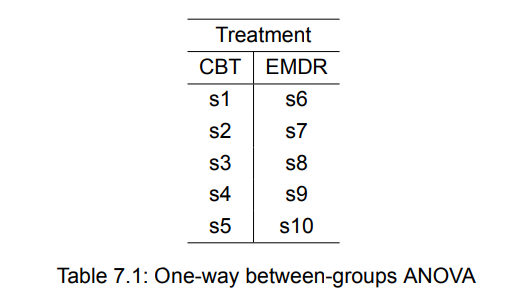
Because there are an equal number of observations in each treatment condition, you have a balanced design. When the sample sizes are unequal across the cells of a design, you have an unbalanced design.
If you are interested in the effect of CBT on anxiety over time, you could place 9 patients in the CBT group and assess them at the end of therapy and again 6 months later.
Time is a within-groups factor with two levels. It’s called a within-groups factor because each patient is measured under both levels.
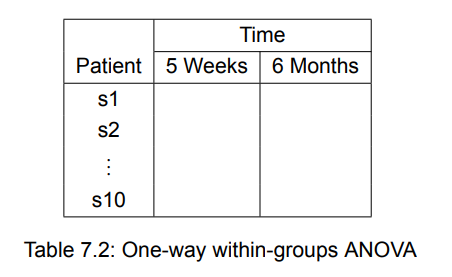
within-groups ANOVA is also called repeated measures ANOVA.
Hypothesis
\(H_0\) : \(\mu_1 = \mu_2\)
One-way ANOVA
\]
\(Y_{ij}\) is the -th observation in the -th out of \(\) groups and \(\) is the overall sample size, \(n_i\) is the sample size of each group
d.f.1= K - 1
d.f.2 = N - K
The F statistic will be large if the between-group variability is large relative to the within-group variability, which means the mean value of each group is not the same.
F large, reject \(H_0\)
Two-way ANOVA
![[Pasted image 20221128143527.png]]
Therapy (averaged across time), Time (averaged across therapy type) are called the main effects, and the interaction of Therapy and Time called interaction effect.
When you cross two or more factors, as you’ve done here, you have a factorial ANOVA design. Crossing two factors produces a two-way ANOVA, crossing three factors produces a three-way ANOVA, and so forth. When a factorial design includes both between-groups and within-groups factors, it’s also called a mixed-model ANOVA. The current design is a two-way mixed-model factorial ANOVA.
In this case you’ll have three F tests: one for Therapy, one for Time, and one for the Therapy_Time interaction.
The above focus on axiety, however, depression and anxiety often co-occur. Because depression could also explain the group differences on the dependent variable, it’s a confounding factor and its value is a covariate. And if you’re not interested in depression, it’s called a nuisance variable. If you are, then the design would be called an analysis of covariance (ANCOVA)
Finally, you’ve recorded a single dependent variable in this study (the STAI ). You could increase the validity of this study by including additional measures of anxiety (such as family ratings, therapist ratings, and a measure assessing the impact of anxiety on their daily functioning). When there’s more than one dependent variable, the design is called a multivariate analysis of variance (MANOVA). If there are covariates present, it’s called a multivariate analysis of covariance (MANCOVA).
Implementation with R
aov()
- usage:
aov(formula, data = dataframe) - symbols-used-for-ANOVA-in-R-formulas
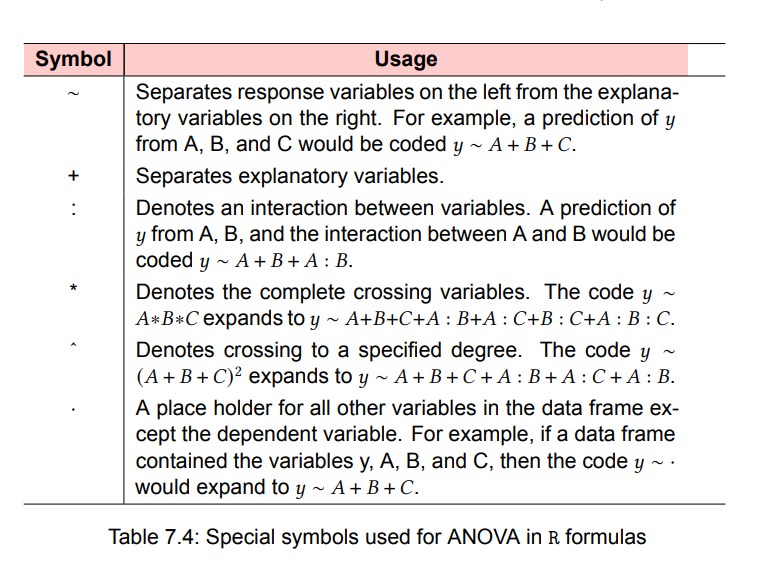
Below are formulas for several common research designs. In this table, lowercase letters are quantitative variables, uppercase letters are grouping factors, and Subject is a unique identifier variable for subjects.

Type I (sequential) Effects are adjusted for those that appear earlier in the formula. is unadjusted. B is adjusted for the . The : interaction is adjusted for and .
Type II (hierarchical) Effects are adjusted for other effects at the same or lower level. is adjusted for . is adjusted for . The : interaction is adjusted for both and .
Type III (marginal) Each effect is adjusted for every other effect in the model. is adjusted for and : . is adjusted for and : . The : interaction is adjusted for and .
R employs the Type I approach by default. Other programs such as SAS and SPSS employ the Type III approach by default.The first model can be written out as ∼ + + : . The resulting R ANOVA table will assess
• The impact of on
• The impact of on , controlling for
• The interaction of and , controlling for the and main effects.
The greater the imbalance in sample sizes, the greater the impact that the order of the terms will have on the results. In general, more fundamental effects should be listed earlier in the formula. In particular, covariates should be listed first, followed by main effects, followed by two-way interactions, followed by three-way interactions, and so on.
Note that the Anova() function in the car package provides the option of using the Type II or Type III approach, rather than the Type I approach used by the aov() function. You may want to use the Anova() function if you’re concerned about matching your results to those provided by other packages such as SAS and SPSS .
T test
Assumptions
- Independence of observations
- Normality:the distributions of the residuals are normal
- Equality (or "homogeneity") of variances —the variance of data in groups should be the same.
Analysis of Variance ANOVA 方差分析 vs T test
formulas
ANOVA: $$F = \frac{MST}{MSE} = \frac{\text{Mean sum of squares due to treatment}}{\text{Mean sum of squares due to error}}$$
t-test: 2groups (通常是两种疗法把样本分成两类)
ANOVA: 2 or more groups (one factor 2/3/4...levels (groups) / many factors)
when 2 group, n < 50 t-test; otherwise ANOVA
Analysis of Variance ANOVA versus T test 方差分析和T检验的更多相关文章
- 方差分析、T检验、卡方分析如何区分?
差异研究的目的在于比较两组数据或多组数据之间的差异,通常包括以下几类分析方法,分别是方差分析.T检验和卡方检验. 三个方法的区别 其实核心的区别在于:数据类型不一样.如果是定类和定类,此时应该使用卡方 ...
- Analysis of variance(ANOVA)
方差分析,也称为"变异数分析",用于两个及两个以上样本均值(group means)差别的显著性检验.在 ANOVA 的环境下,一个观测得到的方差视为是由不同方差的源组合而成.
- Hotelling T2检验和多元方差分析
1.1 Hotelling T2检验 Hotelling T2检验是一种常用多变量检验方法,是单变量检验的自然推广,常用于两组均向量的比较. 设两个含量分析为n,m的样本来自具有公共协方差阵的q维正态 ...
- 使用spss做方差分析
还记得上学那会老师专门敲了黑板,强调方差分析很重要..单因素方差分析(Analysis of Variance, ANOVA),如果变量多,就是多因素方差分析,还需要考虑到多重共线性, 也就是线性代数 ...
- 单因素方差分析(One Way ANOVA)
Analysis of variance (ANOVA) is a collection of statistical models and their associated estimation p ...
- SAS学习笔记26 方差分析
对于多于两组(k>2)样本均数的比较,t检验不再适用,方差分析(analysis of variance, ANOVA)则是解决上述问题的重要分析方法.方差分析由R.A.Fisher(1923) ...
- 方差分析(python代码实现)
python机器学习-乳腺癌细胞挖掘(欢迎关注博主主页,学习python视频资源,还有大量免费python经典文章) https://study.163.com/course/introduction ...
- ANOVA (paper from the onlinestat)
Introduction Author(s) David M. Lane Prerequisites Variance, Significance Testing,All Pairwise Compa ...
- [Reship]如何回复审稿人意见
================================= This article came from here:http://blog.renren.com/GetEntry.do?id= ...
- Multiple Regression
Multiple Regression What is multiple regression? Multiple regression is regression analysis with mor ...
随机推荐
- Docker安装(win10)
Docker安装 windows 首先开启Hyper-V Hyper-V 是微软开发的虚拟机,类似于 VMWare 或 VirtualBox,仅适用于 Windows 10.这是 Docker Des ...
- 关于PLC的脉冲输出(S7-300)
1. 关于脉冲输出 脉冲输出的方法有很多: 如果要产生占空比为50%的脉冲信号: ① 用S7-300PLC的时钟存储器 右键点击PLC,选中时钟存储器,默认存储字节为0. 各时钟存储器的周 ...
- 前端复习之HTML5
HTML5 Day01: *概念: *HTML5之后,声明不在出现版本信息 *HTML5永远不可能离开JavaScript. *HTML5在移动端支持好于PC端 * ...
- @click使用三元运算符
@click="scope.row.status == 1 ? '' : blockUp(scope.row) "
- 前端访问Tornado跨域问题解决
- idea plugins搜不出来东西
今天学习Vue要安装一个Vue.js的插件,在idea的plugins上搜死活搜不出来,参照了网上的关防火墙,勾选什么auto什么的选项还是不管用,最后瞎捣鼓弄好了,在博客上记录一下. 打开手机数据( ...
- c/c++指针从浅入深介绍——基于数据内存分配的理解(上)
c/c++指针从浅入深介绍--基于数据内存分配的理解(上) 本文是对自我学习的一个总结以及回顾,文章内容主要是针对代码中的数据在内存中的存储情况以及存储中数值的变化来对指针进行介绍,是对指针以及数据在 ...
- something to SSSSay
可能记录写博客的初衷,现在的状态,一些目标.想法. 首先让我拟定几个关键词: 半吊子程序员 咸鱼 欲求不满 终生学习 自律 <差不多程序员> 长得差不多(175)高,看着差不多(普通)帅, ...
- 全网最详细中英文ChatGPT接口文档(三)30分钟快速入门ChatGPT——资源库
目录 Python library(Python库) Node.js library(Node.js库) Community libraries 社区图书馆 C# / .NET Crystal Go ...
- 一文了解清楚kafka消息丢失问题和解决方案
前言 今天分享一下kafka的消息丢失问题,kafka的消息丢失是一个很值得关注的问题,根据消息的重要性,消息丢失的严重性也会进行放大,如何从最大程度上保证消息不丢失,要从生产者,消费者,broker ...