ELK 错误: retrying failed action with response code: 403, kibana无log显示
今天10点时候同事报出kibana突然不显示log了,开始紧急排查
1. 从数据源头查起,先看被filebeat监视的log文件是否在更新(一般只要log对应服务在正常运行,log文件中就会有数据持续更新)
tail -f log.log
发现log中数据在持续更新,说明数据源头没有问题
2. 查看filebeat服务的log
filebeat 服务的log输出在nohup中
tail -f nohup.out
filebeat 正常,没有问题
3. 检查logstash
查看logstash是否在运行

在运行,但是是否logstash和ES的通信是否正常呢?
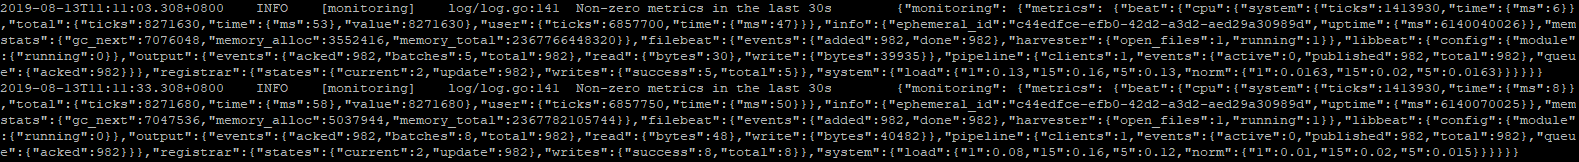
看logstash 的log
tail -f nohup.out

what? [FORBIDDEN/12/index read-only / allow delete (api)];"})
索引被置为了只读。。。。
官网对这个问题介绍:

进入kibana Dev Tools
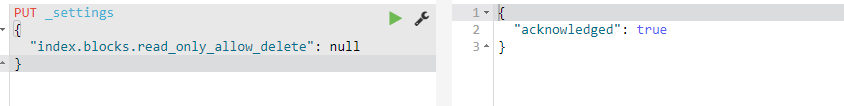
再次查看discover并刷新,log开始更新了`````````````
总结:
这个问题出现的原因就是ES存储磁盘空间不足导致,控制洪水阶段水印。它默认为95%,这意味着Elasticsearch执行一个只读索引块(index.blocks.read_only_allow_delete)每个指标都有一个或多个碎片分配的节点上,至少有一个磁盘超过限额。这是最后一招,以防止节点耗尽磁盘空间。一旦有足够的磁盘空间用于允许索引操作,索引块必须手动释放。
leader同志 多给点硬盘空间不行吗???
ELK 错误: retrying failed action with response code: 403, kibana无log显示的更多相关文章
- retrying failed action with response code: 403 错误解决
[2019-06-10T06:52:51,610][INFO ][logstash.outputs.elasticsearch] retrying failed action with respons ...
- [logstash.outputs.elasticsearch] retrying failed action with response code: 403
0x00 Event [2019-09-24T19:22:31,655][INFO ][logstash.outputs.elasticsearch] retrying failed action w ...
- retrying failed action with response code: 403
0x00 Event [2019-09-24T19:22:31,655][INFO ][logstash.outputs.elasticsearch] retrying failed action w ...
- logstash retrying failed action with response code: 429
https://blog.csdn.net/alan_liuyue/article/details/78926015 https://blog.csdn.net/ypc123ypc/article/d ...
- 通过设置代理,解决服务器禁止抓取,报“java.io.IOException: Server returned HTTP response code: 403 for URL”错误的方法
java.io.IOException: Server returned HTTP response code: 403 for URL: http:// 这个是什么异常呢? 当你使用java程序检索 ...
- nginx反向代理 报错:Error during WebSocket handshake: Unexpected response code: 403
遇到nginx报错:websocket wss failed: Error during WebSocket handshake: Unexpected response code: 403 serv ...
- Domain=com.alamofire.error.serialization.response Code=-1016 "Request failed: unacceptable content-type: text/html"
2015-11-16 10:39:17.235 PullDemo[338:60b] Application windows are expected to have a root view contr ...
- vue-cli 安装失败Failed to download repo vuejs-templates/vuedemo: Response code 404 (Not Found)
还原问题现场: 第一次使用vue init webpack projectName的时候,由于操作失误,执行了两次npm install -g vue-cli,然后再使用vue init webpac ...
- Error Domain=com.alamofire.error.serialization.response Code=-1016 "Request failed: unacceptabl
在使用AFNetworking 2.0 的时候本来一切很顺畅,但是中途遇到几个比较坑的地方 这里分享一下爬坑经历,忘读者不能速爬坑! 在发送请求后,NSURLSessionDataTask一直报错 ...
随机推荐
- PowerDesigner设置code和name不联动的方法
按照如下设置即可: 具体步骤:菜单:Tools--General Options--Name to Code mirroring的复选框不要选中.
- SAP HANA2可视化客户端工具
TreeSoft数据库管理系统使用JAVA开发,采用稳定通用的springMVC +JDBC架构,实现基于WEB方式对 MySQL,Oracle,PostgreSQL,MSSQL, Hive,DB2, ...
- golang struct组合,转型问题请教
type Action interface { OnHurt2(other Action) GetDamage() int } type Base struct { atk, hp int } fun ...
- Flutter参数的传递和接收
上次只写了方法和参数,这次写了完整的示例,页面间参数的传递和接收的示例. 1.参数传递 用在程序上解释就是比如你进入一个商品选择列表,当你想选择一个商品的具体信息的时候,你就要传递商品编号,详细页面接 ...
- jstack使用
top -p 22072 -H -p:查看某个进程 -H列出所有的线程 printf '%x' 22398 (16进制线程号) sudo -u tomcat jstack 22072 | grep ...
- PCM-FTL
1. 运行时第一行需要是write 错误位置 trace_stat->sectors += length;
- 在Linux上显示某个进程的线程的几种方式
方法一:PS 在ps命令中,"-T"选项可以开启线程查看.下面的命令列出了由进程号为的进程创建的所有线程. 1.$ ps -T -p 方法二: Top top命令可以实时显示各个线 ...
- POJ3259 Wormholes 【spfa判负环】
题目链接:http://poj.org/problem?id=3259 Wormholes Time Limit: 2000MS Memory Limit: 65536K Total Submis ...
- pytorch安装问题
目录 1.版本 2.pytorch调试中出现的Module 'torch' has no 'zero' member如何解决 3.No module named 'numpy.core._multia ...
- 《MIT 6.828 Lab 1 Exercise 7》实验报告
本实验链接:mit 6.828 lab1 Exercise 7. 题目 Exercise 7. Use QEMU and GDB to trace into the JOS kernel and st ...