matplotlib 可视化 —— 移动坐标轴(中心位置)
通常软件绘图,包括 matlab、python 的 matplotlib,默认都是将坐标轴置于画布(figure)的最下侧(x 轴),最左侧(y 轴),也即将坐标原点置于左下角。而我们自己理解数学,以及手动绘图时,都会将坐标轴置于中心的位置。
1. 导入相关的包
import numpy as np

import matplotlib.pyplot as plt
2. 获取 figure 和 axis
fig = plt.figure(figsize=(4, 4))

ax = fig.add_subplot(111)

plt.show()
3. 隐藏上边和右边
上下左右,四个边属于当前轴对象(axis);
ax.spines['top'].set_color('none')

ax.spines['right'].set_color('none')
4. 移动另外两个轴
ax.xaxis.set_ticks_position('bottom')

ax.spines['bottom'].set_position(('data', 0))

ax.yaxis.set_ticks_position('left')

ax.spines['left'].set_position(('data', 0))
5. 填充数据
theta = np.arange(0, 2*np.pi, 2*np.pi/100)

ax.plot(np.cos(theta), np.sin(theta))

plt.show()
7. 其他设置
plt.style.use('ggplot')

ax.set_xticks([-1.2, 1.2])

ax.set_yticks([-1.2, 1.2])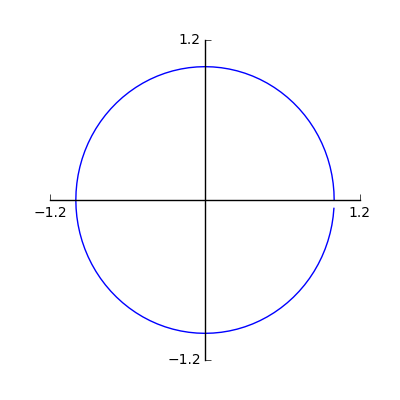
完整代码:
import numpy as np

import matplotlib.pyplot as plt

fig = plt.figure(figsize=(4, 4))

ax = fig.add_subplot(111)

ax.spines['top'].set_color('none')

ax.spines['right'].set_color('none')

ax.xaxis.set_ticks_position('bottom')

ax.spines['bottom'].set_position(('data', 0))

ax.yaxis.set_ticks_position('left')

ax.spines['left'].set_position(('data', 0))

theta = np.arange(0, 2*np.pi, 2*np.pi/100)

ax.plot(np.cos(theta), np.sin(theta))

plt.style.use('ggplot')

ax.set_xticks([-1.2, 1.2])

ax.set_yticks([-1.2, 1.2])

plt.show()
matplotlib 可视化 —— 移动坐标轴(中心位置)的更多相关文章
- SciKit-Learn 使用matplotlib可视化数据
章节 SciKit-Learn 加载数据集 SciKit-Learn 数据集基本信息 SciKit-Learn 使用matplotlib可视化数据 SciKit-Learn 可视化数据:主成分分析(P ...
- iOS10 UI教程视图的中心位置
iOS10 UI教程视图的中心位置 center表示的是视图的中心位置属性,这个属性在相对的UI层次结构上工作,和frame类似.center属性是一个在父视图上定义视图的位置的简便方法.center ...
- 国外大神制作的一个很棒的matplotlib 可视化教程
国外大神制作的一个很棒的matplotlib 可视化教程 参考:https://www.machinelearningplus.com/plots/top-50-matplotlib-visualiz ...
- matplotlib可视化之如何给图形添加数据标签?
当我们获取完数据之后,一般来说数据可视化呈现的最基础图形就是:柱状图.水平条形图.折线图等等,在python的matplotlib库中分别可用bar.barh.plot函数来构建它们,再使用xtick ...
- pyhton matplotlib可视化图像基础(二维函数图、柱状图、饼图、直方图以及折线图)
//2019.07.22pyhton中matplotlib模块的应用pyhton中matplotlib是可视化图像库的第三方库,它可以实现图像的可视化,输出不同形式的图形1.可视化图形的输出和展示需要 ...
- Python数据分析matplotlib可视化之绘图
Matplotlib是一个基于python的2D画图库,能够用python脚本方便的画出折线图,直方图,功率谱图,散点图等常用图表,而且语法简单. Python中通过matplotlib模块的pypl ...
- matplotlib 可视化 —— 定制 matplotlib
1. matplotlibrc 文件 matplotlib使用matplotlibrc [matplotlib resource configurations] 配置文件来自定义各种属性,我们称之为 ...
- matplotlib可视化最全指南
1. 折线图:plt.plot 设置数据:plt.plot(x,y),单列数据传入默认y轴,此时x轴数据默认从0逐渐对应递增 设置颜色:plt.plot(x,y,color/c=" &quo ...
- python库之matplotlib学习---关于坐标轴
首先定·定义x, y创建一个figure import numpy as np import matplotlib.pyplot as plt x = np.linspace(-1, 1, 10) y ...
随机推荐
- Eureka Server的REST端点
Eureka Server的REST端点 Windows下面可以安装Curl: 使用more命令可以显示xml内容: D:\Java\IdeaProjects>more rest-api-tes ...
- spark源代码action系列-foreach与foreachPartition
RDD.foreachPartition/foreach的操作 在这个action的操作中: 这两个action主要用于对每一个partition中的iterator时行迭代的处理.通过用户传入的fu ...
- 实践补充 Installing Tomcat 7.0.x on OS X
我的 Mac 下是1.6的 SDK,下载 Tomcat 8.0 执行后,訪问 http://127.0.0.1:8080 并无反应,并且关闭脚本会报错 : Unsupported major.mino ...
- 一个ibatis映射文件的例子(包含增删改单查,多查)
<?xml version="1.0" encoding="UTF-8" ?><!DOCTYPE mapper PUBLIC "-/ ...
- 17、lambda表达式
一.简介 lambda表达式允许你通过表达式来代替功能接口,lambda表达式就和方法一样,它提供了一个正常的参数列表和一个使用这些参数的主体(body,可以是一个表达式或一个代码块),它还增强了集合 ...
- ubuntu 休眠之后蓝牙鼠标无效果。
ubuntu链接蓝牙鼠标之后.左上角蓝牙标志左下角应该有一个锁的标志. 可是休眠之后,蓝牙鼠标失效,锁没有了,点击按键,出来锁之后,立即消失. 运行两次例如以下命令能够解决: sudo hciconf ...
- hdu1525 Euclid's Game , 基础博弈
http://acm.hdu.edu.cn/showproblem.php?pid=1525 题意: 两人博弈,给出两个数a和b, 较大数减去较小数的随意倍数.结果不能小于0,将两个数随意一个数减到0 ...
- scikit-learn:3.5. Validation curves: plotting scores to evaluate models
參考:http://scikit-learn.org/stable/modules/learning_curve.html estimator's generalization error can b ...
- bzoj2190: [SDOI2008]仪仗队(欧拉)
2190: [SDOI2008]仪仗队 题目:传送门 题解: 跟着企鹅大佬做题! 自己瞎搞搞就OK,不难发现,如果以C作为原点建立平面直角坐标系,那么在这个坐标系中,坐标为(x,y)且GCD(x,y) ...
- 英语影视台词---七、THE GREAT GATSBY QUOTES
英语影视台词---七.THE GREAT GATSBY QUOTES 一.总结 一句话总结:了不起的盖茨比 1.“So we beat on, boats against the current, b ...