zabbix如何监控WEB应用性能
HTTP服务目前最流行的互联网应用之一,如何监控服务的健康状态对系统运维来说至关重要。 Zabbix本身提供了对WEB应用程序的监控,比如监控WEB程序的Download Speed,Response Time和Response Code等性能指标,但是配置起来比较繁琐和复杂。下面通过 python pycurl模块来获取HTTP响应时间,下载速度,状态吗等性能指标。然后通过zabbix trapper的方式来监控WEB应用的性能。 Zabbix trapper监控是客户端收集监控数据,然后以zabbix_sender的方式发送给zabbix server或者proxy服务器。发送的数据主要包括zabbix server或者proxy主机名,监控项和值。zabbix_sender具体用法如下:
|
1
2
3
4
5
6
7
8
9
10
11
12
13
14
15
16
17
18
19
20
21
22
23
|
[root@monitor]# /usr/local/zabbix/bin/zabbix_sender -helpZabbix Sender v2.2.3 (revision 44105) (7 April 2014)usage: zabbix_sender [-Vhv] {[-zpsI] -ko | [-zpI] -T -i <file> -r} [-c <file>]Options: -c --config <file> Absolute path to the configuration file -z --zabbix-server <server> Hostname or IP address of Zabbix server -p --port <server port> Specify port number of server trapper running on the server. Default is 10051 -s --host <hostname> Specify host name. Host IP address and DNS name will not work -I --source-address <IP address> Specify source IP address -k --key <key> Specify item key -o --value <key value> Specify value -i --input-file <input file> Load values from input file. Specify - for standard input Each line of file contains whitespace delimited: <hostname> <key> <value> Specify - in <hostname> to use hostname from configuration file or --host argument -T --with-timestamps Each line of file contains whitespace delimited: <hostname> <key> <timestamp> <value> This can be used with --input-file option Timestamp should be specified in Unix timestamp format -r --real-time Send metrics one by one as soon as they are received This can be used when reading from standard input -v --verbose Verbose mode, -vv for more detailsOther options: -h --help Give this help -V --version Display version number |
下面是我用python写的监控脚本,如果要监控多个网站,只需在list列表里面添加即可。
|
1
2
3
4
5
6
7
8
9
10
11
12
13
14
15
16
17
18
19
20
21
22
23
24
25
26
27
28
29
30
31
32
33
34
35
36
37
38
39
40
41
42
43
44
45
46
47
48
49
50
51
52
53
54
55
56
57
58
59
60
61
62
63
64
|
[root@monitor cron]# cat Check_HTTP_Response_Time.py#!/usr/bin/env python#coding=utf-8#Auth:davidimport osimport sysimport fileinputimport pycurlimport logginghostname = "monitor"#IP from Zabbix Server or proxy where data should be send to.zabbix_server = "192.168.100.200" zabbix_sender = "/usr/local/zabbix/bin/zabbix_sender"#If add url of website, please update list.list = ['www.zmzblog.com','img.zmzblog.com']#This list define zabbix key.key = ['HTTP_ResSize','HTTP_ResTime','HTTP_ResCode','HTTP_ResSpeed']#In the file to define the monitor host, key and value.log_file = "/tmp/HTTP_Response.log"logging.basicConfig(filename=log_file,level=logging.INFO,filemode='w')run_cmd="%s -z %s -i %s > /tmp/HTTP_Response.temp" % (zabbix_sender,zabbix_server,log_file)class Test(): def __init__(self): self.contents = '' def body_callback(self,buf): self.contents = self.contents + bufdef Check_Http(URL): t = Test() #gzip_test = file("gzip_test.txt", 'w') c = pycurl.Curl() c.setopt(pycurl.WRITEFUNCTION,t.body_callback) #请求采用Gzip传输 #c.setopt(pycurl.ENCODING, 'gzip') try: c.setopt(pycurl.CONNECTTIMEOUT, 60) c.setopt(pycurl.URL,URL) c.perform() except pycurl.error: print "URL %s" % URL Http_Document_size = c.getinfo(c.SIZE_DOWNLOAD) Http_Download_speed = round((c.getinfo(pycurl.SPEED_DOWNLOAD) /1024),2) Http_Total_time = round((c.getinfo(pycurl.TOTAL_TIME) * 1000),2) Http_Response_code = c.getinfo(pycurl.HTTP_CODE) logging.info(hostname +' ' +key[0] + '[' + k + ']' + ' '+str(Http_Document_size)) logging.info(hostname +' ' +key[1] + '[' + k + ']' + ' '+str(Http_Total_time)) logging.info(hostname +' ' +key[2] + '[' + k + ']' + ' '+str(Http_Response_code)) logging.info(hostname +' ' +key[3] + '[' + k + ']' + ' '+str(Http_Download_speed)) def runCmd(command): for u in list: URL = u global k if u.startswith('https:'): k = u.split('/')[2] else: k=u.split('/')[0] Check_Http(URL) for line in fileinput.input(log_file,inplace=1): print line.replace('INFO:root:',''), return os.system(command)runCmd(run_cmd) |
添加crontab,定期收集数据并发送给zabbix server服务器。
|
1
|
*/5 * * * * /zabbix/python/cron/Check_HTTP_Response.py |
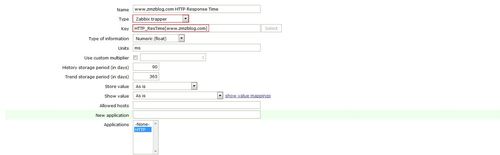
然后在前端配置监控项,可以调用zabbix API批量添加监控项。下面以www.zmzblog.com为例来说明如何监控HTTP的响应时间。这里所有的监控类型都是Zabbix_trapper的方式。监控key HTTP_ResTime[www.zmzblog.com], HTTP_ResCode[www.zmzblog.com],HTTP_ResSize[www.zmzblog.com],HTTP_ResSpeed[www.zmzblog.com]分别表示HTTP的响应时间,状态吗,文档大小和下载速度。
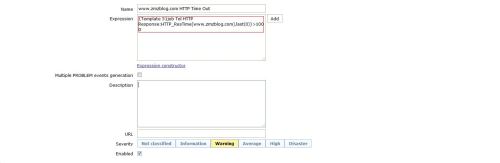
配置完监控项之后我们配置触发器,因为现在网站的响应时间都是毫秒级别的,如果超过1000ms就报警。
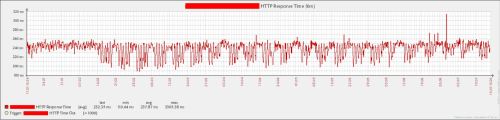
下面分别展示一下HTTP响应时间和状态码,其它的下载速度和文档大小就不展示了。
HTTP响应状态吗。

总结:WEB应用性能监控主要从下面两个方面进行监控。
1)HTTP的响应时间,随着互联网的发展,用户体验提升。网站的打开速度监控一定要快,至少要在毫秒级别。 2)HTTP的状态吗,实时监控网站的响应吗是否正常,是否出现了404,500这样的错误,这种错误是用户无法忍受的,如果出现要第一时间解决。 3)由于网络或者其它原因,为了减少误报,建议用下面的触发器,即检测2次如果状态吗不为200或者大于400的时候报警。
{Template HTTP Response:HTTP_ResCode[www.zmzblog.com].count(#2,200,”ne”)}=2 {Template HTTP Response:HTTP_ResCode[www.zmzblog.com].count(#2,400,”ge”)}=2
http://sfzhang88.blog.51cto.com/4995876/1826763
zabbix如何监控WEB应用性能的更多相关文章
- 自学Zabbix4.3 zabbix实战监控Web网站性能
自学Zabbix4.3 zabbix实战监控Web网站性能 用zabbix如何监控web性能和可用性呢?一般分为四个步骤:打开网站.登陆.登陆验证.退出,看实例. 1. 检测流程 1. 打开网站:如果 ...
- Zabbix Server 监控Web页面
Zabbix Server 监控Web页面 作者:尹正杰 版权声明:原创作品,谢绝转载!否则将追究法律责任. 1>.选中一台可以连接互联网的主机 2>.创建一个web场景,点击“Crea ...
- zabbix 监控web网站性能
一直在纠结用什么实例来给大家演示呢?想来想去还是官方的好,那我们怎么用zabbix监控web性能和可用性呢?我们这边分为几个步骤:打开网站.登陆.登陆验证.退出,一共4个小step,看实例. 检测流程 ...
- zabbix监控WEB网站性能
一直在纠结用什么实例来给大家演示呢?想来想去还是官方的好,那我们怎么用zabbix监控web性能和可用性呢?我们这边分为几个步骤:打开网站.登陆.登陆验证.退出,一共4个小step,看实例. 检测流程 ...
- zabbix 监控 WEB 应用性能
1.介绍使用 zabbix_sender 发送采集的 WEB 状态值,使用 pycurl 来采集 WEB 状态zabbix_sender发送数据,需保证主机名与zabbix server记录的主机名一 ...
- 自学Zabbix4.1 zabbix监控web服务器访问性能
自学Zabbix4.1 zabbix监控web服务器访问性能 使用Zabbix实现对web性能的监控,通过它可以了解web站点的可用性以及性能.最终将各项指标绘制到图形中,这样我们可以了解到一个站点的 ...
- (40)zabbix监控web服务器访问性能
zabbix web监控介绍 在host列可以看到web(0),在以前的版本这项是独立出来的,这个主要实现zabbix对web性能的监控,通过它可以了解web站点的可用性以及性能. 最终将各项指标绘制 ...
- zabbix系列(八)zabbix添加对web页面url的状态监控
通过zabbi做web监控不仅仅可以监控到站点的响应时间,还可以根据站点返回的状态码,或者响应时间做报警 1.对需要监控的主机添加web监控 在configuration—hosts 中打开主机列 ...
- Zabbix监控web,MySQL,TCP状态,Nginx
接上篇Zabbix使用SMTP发送邮件报警并且制定报警内容 Zabbix怎么设置声音告警 web监控 在zabbix server选择web 创建一个监控web的场景 添加后这里有数字1 查看 假如在 ...
随机推荐
- c# webbrowser 错误捕获
private void Form1_Load(object sender, EventArgs e) { webBrowser1.Url = new Uri("about:blank&qu ...
- 019. Asp.net将SqlServer中的数据保存到xls/txt中
using System; using System.Collections; using System.Configuration; using System.Data; using System. ...
- 解决tomcat一闪而过问题
环境: jdk 1.8.0.91 windows2003 tomcat8.0 故障现象:启动tomcat 时, 一闪而过 排障步骤: a) 首先是要调 ...
- CSS中:display:none与visible:hidden的区别
display:none视为不存在且不加载,即,不为被隐藏的对象保留其物理空间,即该对象在页面上彻底消失. visibility:hidden隐藏,但在浏览时保留位置,即,使对象在网页上不可见,但该对 ...
- html之dl标签
用来定义列表之用 通常与dt:定义列表中的项目 dd:描述列表中的项目 示例代码: <dl> <dt>数据库</dt> <dd>oracle</d ...
- maven NoClassDefFoundError: org/mortbay/util/Attributes
在运行mvn jetty:run报错: NoClassDefFoundError: org/mortbay/util/Attributes 解决方法: deleted /home/jenkins/.m ...
- PERCENT_RANK
1. percent_rank() over (order by .....) 返回某列或某列组合后每行的百分比排序 如下: with cte as( SELECT ROWNUM as n FRO ...
- ChinaUnix上的帮助手册还不错!
无意中发现ChinaUnix上的Linux帮助手册还真不错啊,有时间多看一看: http://man.chinaunix.net/linux/debian/debian_learning/index. ...
- 【Struts2学习笔记-4】包含其他配置文件
包含其他配置文件 <?xml version="1.0" encoding="UTF-8" ?> <!DOCTYPE struts PUBLI ...
- Shiro权限控制框架
Subject:主体,可以看到主体可以是任何可以与应用交互的"用户": SecurityManager:相当于SpringMVC中的DispatcherServlet或者Strut ...