基于ELK的传感器数据分析练习
Sensor Data Analytics Application
本案例参考自https://github.com/pranav-shukla/learningelasticstack/tree/master/chapter-10
ELK版本为5.6.12
数据构成
下面是sql的三个表通过关联sensorType得出的数据
| sensorType | customer | department | buildingName | room | floor | locationOnFloor | latitude | longitude |
|---|---|---|---|---|---|---|---|---|
| Temperature | Abc Labs | R & D | 222 Broadway | 101 | Floor1 | C-101 | 40.710936 | -74.0085 |
下面是sensor数据
| sensor_id | time | value |
|---|---|---|
| 1 | 1511935948000 | 21.89 |
在导入elasticsearch前把上面两种数据进行整合,即一条数据包含上面12个field。
数据模型设计
mysql表数据脚本可以到之前提到的GitHub下载。
POST _template/sensor_data_template

{

	"template" : "sensor_data*", # 这里6.0可能不一样

	"settings": {

		"number_of_replicas": "1",

		"number_of_shards": "5"

	},

	"mappings": {

		"doc": {

			"properties": {

				"sensorId": {

					"type": "integer"

				},

				"sensorType": {

					"type": "keyword",

					"fields": {

						"analyzed": {

							"type": "text"

						}

					}

				},

				"customer": {

					"type": "keyword",

					"fields": {

						"analyzed": {

							"type": "text"

						}

					}

				},

				"department": {

					"type": "keyword",

					"fields": {

						"analyzed": {

							"type": "text"

						}

					}

				},

				"buildingName": {

					"type": "keyword",

					"fields": {

						"analyzed": {

							"type": "text"

						}

					}

				},

				"room": {

					"type": "keyword",

					"fields": {

						"analyzed": {

							"type": "text"

						}

					}

				},

				"floor": {

					"type": "keyword",

					"fields": {

						"analyzed": {

							"type": "text"

						}

					}

				},

				"locationOnFloor": {

					"type": "keyword",

					"fields": {

						"analyzed": {

							"type": "text"

						}

					}

				},

				"location": {

					"type": "geo_point"

				},

				"time": {

					"type": "date"

				},

				"reading": {

					"type": "double"

				}

			}

		}

	}

}
Logstash配置
下面logstash配置会从sensor_data_http_input获取数据,然后filter从mysql中拉去信息来补充数据,成为lookupResult field,这需要mutate来展开,最后删除三个多余的fields。
jdbc_streaming插件的安装
./bin/logstash-plugin install logstash-filter-jdbc_streaming
input {

  http {

  	host => "localhost"

  	port => 8080

    id => "sensor_data_http_input"

    user => "sensor_data"

    password => "sensor_data"

  }

}

filter {

  jdbc_streaming {

    jdbc_driver_library => "/Users/flyang/Documents/big_data/hive-1.1.0-cdh5.11.2/lib/mysql-connector-java-5.1.46.jar"

    jdbc_driver_class => "com.mysql.jdbc.Driver"

    jdbc_connection_string => "jdbc:mysql://localhost:3306/sensor_metadata"

    jdbc_user => "root"

    jdbc_password => "password"

    statement => "select st.sensor_type as sensorType, l.customer as customer, l.department as department, l.building_name as buildingName, l.room as room, l.floor as floor, l.location_on_floor as locationOnFloor, l.latitude, l.longitude from sensors s inner join sensor_type st on s.sensor_type_id=st.sensor_type_id inner join location l on s.location_id=l.location_id where s.sensor_id= :sensor_identifier"

    parameters => { "sensor_identifier" => "sensor_id"}

    target => lookupResult

  }

  mutate {

    rename => {"[lookupResult][0][sensorType]" => "sensorType"}

    rename => {"[lookupResult][0][customer]" => "customer"}

    rename => {"[lookupResult][0][department]" => "department"}

    rename => {"[lookupResult][0][buildingName]" => "buildingName"}

    rename => {"[lookupResult][0][room]" => "room"}

    rename => {"[lookupResult][0][floor]" => "floor"}

    rename => {"[lookupResult][0][locationOnFloor]" => "locationOnFloor"}

    add_field => {

      "location" => "%{lookupResult[0]latitude},%{lookupResult[0]longitude}"

    }

    remove_field => ["lookupResult", "headers", "host"]

  }

}

output {

  elasticsearch {

    hosts => ["localhost:9200"]

    index => "sensor_data-%{+YYYY.MM.dd}"

  }

}
测试代码
将上面的output换成

output {stdout {} }

发送信息到logstash的监听端口

curl -XPOST -u sensor_data:sensor_data --header "Content-Type:application/json" "http://localhost:8080/" -d '{"sensor_id":1,"time":1512102540000,"reading":16.24}'
搭建好Logstash后通过脚本发送数据到elasticsearch后就可以使用Kibana进行分析了。
Kibana可视化
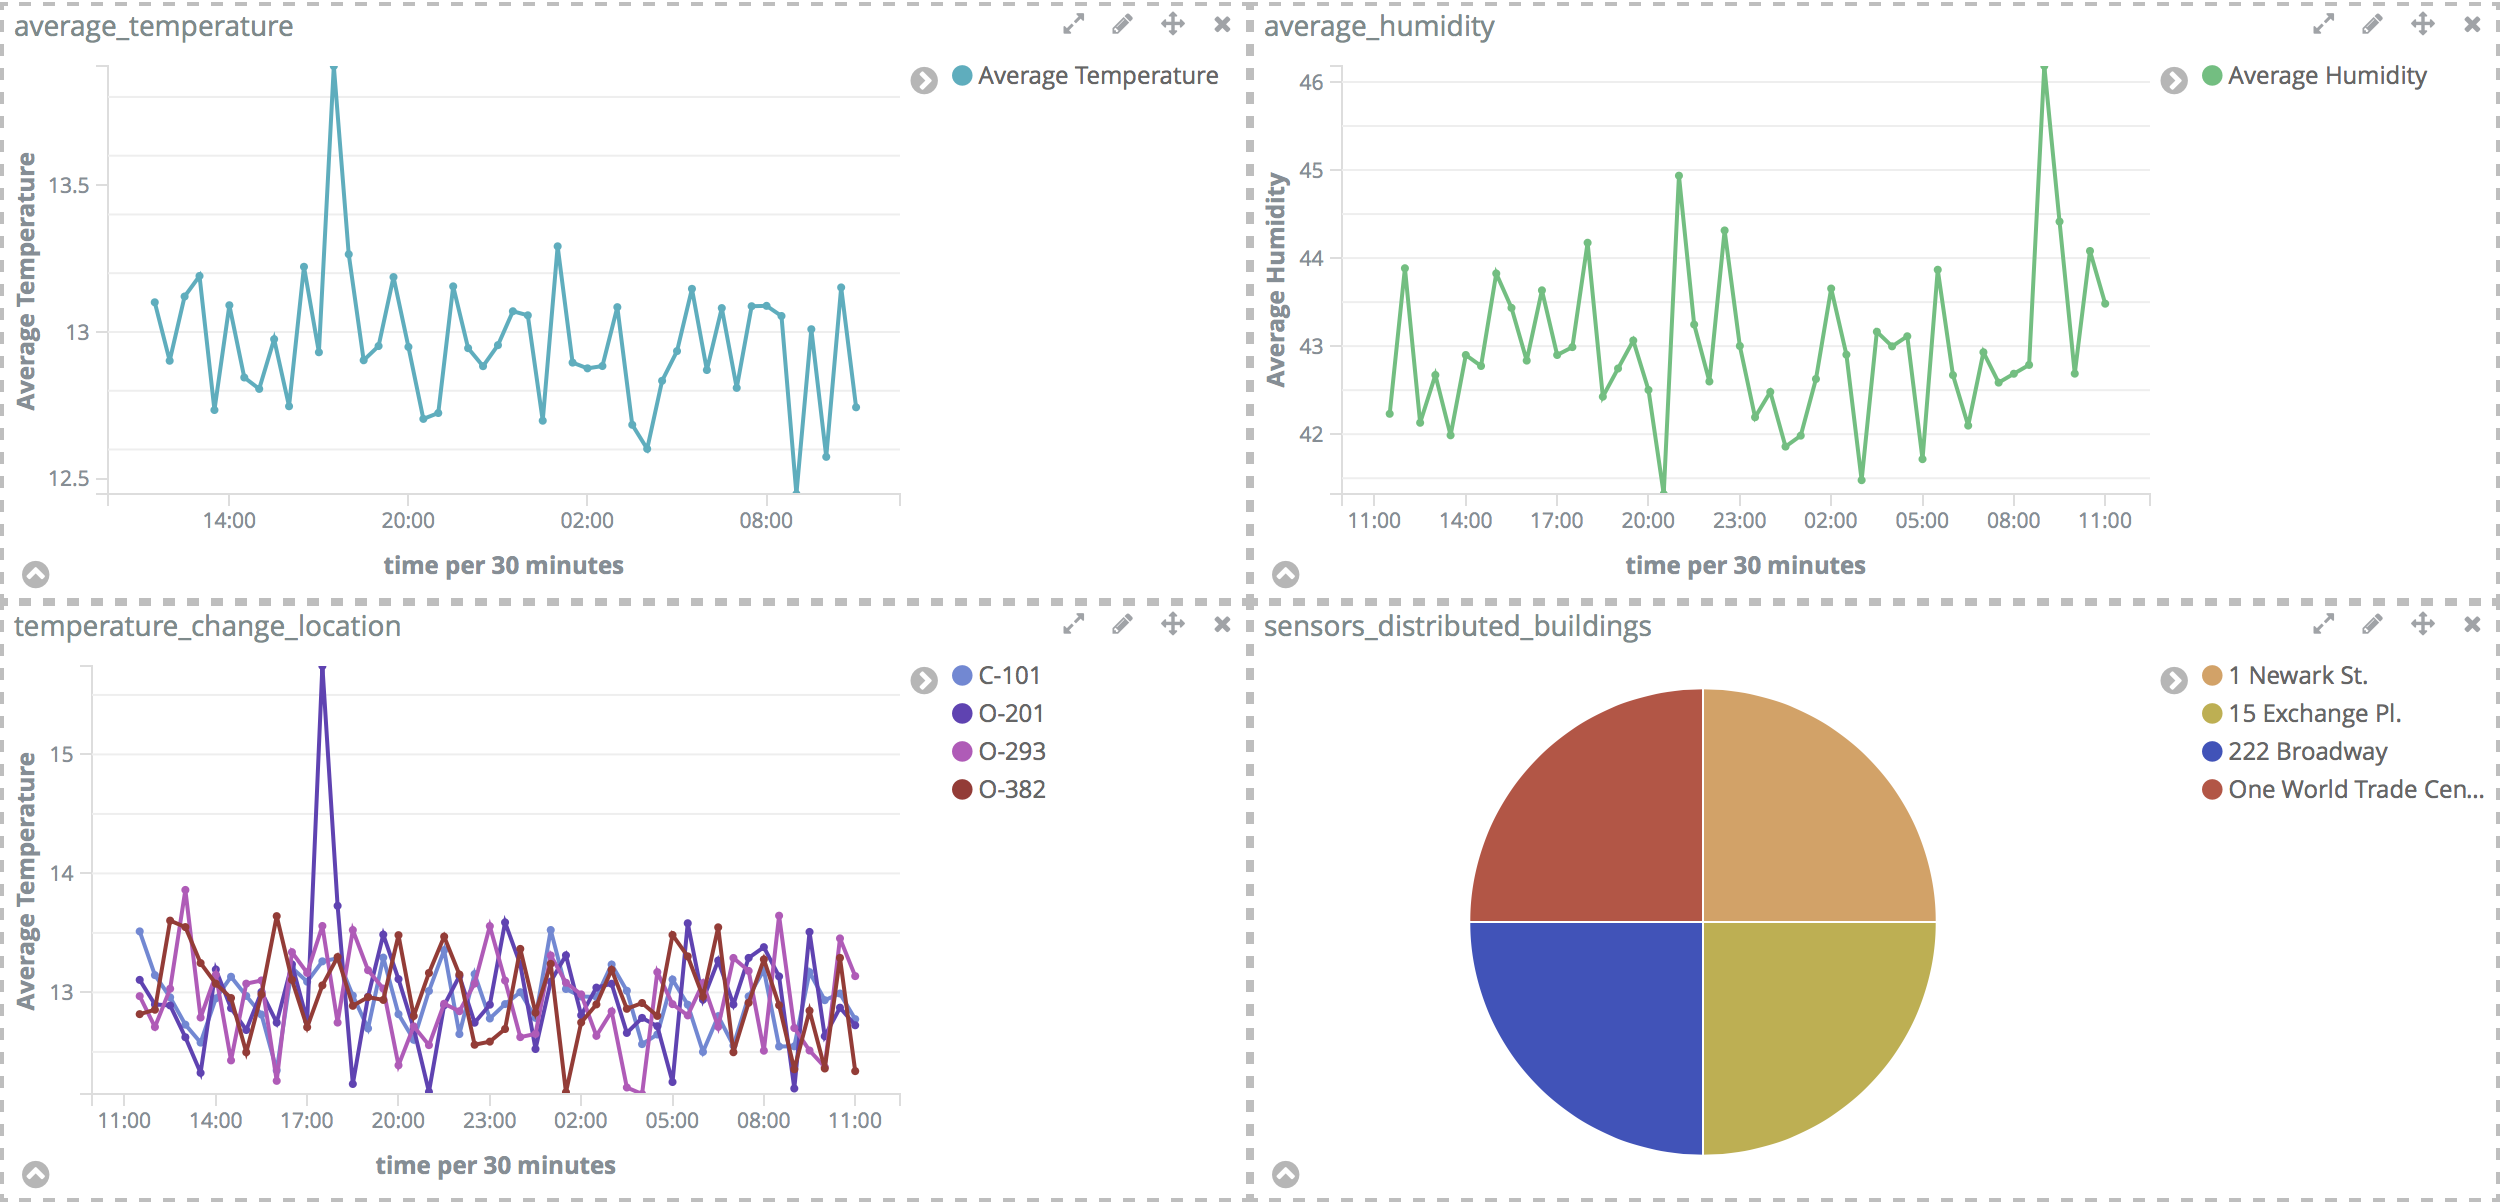
打开kibana,在management中新增index pattern:sensor_data*,选择Time Filter field name为time。下面是目标:
- How does the average temperature/humidity change over time?
- How do temperature change at each location over time?
- Can I visualize temperature and humidity over a map?(地图精度有限)
- How are the sensors distributed across buildings?
基于ELK的传感器数据分析练习的更多相关文章
- 基于ELK的简单数据分析
原文链接: http://www.open-open.com/lib/view/open1455673846058.html 环境 CentOS 6.5 64位 JDK 1.8.0_20 Elasti ...
- HDInsight-Hadoop现实(两)传感器数据分析
HDInsight-Hadoop现实(两)传感器数据分析 简要 现在,含传感器非常个人和商用设备收集来自物理世界的信息.例如.大多数手机都有 GPS.健身器材可以跟踪的步骤,你去数,恒温控制器可以监视 ...
- 基于ELK进行邮箱访问日志的分析
公司希望能够搭建自己的日志分析系统.现在基于ELK的技术分析日志的公司越来越多,在此也记录一下我利用ELK搭建的日志分析系统. 系统搭建 系统主要是基于elasticsearch+logstash+f ...
- (数据科学学习手札74)基于geopandas的空间数据分析——数据结构篇
本文对应代码已上传至我的Github仓库https://github.com/CNFeffery/DataScienceStudyNotes 1 简介 geopandas是建立在GEOS.GDAL.P ...
- (数据科学学习手札75)基于geopandas的空间数据分析——坐标参考系篇
本文对应代码已上传至我的Github仓库https://github.com/CNFeffery/DataScienceStudyNotes 1 简介 在上一篇文章中我们对geopandas中的数据结 ...
- (数据科学学习手札77)基于geopandas的空间数据分析——文件IO
本文对应代码和数据已上传至我的Github仓库https://github.com/CNFeffery/DataScienceStudyNotes 1 简介 在上一篇文章中我们对geopandas中的 ...
- (数据科学学习手札78)基于geopandas的空间数据分析——基础可视化
本文对应代码和数据已上传至我的Github仓库https://github.com/CNFeffery/DataScienceStudyNotes 1 简介 通过前面的文章,我们已经对geopanda ...
- (数据科学学习手札79)基于geopandas的空间数据分析——深入浅出分层设色
本文对应代码和数据已上传至我的Github仓库https://github.com/CNFeffery/DataScienceStudyNotes 1 简介 通过前面的文章,我们已经对geopanda ...
- (数据科学学习手札82)基于geopandas的空间数据分析——geoplot篇(上)
本文示例代码和数据已上传至我的Github仓库https://github.com/CNFeffery/DataScienceStudyNotes 1 简介 在前面的基于geopandas的空间数据分 ...
随机推荐
- MySQL Connector/Python 接口 (三)
本文参见这里. 使用缓冲的 cursor,下例给从2000年加入公司并且还在公司的员工薪水从明天起加15% from __future__ import print_function from dec ...
- popup介绍
一.作用 用于使浏览器自动生成弹窗 二.示例 1.新建Django项目,新建APP:app01, 项目根目录下新建文件夹static 2.静态文件配置,在settings.py中配置static: 3 ...
- python之抽象 2014-4-6
#抽象 8.40am-1.懒惰即美德2.抽象和结构3.创建函数 内建的callable 函数可以判定函数是否可以调用 >>> import math >>> x=1 ...
- add favorite & 收藏夹
add favorite // 收藏夹 function favorite (){ var ctrl = (navigator.userAgent.toLowerCase()).indexOf(&qu ...
- 网络编程基础:网络基础之网络协议、socket模块
操作系统(简称OS)基础: 应用软件不能直接操作硬件,能直接操作硬件的只有操作系统:所以,应用软件可以通过操作系统来间接操作硬件 网络基础之网络协议: 网络通讯原理: 连接两台计算机之间的Intern ...
- .net如何统计在线人数
原文发布时间为:2008-10-17 -- 来源于本人的百度文章 [由搬家工具导入] 统计在线用户的作用不言而喻,就是为了网站管理者可以知道当前用户的多少,然后根据用户数量来观察服务器或者程序的性能, ...
- codevs3728 联合权值
题目描述 Description 输入描述 Input Description 输出描述 Output Description 样例输入 Sample Input 样例输出 Sample Output ...
- Linux下汇编语言学习笔记54 ---
这是17年暑假学习Linux汇编语言的笔记记录,参考书目为清华大学出版社 Jeff Duntemann著 梁晓辉译<汇编语言基于Linux环境>的书,喜欢看原版书的同学可以看<Ass ...
- POJ 3734_Blocks
题意: 用红绿蓝黄四种颜色对一序列n个方块涂色,求出绿和红色方块数同时为偶数的染色方案数.mod=10007 分析: dp+矩阵快速幂 首先明确有三种状态: 红和绿均为偶数 红和绿只有一个为奇数 红和 ...
- js的声明与引入
<!DOCTYPE html> <html> <head> <meta charset="UTF-8"> <title> ...