Linux 性能搜集【top/vmstat/iostat】
为方便问题发生后,问题原因的分析排查,我们可以在服务器中事先部署如下脚本,方便故障发生后,问题原因的分析排查
脚本部署方法:
1.将脚本【top_monitor.sh】上传到服务器
2.登陆虚拟机,并切换到root用户
3.执行命令: chmod +x <path>/top_monitor.sh 【<path>替换成实际脚本上传的目录】
4.执行命令:crontab -e
5.添加定时任务:* * * * * <the path of the script>/top_monitor.sh <the path of ouputs saved> <keeps>
备注:
范例:* * * * * /root/top_monitor.sh /var/tmp/ 72 &
a.这里的keeps以小时为单位,如果保留三天的话,就输入72
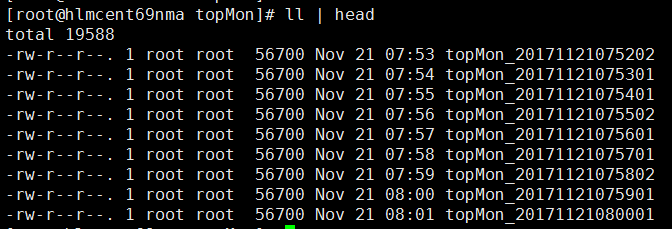
b.该脚本每五秒钟收集一次top/vmstat/iostat命令的输出,每分钟会生成一个性能数据文件
c.不要把用户数据放到该目录下,否则会被清理掉
6.搜集到的性能日志格式如下:
-- ::

top - :: up  day,  min,   users,  load average: 0.00, 0.00, 0.00

Tasks:  total,    running,  sleeping,    stopped,    zombie

Cpu(s):  1.0%us,  0.5%sy,  0.0%ni, 98.2%id,  0.3%wa,  0.0%hi,  0.0%si,  0.0%st

Mem:   3530640k total,   778368k used,  2752272k free,   127976k buffers

Swap:        0k total,        0k used,        0k free,   352288k cached

  PID USER      PR  NI  VIRT  RES  SHR S %CPU %MEM    TIME+  COMMAND

    root                       S  1.9  0.0   :07.04 events/

     root             S  0.0  0.0   :07.80 init

     root                       S  0.0  0.0   :00.01 kthreadd

     root      RT                 S  0.0  0.0   :02.09 migration/

     root                       S  0.0  0.0   :00.79 ksoftirqd/

     root      RT                 S  0.0  0.0   :00.00 stopper/

     root      RT                 S  0.0  0.0   :00.13 watchdog/

     root      RT                 S  0.0  0.0   :02.19 migration/

     root      RT                 S  0.0  0.0   :00.00 stopper/

     root                       S  0.0  0.0   :00.80 ksoftirqd/

    root      RT                 S  0.0  0.0   :00.13 watchdog/

    root                       S  0.0  0.0   :04.85 events/

    root                       S  0.0  0.0   :00.00 events/

    root                       S  0.0  0.0   :00.00 events/

    root                       S  0.0  0.0   :00.00 events_long/

    root                       S  0.0  0.0   :00.00 events_long/

    root                       S  0.0  0.0   :00.00 events_power_ef

    root                       S  0.0  0.0   :00.00 events_power_ef

    root                       S  0.0  0.0   :00.00 cgroup

    root                       S  0.0  0.0   :00.00 khelper

    root                       S  0.0  0.0   :00.00 netns

    root                       S  0.0  0.0   :00.00 async/mgr

    root                       S  0.0  0.0   :00.00 pm

    root                       S  0.0  0.0   :00.39 sync_supers

    root                       S  0.0  0.0   :00.06 bdi-default

    root                       S  0.0  0.0   :00.00 kintegrityd/

procs -----------memory---------- ---swap-- -----io---- --system-- -----cpu-----

 r  b   swpd   free   buff  cache   si   so    bi    bo   in   cs us sy id wa st

Linux 2.6.-696.3..el6.x86_64 (hlmcent69nma)  //      _x86_64_        ( CPU)

avg-cpu:  %user   %nice %system %iowait  %steal   %idle

           1.00    0.00    0.52    0.27    0.00   98.20

Device:         rrqm/s   wrqm/s     r/s     w/s   rsec/s   wsec/s avgrq-sz avgqu-sz   await r_await w_await  svctm  %util

sdc               0.00     0.00    0.00    0.00     0.03     0.00     8.02     0.00    1.88    1.88    0.00   1.88   0.00

sdb               0.00     6.55    0.01    0.08     0.09  3249.50 37296.35     0.00   13.02    0.60   14.82   0.50   0.00

sda               0.04    15.12    0.12    2.52     6.35   141.07    55.83     0.01    4.93    6.92    4.83   3.29   0.87
脚本详情如下:
#! /bin/bash

if [ $# != 2 ]; then

        echo "Invalid option, try top_monitor.sh <path> <hours>"

        exit

fi

export dir=$1

export keeps=$2

## Create topMon folder

if [ ! -d "$dir" ]; then

	mkdir $dir

fi

mkdir $dir/topMon

file=$dir/topMon/"topMon_"`date +%Y%m%d`

file=$dir/topMon/"topMon_"`date +%Y%m%d%H%M%S`

## Cleanup expired outputs

for i in `find $dir/topMon/ -type f -atime +$keeps -print`

#for i in `find $dir/topMon/ -type f -amin +$keeps -print`

do

rm -rf $i

done

## Record top ouputs

for i in {0..10}

do

date +"%Y-%m-%d %H:%M:%S" >> $file

top -b -n 1 | head -33 >> $file

vmstat >> $file

iostat -x 1 1 >> $file

sleep 5

done
Linux 性能搜集【top/vmstat/iostat】的更多相关文章
- 【Linux】系统之vmstat&iostat
Linux系统出现了性能问题,一般我们可以通过top.iostat.free.vmstat等命令来查看初步定位问题. iostat常见用法: $iostat -d -k 1 10 #查看TPS和吞吐量 ...
- linux性能调试之vmstat
linux性能监控调优工具vmstat: vmstat:用于监控.显示系统运行过程中的虚拟内存/CPU/磁盘状态. 简单示例(时间间隔2s,监控2次): 重要字段解释: r 表示运行队列(等待运行的进 ...
- Linux性能分析Top
前言 在实际开发中,有时候会收到一些服务的监控报警,比如CPU飙高,内存飙高等,这个时候,我们会登录到服务器上进行排查.本篇博客将涵盖这方面的知识:Linux性能工具. 一次线上问题排查模拟 背景:服 ...
- Linux性能分析top iostat vmstat free
最近看到一大牛的分析报告,才知道笔者认识这4个命令是多么肤浅,其实要读懂内存的信息,是要一些功力的.1.top VIRT 虚拟内存总量,VIRT=SWAP+RESSWAP ...
- Linux性能监控top及vmstat命令
监控的工具---top 第一行: 03:07:27 当前系统时间 3 days, 18:58 系统已经运行了3天18小时58分钟(在这期间没有重启过) 4 users load average: 0. ...
- Linux 性能搜集【linux_reports-cpu/memory/disks/network】
为方便问题发生后,问题原因的分析排查,我们可以在服务器中事先部署如下脚本,方便故障发生后,问题原因的分析排查 脚本部署方法: 1.将脚本[linux_reports.sh]上传到服务器 2.登陆虚拟机 ...
- Linux进程管理工具vmstat,iostat,pmap
一查看内存的工具——vmstat (一)vmstat的介绍 vmstat vmstat是Virtual Memory Statistics(虚拟内存统计)的缩写 利用vmstat命令可以对操作系统的报 ...
- Linux性能检测命令 - vmstat
一.vmstat命令描述 最常见的Linux/Unix监控工具想必是vmstat了,vmstat是Virtual Meomory Statistics(虚拟内存统计)的缩写,可以展现给定时间间隔的服务 ...
- linux性能测试命令-----top
Top命令显示了实际CPU使用情况,默认情况下,它显示了服务器上占用CPU的任务信息,并且每5秒钟刷新一次.它会显示CPU使用量.内存使用量.交换内存.缓存大小.缓冲区大小.流程PID.用户.命令等. ...
随机推荐
- 常见ie css hack
.all IE{property:value\9;} .gte IE 8{property:value\0;} .lte IE 7{*property:value;} .IE 8/9{property ...
- 小白的Python之路 day5 random模块和string模块详解
random模块详解 一.概述 首先我们看到这个单词是随机的意思,他在python中的主要用于一些随机数,或者需要写一些随机数的代码,下面我们就来整理他的一些用法 二.常用方法 1. random.r ...
- 【HTML初识】
一.BS模式 BS(Browser-Server)模式:顾名思义为浏览器-服务器的意思,对比的话类似我们PC上面浏览器使用的产品即为BS模式产品,例如google doc.各类网站等. 服务端开启一个 ...
- Python打印:九九乘法表
代码: i = 1 while i <= 9: n = 1 while n <=i: print("%d*%d=%d\t"%(n,i,i*n),end="&q ...
- 《algorithms Unlocked》读书笔记3——计数排序
<Algorithms Unlocked>是 <算法导论>的合著者之一 Thomas H. Cormen 写的一本算法基础,算是啃CLRS前的开胃菜和辅助教材.如果CLRS的厚 ...
- [Spark内核] 第30课:Master的注册机制和状态管理解密
本課主題 Master 接收 Worker, Driver, Application Master 处理 Driver 狀态变换 Master 处理 Executor 狀态变换 [引言部份:你希望读者 ...
- 如何在一个项目中同时包含mvc建站、webapi接口
项目做得多了..就会发现有些小项目不想建太多的项目..现在思明在这里和大家分享一下如果再一个项目中同时包含mvc建站以及实现webapi接口 1.新建项目 aps.net web 应用程序 2 新建模 ...
- VFS四大对象之二 struct inode
继上一篇文章:http://www.cnblogs.com/linhaostudy/p/7427027.html 二.inode结构体:(转自http://blog.csdn.net/shanshan ...
- 将控制台信息显示在前台页面的js插件
在拿出插件之前,先回顾一下apply()的用法,这里和call()做比较. JavaScript中的每一个Function对象都有一个apply()方法和一个call()方法,它们的语法分别为: /* ...
- Mac 安装 Gradle
首先下载 Gradle 通过官网进行下载 https://gradle.org 下载的文件名可能是 gradle-3.3-bin.zip 解压 将此文件解压到任意位置,如解压到 /usr/local ...