
linux(centos8):prometheus使用mtail监控错误日志
一,mtail的用途?
说明:刘宏缔的架构森林是一个专注架构的博客,地址:https://www.cnblogs.com/architectforest
对应的源码可以访问这里获取: https://github.com/liuhongdi/
说明:作者:刘宏缔 邮箱: 371125307@qq.com
二,下载mtail
https://github.com/google/mtail
[root@SearchCacheServer ~]# cd /usr/local/source/

[root@SearchCacheServer source]# mkdir mtail

[root@SearchCacheServer source]# cd mtail/

[root@SearchCacheServer mtail]# wget https://github.com/google/mtail/releases/download/v3.0.0-rc35/mtail_v3.0.0-rc35_linux_amd64
三,安装mtail
[root@SearchCacheServer mtail]# chmod 744 mtail_v3.0.0-rc35_linux_amd64
[root@SearchCacheServer mtail]# mkdir /usr/local/soft/mtail_v3.0.0-rc35_linux_amd64

[root@SearchCacheServer mtail]# mv mtail_v3.0.0-rc35_linux_amd64 /usr/local/soft/mtail_v3.0.0-rc35_linux_amd64/mtail
[root@SearchCacheServer mtail]# /usr/local/soft/mtail_v3.0.0-rc35_linux_amd64/mtail --version

mtail version v3.0.0-rc35 git revision a33283598c4b7a70fc2f113680318f29d5826cca go version go1.14 go arch amd64 go os linux
四,运行mtail
[root@SearchCacheServer phplogs]# mkdir -p /data/mtail/prog

[root@SearchCacheServer phplogs]# cd /data/mtail/prog/

[root@SearchCacheServer prog]# vi error_count.mtail
counter error_count

/ERROR/ {

  error_count++

}
说明:error_count变量值统计了包含ERROR字串的行
https://github.com/google/mtail/tree/master/examples
[root@SearchCacheServer prog]# nohup /usr/local/soft/mtail_v3.0.0-rc35_linux_amd64/mtail -logtostderr -progs /data/mtail/prog/error_count.mtail -logs /data/logs/phplogs/prd_mobile_php_errors.log &
[root@SearchCacheServer prog]# ss -lntp | grep mtail

LISTEN     0      128           *:3903         *:*      users:(("mtail",27642,11))
http://121.122.123.118:3903/
http://121.122.123.118:3903/metrics
五,配置prometheus
[root@blog ~]# cd /usr/local/soft/prometheus-2.18.1.linux-amd64/

[root@blog prometheus-2.18.1.linux-amd64]# vi prometheus.yml
  - job_name: '118mtail'

    static_configs:

    - targets: ['121.122.123.118:3903']
[root@blog prometheus-2.18.1.linux-amd64]# systemctl restart prometheus.service
http://121.122.123.47:9090/graph
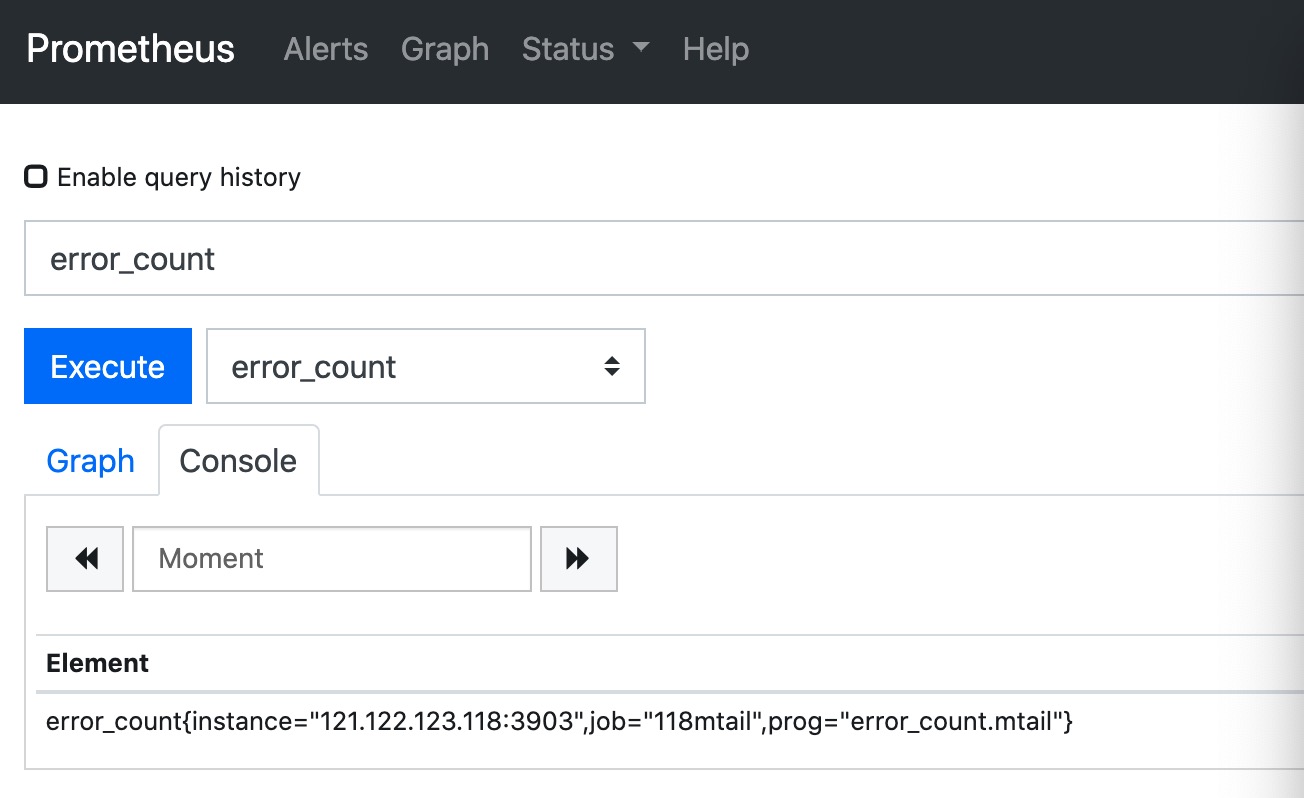
六,增加对alertmanager报警的配置
[root@blog rules]# pwd

/data/prometheus/rules

[root@blog rules]# vi rule.yml
  - alert: ErrorlogStatus # alert 名字

    expr: error_count{job="118mtail"} > 0 # 判断条件

    for: 10s # 条件保持 10s 才会发出 alter

    labels: # 设置 alert 的标签

      severity: "critical"

    annotations:  # alert 的其他标签,但不用于标识 alert

      description: php log error more than 20s

      summary: php have error
说明:error_count>0是触发报警的条件
[root@blog prometheus-2.18.1.linux-amd64]# ./promtool check config prometheus.yml

Checking prometheus.yml

  SUCCESS: 1 rule files found

Checking /data/prometheus/rules/rule.yml

  SUCCESS: 2 rules found
[root@blog prometheus-2.18.1.linux-amd64]# ./promtool check rules /data/prometheus/rules/rule.yml

Checking /data/prometheus/rules/rule.yml

  SUCCESS: 2 rules found
[root@blog rules]# systemctl restart prometheus.service
https://www.cnblogs.com/architectforest/p/13065262.html
七,查看prometheus的版本
[root@blog ~]# /usr/local/soft/prometheus-2.18.1.linux-amd64/prometheus --version

prometheus, version 2.18.1 (branch: HEAD, revision: ecee9c8abfd118f139014cb1b174b08db3f342cf)

  build user:       root@2117a9e64a7e

  build date:       20200507-16:51:47

  go version:       go1.14.2
八,查看linux的版本
[root@blog ~]# cat /etc/redhat-release

CentOS Linux release 8.0.1905 (Core)
linux(centos8):prometheus使用mtail监控错误日志的更多相关文章
- MS SQL 监控错误日志的告警信息
SQL Server的错误消息(Error Message)按照消息的严重级别一共划分25个等级,级别越高,表示严重性也越高.但是如果你统计sys.messages,你会发现,实际上只有16(SQL ...
- 2. SQL Server数据库状态监控 - 错误日志
原文:2. SQL Server数据库状态监控 - 错误日志 无论是操作系统 (Unix 或者Windows),还是应用程序 (Web 服务,数据库系统等等) ,通常都有自身的日志机制,以便故障时追溯 ...
- linux(centos8):zabbix配置邮件报警(监控错误日志)(zabbix5.0)
一,zabbix5.0发邮件报警的准备工作: zabbix5.0在linux平台上的安装:参见这一篇: https://www.cnblogs.com/architectforest/p/129125 ...
- linux(centos8):prometheus使用alertmanager发送报警邮件(prometheus 2.18.1/alertmanager 0.20.0)
一,alertmanager的用途 1,Alertmanager的作用: Alertmanager是一个独立的报警模块, 它接收Prometheus等客户端发来的警报,并通过分组.删除重复等处理, 通 ...
- Python自动监控错误日志
平时在查看日志的时候打开满屏的日志,看上去有点凌乱.于是写个Python脚本过滤出想要看的错误的日志.直接上脚本 脚本示例 def read_log(logname,keyword): tell = ...
- mtail 提取应用日志数据到时序数据库的工具-支持prometheus
mtail 是谷歌开源的一款很不错的应用日志提取工具,我们可以方便的用来提取应用的数据 到常见的监控系统(prometheus,stats,collectd,gragphite....) 说明: de ...
- 记-Windows环境下Prometheus+alertmanager+windows_exporter+mtail监控部署
1.概述 最近因项目需要统计服务的负载情况及机器的负载情况,但是项目里面却没有相关统计而服务所在的机器也没有相关的监控,因为工期原因就选择了相对轻量级的prometheus方案.其中windows_e ...
- 在Linux系统上查看Apache服务器的错误日志
错误日志和访问日志文件为系统管理员提供了有用的信息,比如,为 Web 服务器排障,保护系统不受各种各样的恶意活动侵犯,或者只是进行各种各样的分析以监控 HTTP 服务器.根据你 Web 服务器配置的不 ...
- Grafana+Prometheus通过node_exporter监控Linux服务器信息
Grafana+Prometheus通过node_exporter监控Linux服务器信息 一.Grafana+Prometheus通过node_exporter监控Linux服务器信息 1.1nod ...
随机推荐
- adb连接手机
1. 通过wifi, 利用adb来连接手机. 在pc的cmd中输入命令: adb connect 192.168.1.100 其中adb就是手机的ip. 如果连接成功, 就可以进入android的sh ...
- 论文:Show, Attend and Tell: Neural Image Caption Generation with Visual Attention-阅读总结
Show, Attend and Tell: Neural Image Caption Generation with Visual Attention-阅读总结 笔记不能简单的抄写文中的内容,得有自 ...
- JavaScript 异步编程
博客地址:https://ainyi.com/96 众所周知,JavaScript 是单线程的,但异步在 js 中很常见,那么简单来介绍一下异步编程 同步编程和异步编程 同步编程,计算机一行一行按顺序 ...
- js图形打印
1. 打印等边三角形 document.writeln("打印三角形</br>"); for(var i=0;i<5;i++){ for(var j=5;j> ...
- SSM获取SqlSessionFactory
1.实现类获取session //根据id 修改阈值 public int altThers(threshold threshold) { SqlSessionFactoryBuilder build ...
- mysql读写分离--一主多从,冗余存储
转载了https://blog.csdn.net/u013421629/article/details/78793966 https://blog.csdn.net/justdb/article/de ...
- netty学习心得1
也不是系统学习,工作需求,一点点抠的,需要自己笼统学习下. 首先功能实现: serverBootstrap.group(boss, work).channel(NioServerSocketChann ...
- How to write Chinese in LaTeX
Add the following package to the preamble. \usepackage{xeCJK} Write Chinese in your latex editor. Co ...
- Python-获取等差数列
获取等差数列思路 1. 通过range步长 2. 通过切片步长 # 通过 range series = [i for i in range(1, 101, 2)] print(series) # 通过 ...
- 安装zabbix3.0以及升级到5.0过程
关闭防火墙: systemctl stop firewalld.service systemctl disable firewalld.service 需要关闭 selinux,一定要关闭这个,开启s ...