Hexo博客中插入 Chart 动态图表
该文基本(全部)来自于chatjs中文文档
由于使用pjax,导致页面需要二次刷新才会显示表格,故引入了自动刷新的JS,但这样会导致回退标签失效
背景
今天在谷歌上逛博客时,突然发现shen-yu大佬根据chatjs写了一个Hexo插件,出于兴趣,打算使用并记录该插件的效果。
shen-yu大佬
chatjs中文文档
由于插件的安装和图表的使用上面两个链接已介绍得足够详细,本人只做一些图表的演示,并充当一个函数,实现代码的复用(手动狗头)。
图表
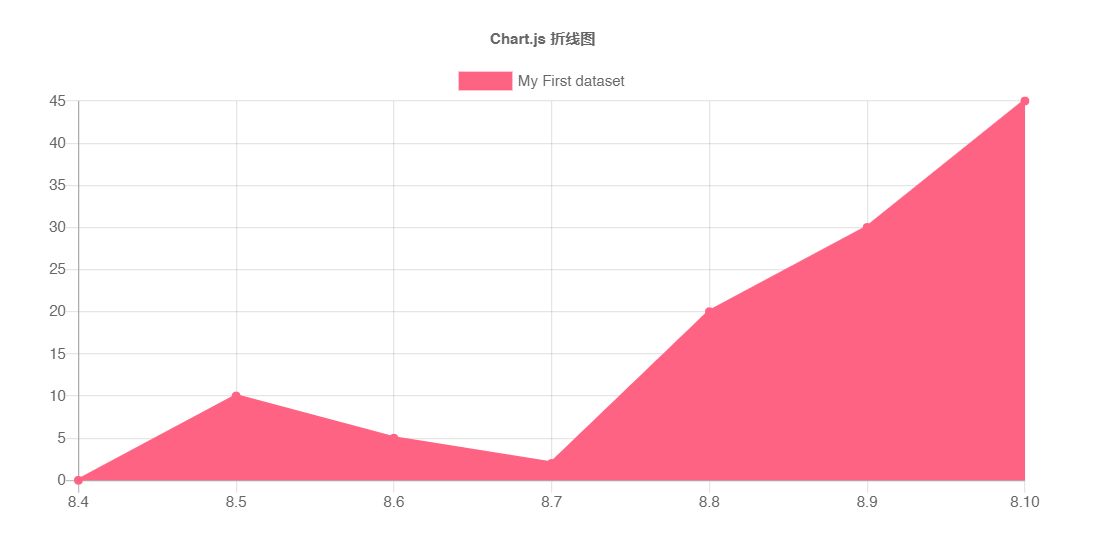
折线图
效果
示例用法
{% chart 90% 300 %}  //其中 chart 是标签名,endchart 是结束标签,不需要更改,可以通过设置 options 里面的

              aspectRatio 属性来调整图表的宽高比例,默认 width 为 100%,height 为 300px。

 {

    type: 'line',

    data: { //  折线图数据

    labels: ['8.4', '8.5', '8.6', '8.7', '8.8', '8.9', '8.10'], //  横坐标

    datasets: [{ //  纵坐标变量名称

        label: 'My First dataset',

		lineTension: 0,

        borderColor: 'rgb(255, 99, 132)', //  线条颜色

        data: [0, 10, 5, 2, 20, 30, 45] //  纵坐标

        }]

    },

    options: {

        responsive: true,

        title: {

        display: true,

        text: 'Chart.js 折线图' //  图表名称

        }

    }

}

{% endchart %}
相关属性
| 名称 | 类型 | 描述 |
|---|---|---|
backgroundColor |
Color/Color[] |
线条背景色 |
borderColor |
Color/Color[] |
线条颜色 |
borderWidth |
Number/Number[] |
线的宽度(以像素为单位) |
borderDash |
Number[] |
破折号的长度和间距。 参考 MDN |
borderDashOffset |
Number |
偏移量 参考 MDN |
borderCapStyle |
String |
线帽样式 参考 MDN |
borderJoinStyle |
String |
线连接风格 参考 MDN |
cubicInterpolationMode |
String |
离散的点之间的连接方式 |
fill |
Boolean/String |
折线区域的填充方式 |
label |
String |
在图例和工具提示中显示的数据集的标签。 |
lineTension |
Number |
贝塞尔曲线张力。设置为 0 绘制直线。如果使用单调立方插值,则忽略此选项。 |
pointBackgroundColor |
Color/Color[] |
点的填充色 |
pointBorderColor |
Color/Color[] |
点的边框色 |
pointBorderWidth |
Number/Number[] |
点边框宽度(以像素为单位) |
pointRadius |
Number/Number[] |
点的半径。如果设置为 0,则不显示。 |
pointStyle |
String/String[]/Image/Image[] |
数据点的样式 |
pointHitRadius |
Number/Number[] |
对鼠标事件作出响应的非显示点的像素大小。 |
pointHoverBackgroundColor |
Color/Color[] |
鼠标悬浮时点背景颜色。 |
pointHoverBorderColor |
Color/Color[] |
鼠标悬浮时点的边框色 |
pointHoverBorderWidth |
Number/Number[] |
鼠标悬浮时点的边框宽度 |
pointHoverRadius |
Number/Number[] |
鼠标悬浮时点的半径大小 |
showLine |
Boolean |
如果设置 false,则不会为此数据集绘制线条。 |
spanGaps |
Boolean |
如果为 true,则会在没有或为空数据的点之间绘制线条。如果为 false,则带有 NaN 数据的点会产生一个中断 |
steppedLine |
Boolean/String |
是否显示为阶梯线 |
xAxisID |
String |
绘制此数据集的 x 轴的 ID。如果未指定,则默认为第一个找到的 x 轴的 ID。 |
yAxisID |
String |
绘制该数据集的 y 轴的 ID。如果未指定,则默认为第一个找到的 y 轴的 ID。 |
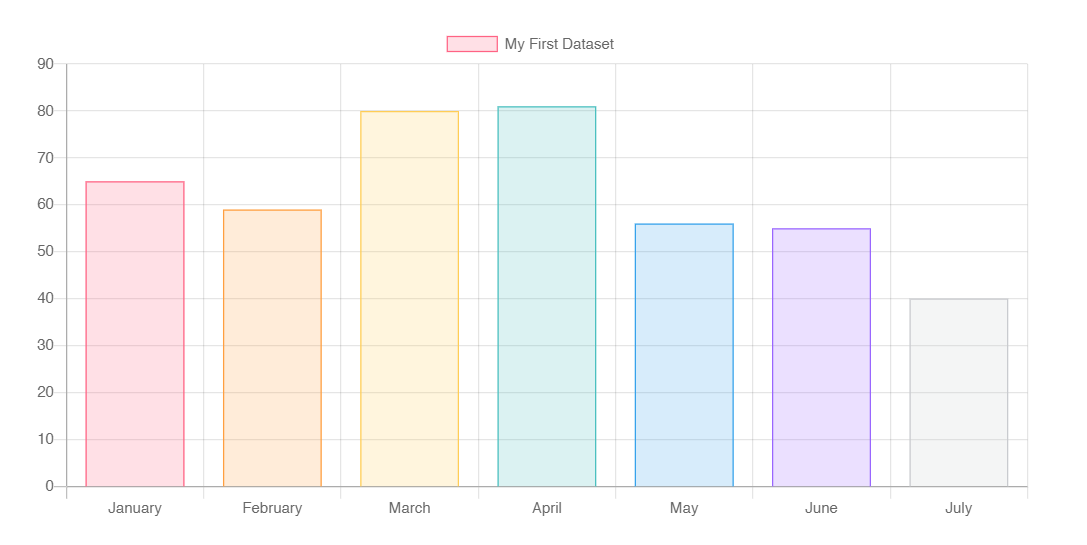
柱状图
效果·垂直柱状图
示例用法·垂直柱状图
{% chart 90% 300 %}

{

    "type":"bar",

    "data":{

        "labels":["January","February","March","April","May","June","July"],

        "datasets":[{

        "label":"My First Dataset",

        "data":[65,59,80,81,56,55,40],

        "fill":false,

        "backgroundColor":["rgba(255, 99, 132, 0.2)","rgba(255, 159, 64, 0.2)","rgba(255, 205, 86, 0.2)","rgba(75, 192, 192, 0.2)","rgba(54, 162, 235, 0.2)","rgba(153, 102, 255, 0.2)","rgba(201, 203, 207, 0.2)"],

        "borderColor":["rgb(255, 99, 132)","rgb(255, 159, 64)","rgb(255, 205, 86)","rgb(75, 192, 192)","rgb(54, 162, 235)","rgb(153, 102, 255)","rgb(201, 203, 207)"],

        "borderWidth":1

                     }]

            },

    "options":{

        "scales":{

            "yAxes":[{

                "ticks":{

                    "beginAtZero":true

                        }

                    }]

               }

            }

}

{% endchart %}
效果·水平柱状图
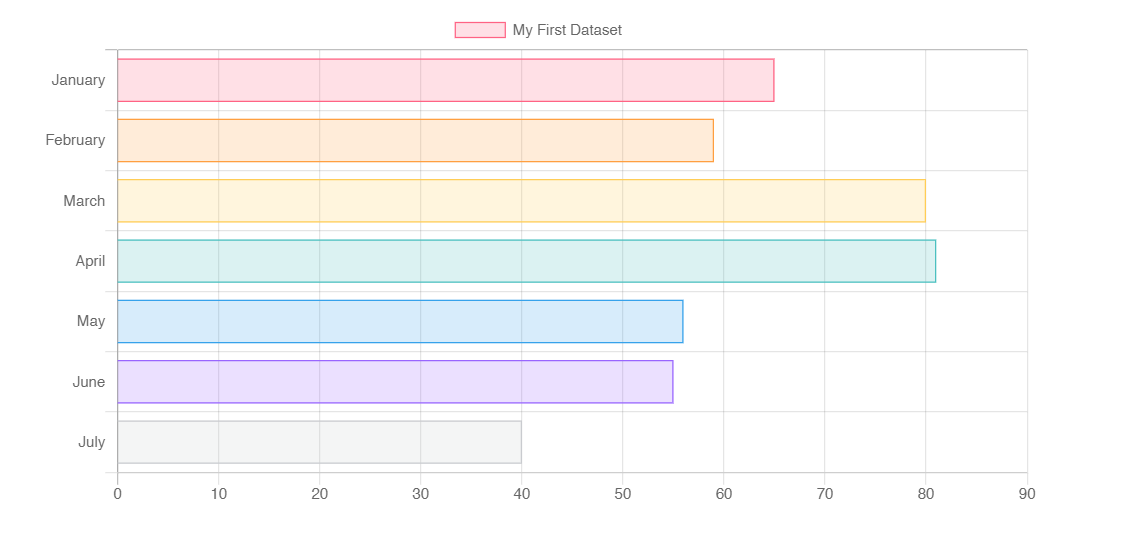
示例用法·水平柱状图
{% chart 90% 300 %}

{

    "type":"horizontalBar", //  水平柱状图

    "data":{

        "labels":["January","February","March","April","May","June","July"],

        "datasets":[{

            "label":"My First Dataset",

            "data":[65,59,80,81,56,55,40],

            "fill":false,

            "backgroundColor":["rgba(255, 99, 132, 0.2)","rgba(255, 159, 64, 0.2)","rgba(255, 205, 86, 0.2)","rgba(75, 192, 192, 0.2)","rgba(54, 162, 235, 0.2)","rgba(153, 102, 255, 0.2)","rgba(201, 203, 207, 0.2)"],

            "borderColor":["rgb(255, 99, 132)","rgb(255, 159, 64)","rgb(255, 205, 86)","rgb(75, 192, 192)","rgb(54, 162, 235)","rgb(153, 102, 255)","rgb(201, 203, 207)"],

            "borderWidth":1

        }]

    },

            "options":{

                "scales":{

                    "xAxes":[{

                        "ticks":{

                            "beginAtZero":true

                        }

                    }]

                }

            }

}

{% endchart %}
相关属性
| 名称 | 类型 | 描述 |
|---|---|---|
label |
String |
在图例和工具提示中显示的数据集标签 |
xAxisID |
String |
绘制此数据集的 x 轴的 ID。如果未指定,则默认为第一个找到的 x 轴的 ID 。 |
yAxisID |
String |
绘制该数据集的 y 轴的 ID。如果未指定,则默认为第一个找到的 y 轴的 ID。 |
backgroundColor |
Color/Color[] |
柱状/条形图填充色。 |
borderColor |
Color/Color[] |
边框色 |
borderWidth |
Number/Number[] |
边框宽度(以像素为单位) |
borderSkipped |
String |
不绘制边框 |
hoverBackgroundColor |
Color/Color[] |
悬浮时的填充色 |
hoverBorderColor |
Color/Color[] |
悬浮时的边框色 |
hoverBorderWidth |
Number/Number[] |
悬浮时边框宽度 |
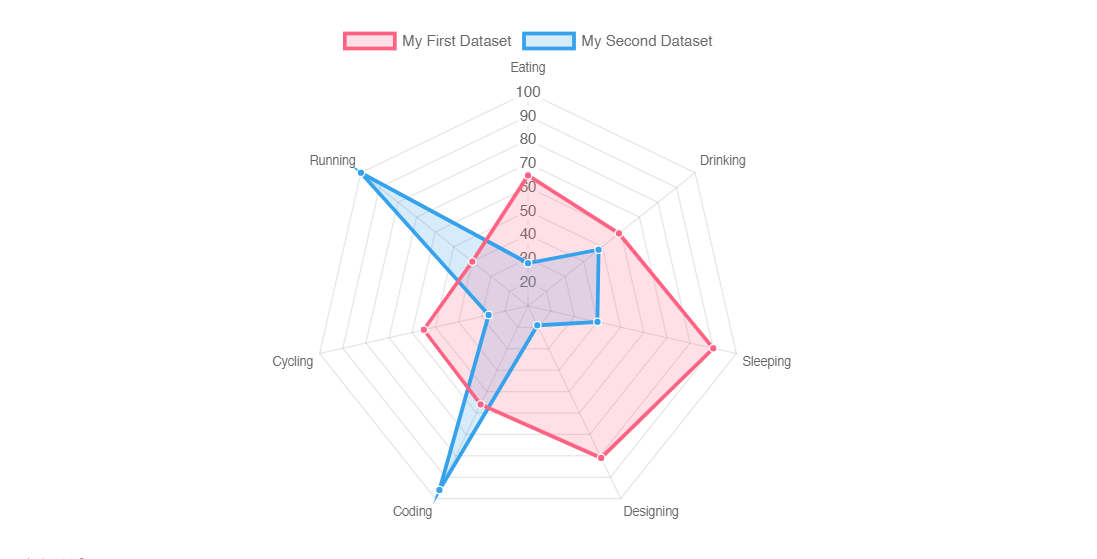
雷达图
效果
示例用法
{% chart 90% 300 %}

{

    "type":"radar",

    "data":{

        "labels":["Eating","Drinking","Sleeping","Designing","Coding","Cycling","Running"],

        "datasets":[

            {

            "label":"My First Dataset",

            "data":[65,59,90,81,56,55,40],

            "fill":true,

            "backgroundColor":"rgba(255, 99, 132, 0.2)",

            "borderColor":"rgb(255, 99, 132)",

            "pointBackgroundColor":"rgb(255, 99, 132)",

            "pointBorderColor":"#fff",

            "pointHoverBackgroundColor":"#fff",

            "pointHoverBorderColor":"rgb(255, 99, 132)"

        },

            {

                "label":"My Second Dataset",

                "data":[28,48,40,19,96,27,100],

                "fill":true,

                "backgroundColor":"rgba(54, 162, 235, 0.2)",

                "borderColor":"rgb(54, 162, 235)",

                "pointBackgroundColor":"rgb(54, 162, 235)",

                "pointBorderColor":"#fff",

                "pointHoverBackgroundColor":"#fff",

                "pointHoverBorderColor":"rgb(54, 162, 235)"

            }

        ]

    },

                "options":{

                    "elements":{

                        "line":{

                            "tension":0,

                            "borderWidth":3

                        }

                    }

                }

}

{% endchart %}
相关属性
| 名称 | 类型 | 描述 |
|---|---|---|
label |
String |
图例和工具提示中的数据集的标签名 |
backgroundColor |
Color/Color[] |
填充色 |
borderColor |
Color/Color[] |
线的颜色 |
borderWidth |
Number/Number[] |
线宽度(以像素为单位) |
borderDash |
Number[] |
破折号的长度和间距 参考 MDN |
borderDashOffset |
Number |
偏移量 参考 MDN |
borderCapStyle |
String |
线冒样式 参考 MDN |
borderJoinStyle |
String |
Line joint 样式 参考 MDN |
fill |
Boolean/String |
区域填充色 |
lineTension |
Number |
贝塞尔曲线张力。0 为直线。 |
pointBackgroundColor |
Color/Color[] |
数据点填充色 |
pointBorderColor |
Color/Color[] |
数据点边框色 |
pointBorderWidth |
Number/Number[] |
数据点边框宽度(以像素为单位) |
pointRadius |
Number/Number[] |
数据点半径。0 为不显示点 |
pointStyle |
String/String[]/Image/Image[] |
数据点样式 |
pointHitRadius |
Number/Number[] |
对鼠标事件作出响应的非显示点的像素大小。 |
pointHoverBackgroundColor |
Color/Color[] |
鼠标悬浮时,数据点背景颜色 |
pointHoverBorderColor |
Color/Color[] |
鼠标悬浮时,数据点边框色 |
pointHoverBorderWidth |
Number/Number[] |
鼠标悬浮时数据点的边框宽度 |
pointHoverRadius |
Number/Number[] |
鼠标悬停时,数据点的半径大小 |
环状/饼状图
效果·环状图
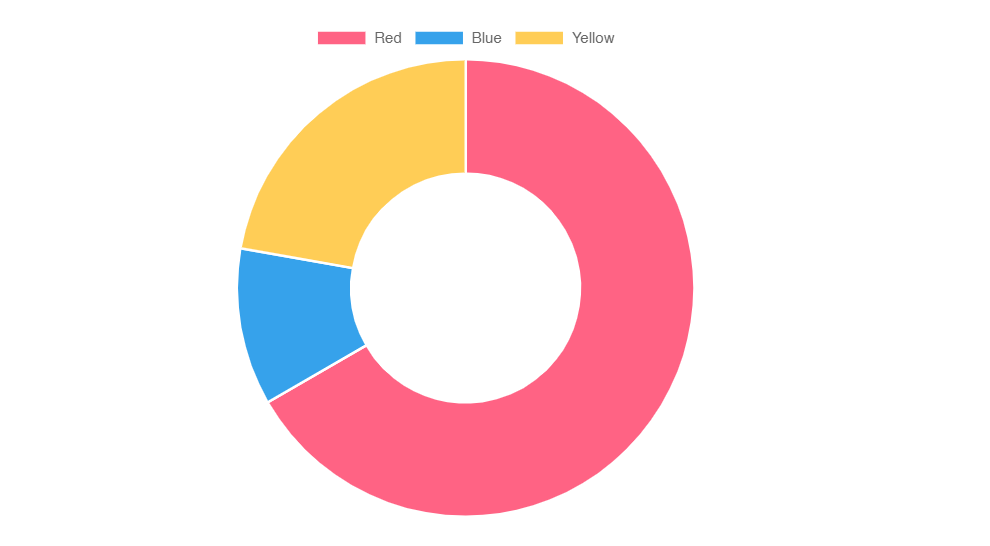
示例用法·环状图
{% chart 90% 300 %}

{

    "type":"doughnut",

    "data":{

        "labels":["Red","Blue","Yellow"],

        "datasets":[

            {

                "label":"My First Dataset",

                "data":[300,50,100],

                "backgroundColor":["rgb(255, 99, 132)","rgb(54, 162, 235)","rgb(255, 205, 86)"]

            }

        ]

    }

}

{% endchart %}
效果·饼状图
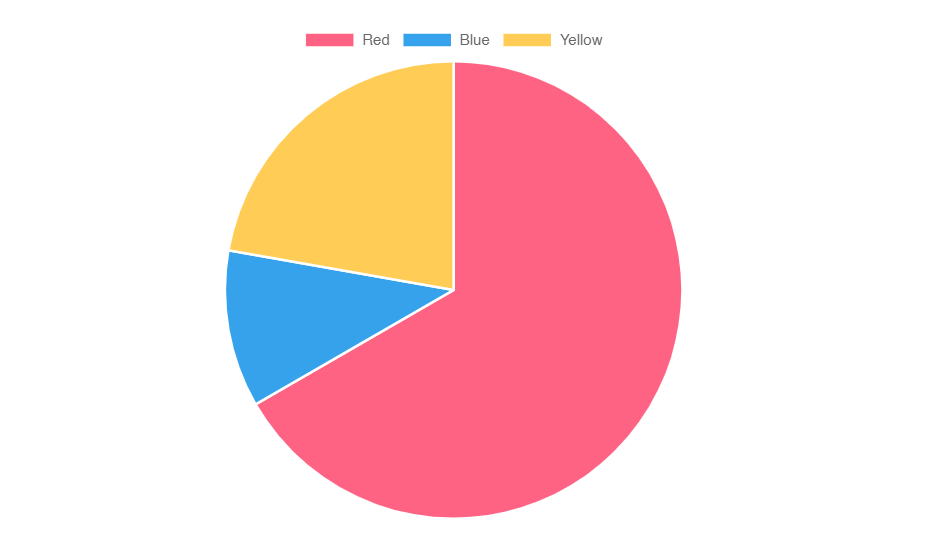
示例用法·饼状图
{% chart 90% 300 %}

{

    "type":"pie",

    "data":{

        "labels":["Red","Blue","Yellow"],

        "datasets":[

            {

                "label":"My First Dataset",

                "data":[300,50,100],

                "backgroundColor":["rgb(255, 99, 132)","rgb(54, 162, 235)","rgb(255, 205, 86)"]

            }

        ]

    }

}

{% endchart %}
相关属性
| 名称 | 类型 | 描述 |
|---|---|---|
label |
String |
图例和提示中显示的标签名 |
backgroundColor |
Color[] |
数据集中每个数据区域的填充色 |
borderColor |
Color[] |
边框色 |
borderWidth |
Number[] |
边框宽度 |
hoverBackgroundColor |
Color[] |
鼠标悬浮时的填充色 |
hoverBorderColor |
Color[] |
鼠标悬浮时边框色 |
hoverBorderWidth |
Number[] |
鼠标悬浮时边框宽度 |
| 名称 | 类型 | 默认值 | 描述 |
|---|---|---|---|
cutoutPercentage |
Number |
50 - for doughnut, 0 - for pie |
从中间切出的图表的百分比。 |
rotation |
Number |
-0.5 * Math.PI |
起始角度 |
circumference |
Number |
2 * Math.PI |
允许图形覆盖 |
animation.animateRotate |
Boolean |
true |
如果为 true,则图表将使用旋转动画进行动画。该属性在options.animation对象中。 |
animation.animateScale |
Boolean |
false |
如果为 true,则将动画从中心向外缩放图表。 |
极地图
效果
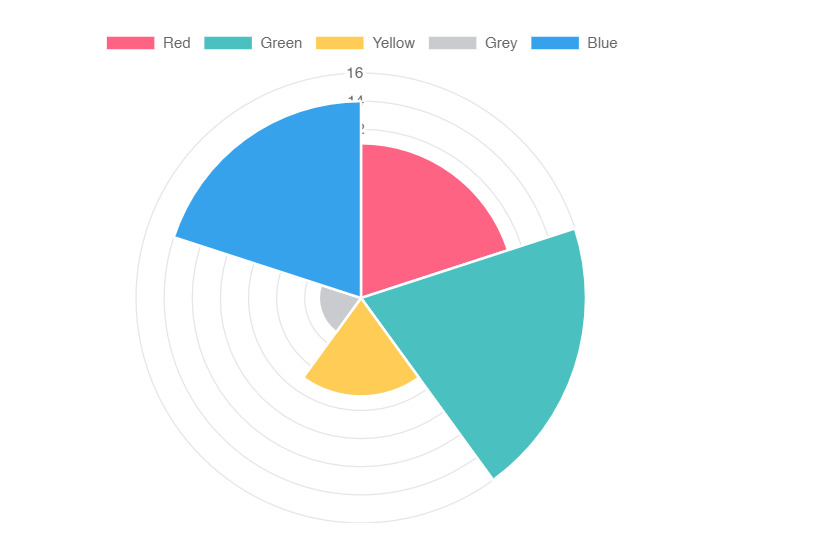
示例用法
{% chart 90% 300 %}

{

    "type":"polarArea",

    "data":{

        "labels":["Red","Green","Yellow","Grey","Blue"],

        "datasets":[

            {

                "label":"My First Dataset",

                "data":[11,16,7,3,14],

                "backgroundColor":["rgb(255, 99, 132)","rgb(75, 192, 192)","rgb(255, 205, 86)","rgb(201, 203, 207)","rgb(54, 162, 235)"]

            }

        ]

    }

}

{% endchart %}
相关属性
| 名称 | 类型 | 描述 |
|---|---|---|
label |
String |
在图例和工具提示中要显示数据集的标签 |
backgroundColor |
Color[] |
填充色 |
borderColor |
Color[] |
边框色 |
borderWidth |
Number[] |
边框宽度 |
hoverBackgroundColor |
Color[] |
鼠标悬浮时背景色 |
hoverBorderColor |
Color[] |
鼠标悬浮时边框色 |
hoverBorderWidth |
Number[] |
鼠标悬浮时边框宽度 |
气泡图
效果
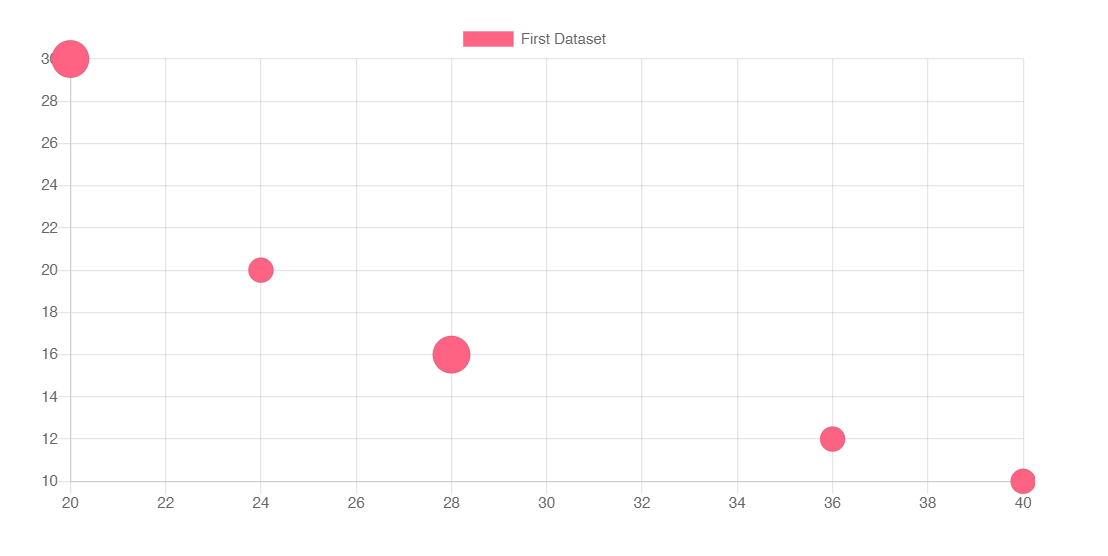
示例用法
{% chart 90% 300 %}

{

    "type":"bubble",

    "data":{

        "datasets":[

            {

                "label":"First Dataset",

                "data":[

                    {"x":20,"y":30,"r":15},{"x":40,"y":10,"r":10},{"x":24,"y":20,"r":10},{"x":28,"y":16,"r":15},{"x":36,"y":12,"r":10}

                ],

                    "backgroundColor":"rgb(255, 99, 132)"

            }

        ]

    }

}

{% endchart %}
相关属性
| 名称 | 类型 | 可脚本化 | 可索引 | 默认值 |
|---|---|---|---|---|
backgroundColor |
Color |
Yes | Yes | 'rgba(0,0,0,0.1)' |
borderColor |
Color |
Yes | Yes | 'rgba(0,0,0,0.1)' |
borderWidth |
Number |
Yes | Yes | 3 |
data |
Object[] |
- | - | required |
hoverBackgroundColor |
Color |
Yes | Yes | undefined |
hoverBorderColor |
Color |
Yes | Yes | undefined |
hoverBorderWidth |
Number |
Yes | Yes | 1 |
hoverRadius |
Number |
Yes | Yes | 4 |
hitRadius |
Number |
Yes | Yes | 1 |
label |
String |
- | - | undefined |
pointStyle |
String |
Yes | Yes | circle |
radius |
Number |
Yes | Yes | 3 |
每个气泡的风格可以通过以下属性进行控制:
| 名称 | 描述 |
|---|---|
backgroundColor |
七宝背景色 |
borderColor |
气泡边框色 |
borderWidth |
气泡边框宽度 (以像素为单位) |
pointStyle |
气泡形状样式 |
radius |
气泡半径(以像素为单位) |
散点图
效果
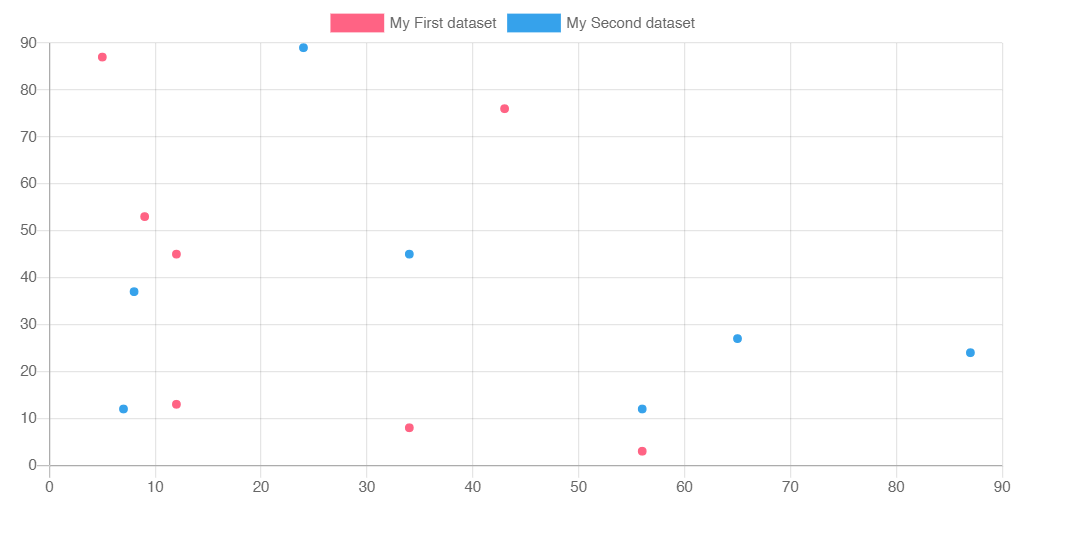
示例用法
{% chart 90% 300 %}

{

    type:'scatter',

    data:{

        labels:['January','February','March','April','May','June','July'],

        datasets:[

            {

                label:'My First dataset',

                borderColor:'rgb(255, 99, 132)',

                backgroundColor:'rgb(255, 99, 132)',

                data:[

                    {x:12,y:45,},{x:12,y:13,},{x:56,y:3,},{x:5,y:87,},{x:43,y:76,},{x:34,y:8,},{x:9,y:53,}

                ]

                },

            {

                label:'My Second dataset',

                borderColor:'rgb(54, 162, 235)',

                backgroundColor:'rgb(54, 162, 235)',

                data:[

                    {x:56,y:12,},{x:7,y:12,},{x:87,y:24,},{x:34,y:45,},{x:65,y:27,},{x:8,y:37,},{x:24,y:89,}

                ]

            }

        ],

        options:{

            title:{

                display:true,

                text:'Chart.js Scatter Chart'

            },

        }

    }

}

{% endchart %}
相关属性
| 名称 | 类型 | 描述 |
|---|---|---|
borderColor |
Color/Color[] |
点颜色 |
borderWidth |
Number/Number[] |
线的宽度(以像素为单位) |
borderDash |
Number[] |
破折号的长度和间距。 参考 MDN |
borderDashOffset |
Number |
偏移量 参考 MDN |
borderCapStyle |
String |
线帽样式 参考 MDN |
borderJoinStyle |
String |
线连接风格 参考 MDN |
cubicInterpolationMode |
String |
离散的点之间的连接方式 |
fill |
Boolean/String |
折线区域的填充方式 |
label |
String |
在图例和工具提示中显示的数据集的标签。 |
lineTension |
Number |
贝塞尔曲线张力。设置为 0 绘制直线。如果使用单调立方插值,则忽略此选项。 |
pointBackgroundColor |
Color/Color[] |
点的填充色 |
pointBorderColor |
Color/Color[] |
点的边框色 |
pointBorderWidth |
Number/Number[] |
点边框宽度(以像素为单位) |
pointRadius |
Number/Number[] |
点的半径。如果设置为 0,则不显示。 |
pointStyle |
String/String[]/Image/Image[] |
数据点的样式 |
pointHitRadius |
Number/Number[] |
对鼠标事件作出响应的非显示点的像素大小。 |
pointHoverBackgroundColor |
Color/Color[] |
鼠标悬浮时点背景颜色。 |
pointHoverBorderColor |
Color/Color[] |
鼠标悬浮时点的边框色 |
pointHoverBorderWidth |
Number/Number[] |
鼠标悬浮时点的边框宽度 |
pointHoverRadius |
Number/Number[] |
鼠标悬浮时点的半径大小 |
showLine |
Boolean |
如果设置 false,则不会为此数据集绘制线条。 |
spanGaps |
Boolean |
如果为 true,则会在没有或为空数据的点之间绘制线条。如果为 false,则带有 NaN 数据的点会产生一个中断 |
steppedLine |
Boolean/String |
是否显示为阶梯线 |
xAxisID |
String |
绘制此数据集的 x 轴的 ID。如果未指定,则默认为第一个找到的 x 轴的 ID。 |
yAxisID |
String |
绘制该数据集的 y 轴的 ID。如果未指定,则默认为第一个找到的 y 轴的 ID。 |
区域图
效果
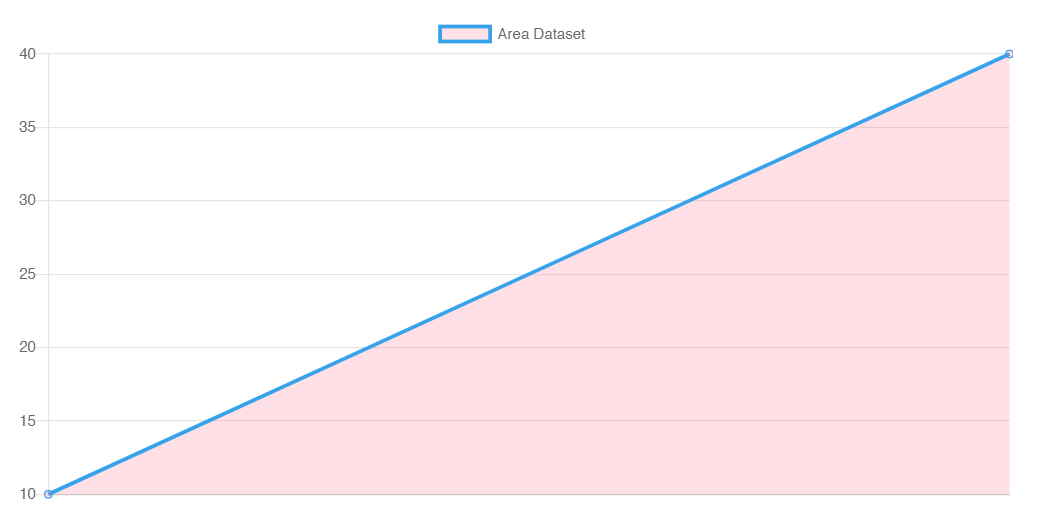
示例用法
{% chart 90% 300 %}

{

    "type":"line",

    "data":{

        "datasets":[

            {

                "label":"Area Dataset",

                "data":[10,40],

                "fill":1, //  填充--->区域图

                "borderColor":"rgb(54, 162, 235)",

                "backgroundColor":"rgba(255, 99, 132, 0.2)",

                "fill":"origin"

            },

        ]

    }

}

{% endchart %}
相关属性
| 模式 | 类型 | 值 |
|---|---|---|
| 绝对数据集索引 1 | Number |
1, 2, 3, ... |
| 相对数据集索引 1 | String |
'-1', '-2', '+1', ... |
| 边界 2 | String |
'start', 'end', 'origin' |
| 禁用 3 | Boolean |
false |
混合图表
效果
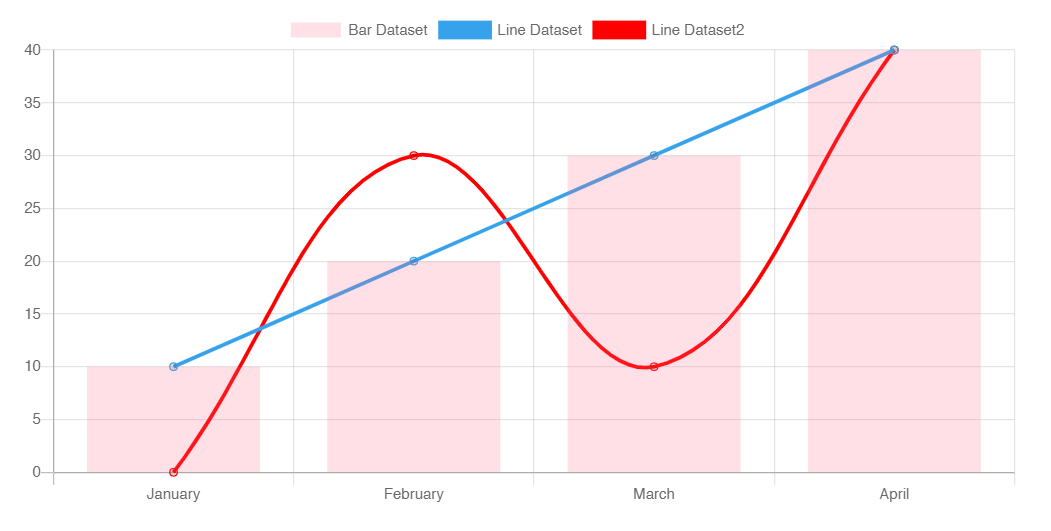
示例用法
{% chart 90% 300 %}

{

    "type":"bar",

    "data":{

        "labels":["January","February","March","April"],

        "datasets":[

            {

                "label":"Bar Dataset",

                "data":[10,20,30,40],

                "borderColor":"rgb(255, 99, 132)",

                "backgroundColor":"rgba(255, 99, 132, 0.2)"

            },

            {

                "label":"Line Dataset",

                "data":[10,20,30,40],

                "type":"line",

                "fill":false,

                "borderColor":"rgb(54, 162, 235)",

            },

            {

                "label":"Line Dataset2",

                "data":[0,30,10,40],

                "type":"line",

                "fill":false,

                "borderColor":"rgb(255, 0, 0)",

            }

        ]

    },

    "options":{

        "scales":{

            "yAxes":[

                {

                    "ticks":{

                        "beginAtZero":true

                    }

                }

            ]

        }

    }

}

{% endchart %}
相关属性
注意运用的Chart各自的属性即可。
申明
文章基本转自
shen-yu大佬{% btn 'https://shen-yu.gitee.io/2020/chartjs/',shen-yu,far fa-hand-point-right,green larger %}
chatjs中文文档{% btn 'https://chartjs.bootcss.com/docs/getting-started/installation.html',chatjs,far fa-hand-point-right,blue larger %},并非原创,本人只是进行了总结和排版。
Hexo博客中插入 Chart 动态图表的更多相关文章
- hexo博客如何插入图片
Hexo是一个静态的博客网站生成器,生成一个博客只需要分分钟的时间就能搞定. Hexo的博文是支持Markdown格式的,发表一篇文章只需要简简单单的几个命令. hexo new '文章'就会生成一个 ...
- 使用Scribefire在博客中插入语法高亮
效果如下, 文字1 int cool void main() { cout<<"hello world!"<<endl } 文字2 经过一番折腾,终于搞定了 ...
- 如何在hexo博客中在线阅读pdf
前言 有一些资料或者笔记是pdf版本的,如果想要放在博客中进行阅读,那么就得将其转换为markdown格式或者html格式.但是这样转换后,其原pdf的格式就会混乱了,排版将会变得很困难,不过一山更比 ...
- 如何在博客中插入jsfiddle的代码
1.进入官网:https://jsfiddle.net/ 可以看到如下界面,顶端的控制按钮包括:保存,运行,代码格式化等: 2.将html.css.js分别写在指定的位置当中,最后一个框result是 ...
- 使用Scribefire在博客中插入语法高亮 II
效果如下, 这是我们在Scribefire中添加的code按钮,单击此按钮,则会出现 在codeHere中直接输入代码就可以了. 查看html 可以看到,其中已经添加了<pre>标签. 下 ...
- 手把手教你在CSDN博客中插入图片之剑走偏锋系列
1.在博客园注册账号.你没有看错,就是博客园,在图像上传方面博客园比CSDN这个垃圾强太多了. 2.在博客园进入随笔撰写编辑模块,点击上传图像按钮(点最黄的那个,别点错了). 3.弹出如下窗口 ,点击 ...
- Hexo博客插入图片的方法
Hexo博客插入图片的方法 hexo图片blog hexo blog 插入图片的方法总结 hexo 的blog 内容是根据 markdown 文件的内容生成的html文件, 生成的文件全部在 /pub ...
- hexo博客MathJax公式渲染问题
这个问题自己很早以前便碰到了,用MathJax语法写的一些公式,在本地Markdown编译器上渲染是没问题的,可是部署到hexo博客中就出现问题了,之前我是使用图片代替公式应付过去了,今天从网上找了一 ...
- Hexo博客(Snail主题)搭建回顾概览
Hexo博客(Snail主题)搭建回顾概览 笔者搭建博客地址:https://saltyfishyjk.github.io 目录 Hexo博客(Snail主题)搭建回顾概览 Part 0 前言 写作背 ...
随机推荐
- Ethical Hacking - Web Penetration Testing(6)
REMOTE FILE INCLUSION Similar to local file inclusion. But allows an attacker to read ANY file from ...
- GPO - General GPO Settings(1)
Prohibit access to Control Panel and PC settings Disable GPO for Administrators and /or User Groups ...
- Asp.Net Core 附加进程调试
第一种:VS调试 vs打开项目,F5启动调试 第二种:附加到w3wp.exe进程调试 一.安装NET Core Windows Server Hosting软件包 安装 .NET Core 托管捆绑包 ...
- SQL order by语句
关于order by: order by 语句用于根据指定的列对结果集进行排序,默认按照升序排列. 1. select 字段名 from 表名 where 条件 order by 字段名1 asc/ ...
- 用windbg查看dmp文件,定位bug位置
windbg + .dmp + .pdb + 源代码,可以看到是哪个代码崩溃的 设置符号文件所在路径 File->Symbol File Path... 在输入框中填入.pdb文件所在的文件夹路 ...
- vue学习(三) v-bind指令
//html <div id="app"> <input type="button" value="ok" v-bind: ...
- ASP.NET WebAPI2复杂请求跨域设置
ASP.Net Core的跨域设置比较简单 官方都整合了 具体的参见微软官方文档: https://docs.microsoft.com/zh-cn/aspnet/core/security/cor ...
- Promise对象 异步编程
Promise 的含义 Promise 是异步编程的一种解决方案,比传统的解决方案——回调函数和事件——更合理和更强大.所谓Promise,简单说就是一个容器,里面保存着某个未来才会结束的事件(通常是 ...
- html中input提示文字样式修改
在很多网站上我们都看到input输入框显示提示文字,让我们一起来看看如果在input输入框中显示提示文字.我们只需要在<input>标签里添加:placeholder="提示文字 ...
- filter 函数基本写法
filter 返回一个符合要求的元素所构成的新列表 filter(函数,可迭代对象) map 和 filter 混合使用将 lst_num 中为偶数的取出来进行加2 和 乘2 操作 2020- ...