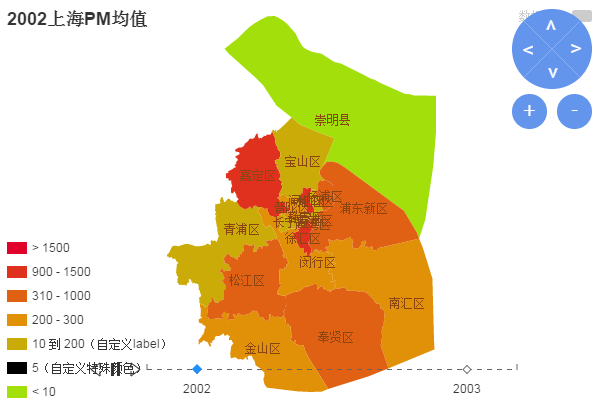
echarts实现上海地域PM值(map、timeline)
<!doctype html>

<html>

<head>

    <meta charset="utf-8">

    <title>echarts图形插件使用</title>

<script src="jquery.min.js"></script>

<script src="http://s1.bdstatic.com/r/www/cache/ecom/esl/2-0-8/esl.js"></script>

 </head>

<body>

    <div id="main" style="height:400px;"></div>

    <script type="text/javascript">

    // 路径配置

        require.config({

             packages: [{

            name: 'echarts',

            location: 'echarts/src',

            main: 'echarts'},

        {name: 'zrender',

            location: 'echarts/zrender/src', // zrender与echarts在同一级目录

            main: 'zrender'

        }

    ]

        });

        require(

            [

                'echarts',

                'echarts/chart/map' // 使用柱状图就加载bar模块,按需加载

            ],

             function (echarts) {

                 var myChart = echarts.init(document.getElementById('main'));

                var option = {

                    timeline:{

                        data:[

                            '2002-01-01','2003-01-01'

                        ],

                        label : {

                            formatter : function(s) {

                                return s.slice(0, 4);

                            }

                        },

                        autoPlay : true,

                        playInterval : 1000

                    },

            options:[

            {

                title: {

            text : '上海地图',

            subtext : '-。-'

        },

        tooltip : {

            trigger: 'item',

            formatter: function(a){

                return a[2];

            }

        },

        legend: {

            orient: 'vertical',

            x:'right',

            data:['数据名称']

        },

        dataRange: {

        x: 'left',

        y: 'bottom',

        splitList: [

            {start: 1500},

            {start: 900, end: 1500},

            {start: 310, end: 1000},

            {start: 200, end: 300},

            {start: 10, end: 200, label: '10 到 200(自定义label)'},

            {start: 5, end: 5, label: '5(自定义特殊颜色)', color: 'black'},

            {end: 10}

        ],

        color: ['#E0022B', '#E09107', '#A3E00B']

         },

         roamController: {

            show: true,

            x: 'right',

            mapTypeControl: {

                '上海': true

            }

        },

        title : {'text':'2002上海PM均值'},

        series : [

            {

                type:'map',

                mapType: '上海',

                //'selectedMode' : 'single',

                selectedMode : 'single',

                itemStyle:{

                    normal:{label:{show:true}},

                    emphasis:{label:{show:true}}

                },

                'data': [{name: '崇明县',value: Math.round(Math.random()*1000)},

            {name: '宝山区',value: Math.round(Math.random()*1000)},

            {name: '嘉定区',value: Math.round(Math.random()*1000)},

            {name: '青浦区',value: Math.round(Math.random()*1000)},

            {name: '杨浦区',value: Math.round(Math.random()*1000)},

            {name: '虹口区',value: Math.round(Math.random()*1000)},

            {name: '闸北区',value: Math.round(Math.random()*1000)},

            {name: '普陀区',value: Math.round(Math.random()*1000)},

            {name: '静安区',value: Math.round(Math.random()*1000)},

            {name: '黄浦区',value: Math.round(Math.random()*1000)},

            {name: '卢湾区',value: Math.round(Math.random()*1000)},

            {name: '长宁区',value: Math.round(Math.random()*1000)},

            {name: '徐汇区',value: Math.round(Math.random()*1000)},

            {name: '浦东新区',value: Math.round(Math.random()*1000)},

            {name: '松江区',value: Math.round(Math.random()*1000)},

            {name: '闵行区',value: Math.round(Math.random()*1000)},

            {name: '金山区',value: Math.round(Math.random()*1000)},

            {name: '奉贤区',value: Math.round(Math.random()*1000)},

            {name: '南汇区',value: Math.round(Math.random()*1000)}]

            }

        ]

        },

        {

            title : {'text':'2003上海PM均值'},

            series : [

                {'data': [{name: '崇明县',value: Math.round(Math.random()*1000)},

            {name: '宝山区',value: Math.round(Math.random()*1000)},

            {name: '嘉定区',value: Math.round(Math.random()*1000)},

            {name: '青浦区',value: Math.round(Math.random()*1000)},

            {name: '杨浦区',value: Math.round(Math.random()*1000)},

            {name: '虹口区',value: Math.round(Math.random()*1000)},

            {name: '闸北区',value: Math.round(Math.random()*1000)},

            {name: '普陀区',value: Math.round(Math.random()*1000)},

            {name: '静安区',value: Math.round(Math.random()*1000)},

            {name: '黄浦区',value: Math.round(Math.random()*1000)},

            {name: '卢湾区',value: Math.round(Math.random()*1000)},

            {name: '长宁区',value: Math.round(Math.random()*1000)},

            {name: '徐汇区',value: Math.round(Math.random()*1000)},

            {name: '浦东新区',value: Math.round(Math.random()*1000)},

            {name: '松江区',value: Math.round(Math.random()*1000)},

            {name: '闵行区',value: Math.round(Math.random()*1000)},

            {name: '金山区',value: Math.round(Math.random()*1000)},

            {name: '奉贤区',value: Math.round(Math.random()*1000)},

            {name: '南汇区',value: Math.round(Math.random()*1000)}]}

            ]

        }

        ]

            };

                myChart.setOption(option);

            }

    );

    </script>

</body>

</html>
echarts实现上海地域PM值(map、timeline)的更多相关文章
- MyBatis查询,返回值Map或List<Map>
一.返回值Map 1.mapper.xml <select id="selectUserMapLimitOne" resultType="java.util.Has ...
- Map获取键值,Map的几种遍历方法
Map 类提供了一个称为entrySet()的方法,这个方法返回一个Map.Entry实例化后的对象集.接着,Map.Entry类提供了一个 getKey()方法和一个getValue()方法,Map ...
- 三角形的优雅值(map和哈希表)
给你 n 个三角形,每个三角形有一个优雅值,然后给出一个询问,每次询问一个三角形,求与询问的三角形,相似的三角形中的优雅值最大是多少.★数据输入第一行输入包括 n 一个数字,接下来 n 行,每行四个整 ...
- map(froeach改变值,map生成新数组)
http://www.365mini.com/page/jquery-map.htm <input id="n1" name="uid" type=&qu ...
- 获取Echarts的DataZoom的起始值
创建DataZoom拖动事件 myChart.on(ecConfig.EVENT.DATA_ZOOM, eConsole); //事件名, 相关联的方法名 var ecConfig = requi ...
- Map获取键值,Map的几种遍历方法 (转载)
Map类提供了一个称为entrySet()的方法,这个方法返回一个Map.Entry实例化后的对象集.接着,Map.Entry类提供了一个getKey()方法和一个getValue()方法,Map.E ...
- 我为什么选择使用Go语言?
谢孟军:EGO会员.GopherChina组织者.<Go Web编程>一书的作者,专注Golang技术架构.本文来自EGO会员群分享,入群方式见文末 在这里我主要想和大家分享一些Go和我个 ...
- 取出List<Map<String,Object>>里面Map的key:value值
1.取出Map其中一个属性的值 Map map = new HashMap(); map.put("key1", "value1"); map.put(&quo ...
- Map和List集合嵌套取值
遍历List的方法: List<User> list = new ArrayList();list = userMapper.getUserList();//从数据库取得list值for( ...
随机推荐
- Android 打开系统最近任务及最近应用方法
Class serviceManagerClass; try { serviceManagerClass = Class.forName("android.os.ServiceManager ...
- send()和recv()函数详解
send()函数 int send( SOCKET s, const char FAR *buf, int len, int flags ); 不论是客户还是服务器应用程序都用send函数来向TCP连 ...
- Android Studio 打包流程
(1)Android Studio菜单Build->Generate Signed APK (2)弹出窗口 (3)创建密钥库及密钥,创建后会自动选择刚创建的密钥库和密钥(已拥有密钥库跳过) ...
- WCF 启用multipleSiteBindingsEnabled 情况下报终结点地址错误
报错信息如下: Server Error in '/MyWcfService' Application. When 'system.serviceModel/serviceHostingEnviron ...
- [WPF]解决ListView在没有Items时,水平滚动条不出现的问题
转载地址:http://www.cnblogs.com/nankezhishi/archive/2010/03/19/FixListViewNotScrollHeaderBug.html 在上一篇Bl ...
- PixelFormat 图像颜色的数据格式
PixelFormat: (指定图像中每个像素的颜色数据的格式) Delphi 微软 ...
- ajax缺点以及解决办法
1.缺少一个没有标准之争.没有back和history的浏览器 Ajax取消了back按钮,即对浏览器后退机制的破坏.后退按钮是一个标准的web站点的重要功能,但是它没法和js进行很好的合作,这 ...
- logstash 根据type 判断输出
# 更多ELK资料请访问 http://devops.taobao.com 一.配置前需要注意: 1.Use chmod to modify nginx log file privilege. E.g ...
- 中国市场 Android App 兼容性报告
由于手机操作系统的不同,以及操作系统版本之间的差异,使得真机测试这个过程尤其复杂,涉及终端.人员.工具.时间.管理等方面的问题,Android系统的设备因操作系统多样性和终端类型的庞杂,问题尤为复 ...
- VS2015 开发人员命令提示,如何实现记事本编程
开始,选择VS2015 开发人员命令提示,打开 找到.c文件的位置,复制位置 在VS2015 开发人员命令提示, 输入cd 位置 回车 然后输入cl 文件名 回车 这样进行编译