day18-常用模块III (numpy、pandas、matplotlib)
numpy模块
计算速度快,提供了数组操作、数组运算、以及统计分布和简单的数学模型,用来存储和处理大型矩阵
创建矩阵
创建一维矩阵
import numpy as np

np.array([1,2,3])    # 一维数组
array([1, 2, 3])
创建二维矩阵
np.array([[1,2,3],[4,5,6]]) # 二维数组
array([[1, 2, 3],

       [4, 5, 6]])
创建三维矩阵
np.array([[[1,2,3],[4,5,6]],[[3,2,1],[6,5,4]]]) # 三维数组
array([[[1, 2, 3],

        [4, 5, 6]],

       [[3, 2, 1],

        [6, 5, 4]]])
获取矩阵的行列数
arr = np.array([[1,2,3],[4,5,6]])

arr.shape  # 获取多维数组的行和列
(2, 3) # 矩阵的行arr.shape[0],矩阵的列arr.shape[1]
切割矩阵
切分矩阵类似于列表的切割,但是与列表的切割不同的是,矩阵的切割涉及到行和列的切割,但是两者切割的方式都是从索引0开始,并且取头不取尾。
arr[1,2] # 取第二行第三列的元素
6
arr[0,:] # 取第一行的元素
array([1, 2, 3])
arr[:,1] # 取第二列的元素
array([2, 5])
arr[arr>3] # 取大于3的元素,返回一个数组
array([4, 5, 6])
矩阵元素替换
矩阵元素的替换,类似于列表元素的替换,并且矩阵也是一个可变类型的数据,即如果对矩阵进行替换操作,会修改原矩阵的元素
arr[0,:]=0  # 将第一行的元素赋值为0

arr
array([[0, 0, 0],

       [4, 5, 6]])
arr[1,1] = 1  # 将第二行第二列元素赋值为1

arr
array([[0, 0, 0],

       [4, 1, 6]])
矩阵的合并
arr1 = np.array([[1,2,5],[1,7,2]])

arr2 = np.array([[3,4,2],[1,0,1]])

print(arr1)

print(arr2)
[[1 2 5]

 [1 7 2]]

[[3 4 2]

 [1 0 1]]
np.vstack((arr1,arr2)) # 合并两个矩阵的列,矩阵应该有相同的列
array([[1, 2, 5],

       [1, 7, 2],

       [3, 4, 2],

       [1, 0, 1]])
np.hstack((arr1,arr2)) # 合并两个矩阵的行,矩阵应该具有相同的行
array([[1, 2, 5, 3, 4, 2],

       [1, 7, 2, 1, 0, 1]])
np.concatenate((arr1,arr2),axis=0) # 合并两个矩阵,axis=0表示合并两个矩阵的列
array([[1, 2, 5],

       [1, 7, 2],

       [3, 4, 2],

       [1, 0, 1]])
np.concatenate((arr1,arr2),axis=1) # axis=1表示合并两个矩阵的行
array([[1, 2, 5, 3, 4, 2],

       [1, 7, 2, 1, 0, 1]])
通过函数创建矩阵
np.arange(1,10) # 通过arange创建一维数组
array([1, 2, 3, 4, 5, 6, 7, 8, 9])
np.ones((3,4)) # 创建3行4列全为1的二维数组
array([[1., 1., 1., 1.],

       [1., 1., 1., 1.],

       [1., 1., 1., 1.]])
np.ones((3,4),dtype=int) # dytpe=int表示数组内的数是整型
array([[1, 1, 1, 1],

       [1, 1, 1, 1],

       [1, 1, 1, 1]])
np.zeros((2,3)) # 构造2*3的全0矩阵
array([[0., 0., 0.],

       [0., 0., 0.]])
np.eye(3) # 构造单位矩阵
array([[1., 0., 0.],

       [0., 1., 0.],

       [0., 0., 1.]])
矩阵的运算
| 运算符 | 说明 |
|---|---|
| + | 两个矩阵对应元素相加 |
| - | 两个矩阵对应元素相减 |
| * | 两个矩阵对应元素相乘 |
| / | 两个矩阵对应元素相除 |
| % | 两个矩阵对应元素相除后取余数 |
| **n | 单个矩阵每个元素都取n次方 |
arr1+arr2
array([[4, 6, 7],

       [2, 7, 3]])
矩阵的点乘与转置
矩阵的点乘必须满足第一个矩阵的列数等于第二个矩阵的行数
np.dot(arr1,arr2.T)
array([[21,  6],

       [35,  3]])
arr2.T
array([[3, 1],

       [4, 0],

       [2, 1]])
矩阵的逆
矩阵行和列相同时,矩阵才可逆
np.linalg.inv(np.dot(arr1,arr2.T))
array([[-0.02040816,  0.04081633],

       [ 0.23809524, -0.14285714]])
矩阵的其他操作
arr1.max() # 获取矩阵所有元素中的最大值
7
arr1.min() # 获取矩阵所有元素中的最小值
1
arr1.argmax(axis=1)  # 获取矩阵最大元素的索引位置

arr1.mean()  # 获取矩阵所有元素的平均值

arr1.mean(axis=0)  # 获取矩阵每一列的平均值

arr1.mean(axis=1)  # 获取矩阵每一行的平均值

arr1.var()  # 获取矩阵所有元素的方差

arr1.var(axis=0)  # 获取矩阵每一列的元素的方差

arr1.var(axis=1)  # 获取矩阵每一行的元素的方差

arr1.std()  # 获取矩阵所有元素的标准差

arr1.std(axis=0)  # 获取矩阵每一列的元素的标准差

arr1.std(axis=1)  # 获取矩阵每一行的元素的标准差

np.median(arr1)  # 获取矩阵所有元素的中位数

np.median(arr1,axis=0)  # 获取矩阵每一列的元素的中位数

np.median(arr1,axis=1)  # 获取矩阵每一行的元素的中位数

arr1.sum()  # 对矩阵的每一个元素求和

arr1.sum(axis=0)  # 对矩阵的每一列求和

arr1.sum(axis=1)  # 对矩阵的每一行求和

arr1.cumsum()  # 累加和,如arr1=[1,2,3],arr1.cumsum=[1,3,6],第n个元素为前n-1个元素累加
numpy.random生成随机数
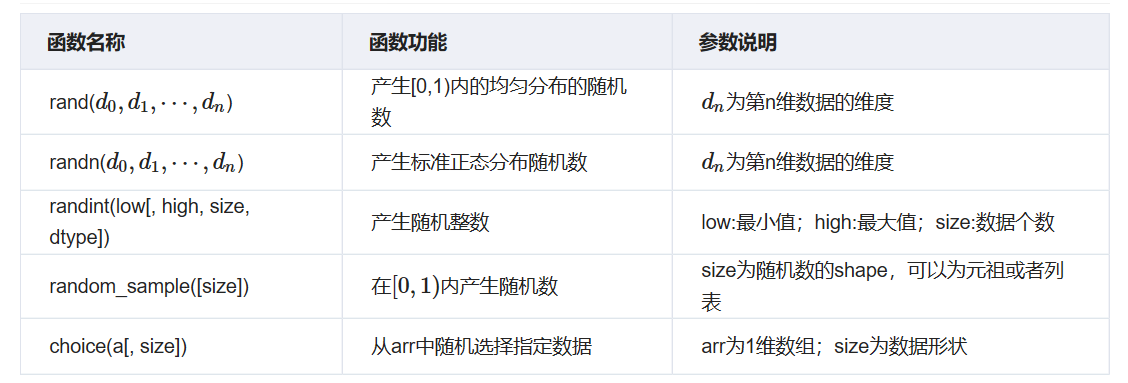
np.random.rand(3,4) # 产生[0,1)内的均匀分布的随机
array([[0.20445225, 0.87811744, 0.02738759, 0.67046751],

       [0.4173048 , 0.55868983, 0.14038694, 0.19810149],

       [0.80074457, 0.96826158, 0.31342418, 0.69232262]])
固定随机数
np.random.seed(1)  # 随机种子,固定随机数

np.random.rand(3,4)
array([[4.17022005e-01, 7.20324493e-01, 1.14374817e-04, 3.02332573e-01],

       [1.46755891e-01, 9.23385948e-02, 1.86260211e-01, 3.45560727e-01],

       [3.96767474e-01, 5.38816734e-01, 4.19194514e-01, 6.85219500e-01]])
rs = np.random.RandomState(1)  # 固定随机数

rs.rand(3,4)
array([[4.17022005e-01, 7.20324493e-01, 1.14374817e-04, 3.02332573e-01],

       [1.46755891e-01, 9.23385948e-02, 1.86260211e-01, 3.45560727e-01],

       [3.96767474e-01, 5.38816734e-01, 4.19194514e-01, 6.85219500e-01]])
pandas模块
pandas基于Numpy,可以看成是处理文本或者表格数据。pandas中有两个主要的数据结构,其中Series数据结构类似于Numpy中的一维数组,DataFrame类似于多维表格数据结构。
pandas是python数据分析的核心模块。它主要提供了五大功能:
- 支持文件存取操作,支持数据库(sql)、html、json、pickle、csv(txt、excel)、sas、stata、hdf等。
- 支持增删改查、切片、高阶函数、分组聚合等单表操作,以及和dict、list的互相转换。
- 支持多表拼接合并操作。
- 支持简单的绘图操作。
- 支持简单的统计分析操作
Series
import pandas as pd

pd.Series([1,2,3,4])  # 类似于一维数组,只能放一维的数组
0    1

1    2

2    3

3    4

dtype: int64
DataFrame
pd.DataFrame(np.array([[1,2,3],[3,2,1]])) # 两维以上的数组
.dataframe tbody tr th:only-of-type {
vertical-align: middle;
}
.dataframe tbody tr th {

    vertical-align: top;

}

.dataframe thead th {

    text-align: right;

}
| 0 | 1 | 2 | |
|---|---|---|---|
| 0 | 1 | 2 | 3 |
| 1 | 3 | 2 | 1 |
dates = pd.date_range('2019-5-15',periods = 7)

goods_list = ['tesla', 'transformer', 'faladi', 'wawa']

prices = np.random.rand(7,4)

df = pd.DataFrame(prices, index=dates, columns=goods_list)

df
.dataframe tbody tr th:only-of-type {
vertical-align: middle;
}
.dataframe tbody tr th {

    vertical-align: top;

}

.dataframe thead th {

    text-align: right;

}
| tesla | transformer | faladi | wawa | |
|---|---|---|---|---|
| 2019-05-15 | 0.860028 | 0.538831 | 0.552822 | 0.842031 |
| 2019-05-16 | 0.124173 | 0.279184 | 0.585759 | 0.969596 |
| 2019-05-17 | 0.561030 | 0.018647 | 0.800633 | 0.232974 |
| 2019-05-18 | 0.807105 | 0.387861 | 0.863542 | 0.747122 |
| 2019-05-19 | 0.556240 | 0.136455 | 0.059918 | 0.121343 |
| 2019-05-20 | 0.044552 | 0.107494 | 0.225709 | 0.712989 |
| 2019-05-21 | 0.559717 | 0.012556 | 0.071974 | 0.967276 |
DataFrame属性
df.dtypes # 查看数据类型
tesla          float64

transformer    float64

faladi         float64

wawa           float64

dtype: object
df.index # 查看行序列或者索引
DatetimeIndex(['2019-05-15', '2019-05-16', '2019-05-17', '2019-05-18',

               '2019-05-19', '2019-05-20', '2019-05-21'],

              dtype='datetime64[ns]', freq='D')
df.columns # 查看各列的标签
Index(['tesla', 'transformer', 'faladi', 'wawa'], dtype='object')
df.values # 查看数据框内的数据
array([[0.86002795, 0.53883106, 0.55282198, 0.84203089],

       [0.12417332, 0.27918368, 0.58575927, 0.96959575],

       [0.56103022, 0.01864729, 0.80063267, 0.23297427],

       [0.8071052 , 0.38786064, 0.86354185, 0.74712164],

       [0.55624023, 0.13645523, 0.05991769, 0.12134346],

       [0.04455188, 0.10749413, 0.22570934, 0.71298898],

       [0.55971698, 0.01255598, 0.07197428, 0.96727633]])
df.describe() # 查看数据每一列的极值,均值,中位数,只可用于数值型数据
.dataframe tbody tr th:only-of-type {
vertical-align: middle;
}
.dataframe tbody tr th {

    vertical-align: top;

}

.dataframe thead th {

    text-align: right;

}
| tesla | transformer | faladi | wawa | |
|---|---|---|---|---|
| count | 7.000000 | 7.000000 | 7.000000 | 7.000000 |
| mean | 0.501835 | 0.211575 | 0.451480 | 0.656190 |
| std | 0.311727 | 0.198347 | 0.333747 | 0.343075 |
| min | 0.044552 | 0.012556 | 0.059918 | 0.121343 |
| 25% | 0.340207 | 0.063071 | 0.148842 | 0.472982 |
| 50% | 0.559717 | 0.136455 | 0.552822 | 0.747122 |
| 75% | 0.684068 | 0.333522 | 0.693196 | 0.904654 |
| max | 0.860028 | 0.538831 | 0.863542 | 0.969596 |
df.transpose() # 转置、行列互换
.dataframe tbody tr th:only-of-type {
vertical-align: middle;
}
.dataframe tbody tr th {

    vertical-align: top;

}

.dataframe thead th {

    text-align: right;

}
| 2019-05-15 00:00:00 | 2019-05-16 00:00:00 | 2019-05-17 00:00:00 | 2019-05-18 00:00:00 | 2019-05-19 00:00:00 | 2019-05-20 00:00:00 | 2019-05-21 00:00:00 | |
|---|---|---|---|---|---|---|---|
| tesla | 0.860028 | 0.124173 | 0.561030 | 0.807105 | 0.556240 | 0.044552 | 0.559717 |
| transformer | 0.538831 | 0.279184 | 0.018647 | 0.387861 | 0.136455 | 0.107494 | 0.012556 |
| faladi | 0.552822 | 0.585759 | 0.800633 | 0.863542 | 0.059918 | 0.225709 | 0.071974 |
| wawa | 0.842031 | 0.969596 | 0.232974 | 0.747122 | 0.121343 | 0.712989 | 0.967276 |
df.sort_index() # 排序,可按行或列index排序输出
.dataframe tbody tr th:only-of-type {
vertical-align: middle;
}
.dataframe tbody tr th {

    vertical-align: top;

}

.dataframe thead th {

    text-align: right;

}
| tesla | transformer | faladi | wawa | |
|---|---|---|---|---|
| 2019-05-15 | 0.860028 | 0.538831 | 0.552822 | 0.842031 |
| 2019-05-16 | 0.124173 | 0.279184 | 0.585759 | 0.969596 |
| 2019-05-17 | 0.561030 | 0.018647 | 0.800633 | 0.232974 |
| 2019-05-18 | 0.807105 | 0.387861 | 0.863542 | 0.747122 |
| 2019-05-19 | 0.556240 | 0.136455 | 0.059918 | 0.121343 |
| 2019-05-20 | 0.044552 | 0.107494 | 0.225709 | 0.712989 |
| 2019-05-21 | 0.559717 | 0.012556 | 0.071974 | 0.967276 |
df.sort_values(by='wawa') # 按指定的数据排序
.dataframe tbody tr th:only-of-type {
vertical-align: middle;
}
.dataframe tbody tr th {

    vertical-align: top;

}

.dataframe thead th {

    text-align: right;

}
| tesla | transformer | faladi | wawa | |
|---|---|---|---|---|
| 2019-05-19 | 0.556240 | 0.136455 | 0.059918 | 0.121343 |
| 2019-05-17 | 0.561030 | 0.018647 | 0.800633 | 0.232974 |
| 2019-05-20 | 0.044552 | 0.107494 | 0.225709 | 0.712989 |
| 2019-05-18 | 0.807105 | 0.387861 | 0.863542 | 0.747122 |
| 2019-05-15 | 0.860028 | 0.538831 | 0.552822 | 0.842031 |
| 2019-05-21 | 0.559717 | 0.012556 | 0.071974 | 0.967276 |
| 2019-05-16 | 0.124173 | 0.279184 | 0.585759 | 0.969596 |
读取CSV文件
test_data = '''

c1,c2,c3,'c4'

5.1,,12,23

23,,,12

,12,11,11

1,2,2,2

1,1,1,1

1,2,3,4

5,6,7,8

’’’

'''

from io import StringIO

test_data = StringIO(test_data)

df = pd.read_csv(test_data)

df
.dataframe tbody tr th:only-of-type {
vertical-align: middle;
}
.dataframe tbody tr th {

    vertical-align: top;

}

.dataframe thead th {

    text-align: right;

}
| c1 | c2 | c3 | 'c4' | |
|---|---|---|---|---|
| 0 | 5.1 | NaN | 12.0 | 23.0 |
| 1 | 23 | NaN | NaN | 12.0 |
| 2 | NaN | 12.0 | 11.0 | 11.0 |
| 3 | 1 | 2.0 | 2.0 | 2.0 |
| 4 | 1 | 1.0 | 1.0 | 1.0 |
| 5 | 1 | 2.0 | 3.0 | 4.0 |
| 6 | 5 | 6.0 | 7.0 | 8.0 |
| 7 | ’’’ | NaN | NaN | NaN |
处理丢失数据
df.dropna(axis=0) # 把有空值的行删除,不改变df
.dataframe tbody tr th:only-of-type {
vertical-align: middle;
}
.dataframe tbody tr th {

    vertical-align: top;

}

.dataframe thead th {

    text-align: right;

}
| c1 | c2 | c3 | 'c4' | |
|---|---|---|---|---|
| 3 | 1 | 2.0 | 2.0 | 2.0 |
| 4 | 1 | 1.0 | 1.0 | 1.0 |
| 5 | 1 | 2.0 | 3.0 | 4.0 |
| 6 | 5 | 6.0 | 7.0 | 8.0 |
df.dropna(axis=1) # 把有空值的列删除,不改变df
.dataframe tbody tr th:only-of-type {
vertical-align: middle;
}
.dataframe tbody tr th {

    vertical-align: top;

}

.dataframe thead th {

    text-align: right;

}
| 0 |
|---|
| 1 |
| 2 |
| 3 |
| 4 |
| 5 |
| 6 |
| 7 |
df.dropna(thresh=6,axis=1) # 将行(列)中非空值个数小于thresh的行(列)删除,(axis=0表示行,1表示列)
.dataframe tbody tr th:only-of-type {
vertical-align: middle;
}
.dataframe tbody tr th {

    vertical-align: top;

}

.dataframe thead th {

    text-align: right;

}
| c1 | c3 | 'c4' | |
|---|---|---|---|
| 0 | 5.1 | 12.0 | 23.0 |
| 1 | 23 | NaN | 12.0 |
| 2 | NaN | 11.0 | 11.0 |
| 3 | 1 | 2.0 | 2.0 |
| 4 | 1 | 1.0 | 1.0 |
| 5 | 1 | 3.0 | 4.0 |
| 6 | 5 | 7.0 | 8.0 |
| 7 | ’’’ | NaN | NaN |
df
.dataframe tbody tr th:only-of-type {
vertical-align: middle;
}
.dataframe tbody tr th {

    vertical-align: top;

}

.dataframe thead th {

    text-align: right;

}
| c1 | c2 | c3 | 'c4' | |
|---|---|---|---|---|
| 0 | 5.1 | NaN | 12.0 | 23.0 |
| 1 | 23 | NaN | NaN | 12.0 |
| 2 | NaN | 12.0 | 11.0 | 11.0 |
| 3 | 1 | 2.0 | 2.0 | 2.0 |
| 4 | 1 | 1.0 | 1.0 | 1.0 |
| 5 | 1 | 2.0 | 3.0 | 4.0 |
| 6 | 5 | 6.0 | 7.0 | 8.0 |
| 7 | ’’’ | NaN | NaN | NaN |
df.dropna(subset=['c2']) # 把c2列中空值的那行删除
.dataframe tbody tr th:only-of-type {
vertical-align: middle;
}
.dataframe tbody tr th {

    vertical-align: top;

}

.dataframe thead th {

    text-align: right;

}
| c1 | c2 | c3 | 'c4' | |
|---|---|---|---|---|
| 2 | NaN | 12.0 | 11.0 | 11.0 |
| 3 | 1 | 2.0 | 2.0 | 2.0 |
| 4 | 1 | 1.0 | 1.0 | 1.0 |
| 5 | 1 | 2.0 | 3.0 | 4.0 |
| 6 | 5 | 6.0 | 7.0 | 8.0 |
df.fillna(value=0) # 将空值用value填充
.dataframe tbody tr th:only-of-type {
vertical-align: middle;
}
.dataframe tbody tr th {

    vertical-align: top;

}

.dataframe thead th {

    text-align: right;

}
| c1 | c2 | c3 | 'c4' | |
|---|---|---|---|---|
| 0 | 5.1 | 0.0 | 12.0 | 23.0 |
| 1 | 23 | 0.0 | 0.0 | 12.0 |
| 2 | 0 | 12.0 | 11.0 | 11.0 |
| 3 | 1 | 2.0 | 2.0 | 2.0 |
| 4 | 1 | 1.0 | 1.0 | 1.0 |
| 5 | 1 | 2.0 | 3.0 | 4.0 |
| 6 | 5 | 6.0 | 7.0 | 8.0 |
| 7 | ’’’ | 0.0 | 0.0 | 0.0 |
合并数据
df1 = pd.DataFrame(np.array([[1,2,3],[4,5,6]]))

df2 = pd.DataFrame(np.array([[4,5,6],[1,2,3]]))

pd.concat((df1,df2),axis=1)  # axis=0时合并列,axis=1合并行
.dataframe tbody tr th:only-of-type {
vertical-align: middle;
}
.dataframe tbody tr th {

    vertical-align: top;

}

.dataframe thead th {

    text-align: right;

}
| 0 | 1 | 2 | 0 | 1 | 2 | |
|---|---|---|---|---|---|---|
| 0 | 1 | 2 | 3 | 4 | 5 | 6 |
| 1 | 4 | 5 | 6 | 1 | 2 | 3 |
取值
df.loc[7] # 通过索引取值
c1      ’’’

c2      NaN

c3      NaN

'c4'    NaN

Name: 7, dtype: object
df.iloc[0,:] # 取第一行
c1      5.1

c2      NaN

c3       12

'c4'     23

Name: 0, dtype: object
df.iloc[0,:] = 0  # 将第一行赋值为0

df
.dataframe tbody tr th:only-of-type {
vertical-align: middle;
}
.dataframe tbody tr th {

    vertical-align: top;

}

.dataframe thead th {

    text-align: right;

}
| c1 | c2 | c3 | 'c4' | |
|---|---|---|---|---|
| 0 | 0 | 0.0 | 0.0 | 0.0 |
| 1 | 23 | NaN | NaN | 12.0 |
| 2 | NaN | 12.0 | 11.0 | 11.0 |
| 3 | 1 | 2.0 | 2.0 | 2.0 |
| 4 | 1 | 1.0 | 1.0 | 1.0 |
| 5 | 1 | 2.0 | 3.0 | 4.0 |
| 6 | 5 | 6.0 | 7.0 | 8.0 |
| 7 | ’’’ | NaN | NaN | NaN |
导入导出数据
df.to_excel('test.xlsx')
df = pd.read_excel('test.xlsx')

df
.dataframe tbody tr th:only-of-type {
vertical-align: middle;
}
.dataframe tbody tr th {

    vertical-align: top;

}

.dataframe thead th {

    text-align: right;

}
| Unnamed: 0 | c1 | c2 | c3 | 'c4' | |
|---|---|---|---|---|---|
| 0 | 0 | 0 | 0.0 | 0.0 | 0.0 |
| 1 | 1 | 23 | NaN | NaN | 12.0 |
| 2 | 2 | NaN | 12.0 | 11.0 | 11.0 |
| 3 | 3 | 1 | 2.0 | 2.0 | 2.0 |
| 4 | 4 | 1 | 1.0 | 1.0 | 1.0 |
| 5 | 5 | 1 | 2.0 | 3.0 | 4.0 |
| 6 | 6 | 5 | 6.0 | 7.0 | 8.0 |
| 7 | 7 | ’’’ | NaN | NaN | NaN |
matplotlib模块
图形可视化,主要用来画图。它可以创建常用的统计图,包括条形图、箱型图、折线图、散点图和直方图
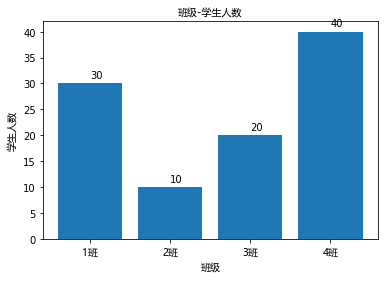
条形图
# 导入模块

import matplotlib.pyplot as plt

from matplotlib.font_manager import FontProperties

%matplotlib inline  # 只有在使用jupyter时使用这行

font = FontProperties(fname='E:\msyh.ttc')  #fname是中文字体路径
classes = ['1班','2班','3班','4班']

student_amounts = [30,10,20,40]

classes_index = range(len(classes))

# 绘制条形图

plt.bar(classes_index,student_amounts)

plt.xticks(classes_index,classes,FontProperties=font)

plt.xlabel('班级',FontProperties=font)  # x方向加上标签

plt.ylabel('学生人数',FontProperties=font)  # y方向加上标签

plt.title('班级-学生人数',FontProperties=font)  # 给图添加标题

# 给条形图的上方加上各班级的人数

for ind,student_amount in enumerate(student_amounts):

    plt.text(ind,student_amount+1,student_amount)

plt.show()
直方图
mu1,mu2,sigma = 50,100,10

x1 = mu1 + sigma * np.random.randn(10000)  # 生成10000个正态分布随机数

x2 = mu2 + sigma * np.random.randn(10000)

# 修改背景

plt.style.use('ggplot')

fig = plt.figure()  # 生成一张画布

ax1 = fig.add_subplot(121) # 121表示将画布分成1行2列,第二个1表示第一个

ax2 = fig.add_subplot(122)  # 122表示将画布分成1行2列,第二个2表示第二个

# 绘制直方图

ax1.hist(x1,bins=100,color='red')

ax2.hist(x2,bins=200,color='green')

# 分别给两个图加标题

ax1.set_title('红色',fontproperties=font)

ax2.set_title('绿色',fontproperties=font)

# 给整个加大标题

fig.suptitle('大标题',fontproperties=font,fontsize=15,weight='bold')  # fontsize字体大小,weight字体粗细bold表示加粗

plt.show()

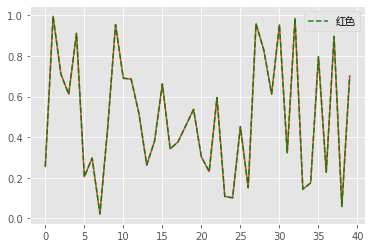
折线图
data1 = np.random.rand(40) # 生成40个数字
# 画折线图
plt.plot(data1)
# linestyle是线的类型有“-、--、:、-.”四种,alpha表示透明度,label表示标记
plt.plot(data1,color='green',linestyle='--',alpha=0.9,label='红色')
plt.legend(prop=font) # 显示label
plt.show()
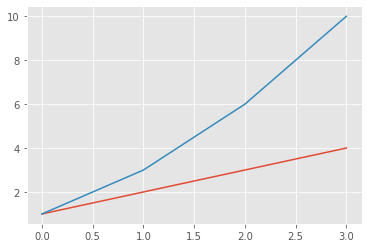
# 生成多条折线
arr = np.array([1,2,3,4])
arr2 = arr.cumsum()
plt.plot(arr)
plt.plot(arr2)
plt.show()
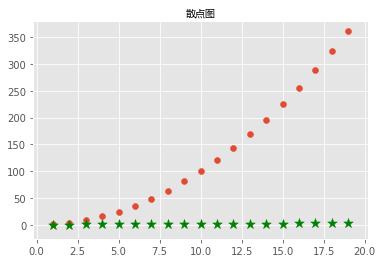
散点图
x = np.arange(1,20)

y_linear = x ** 2

y_log = np.log(x)  # 取x的对数

# 画散点图

plt.scatter(x,y_linear)

plt.scatter(x,y_log,color='green',marker='*',s=100)  # color颜色,marker记号,s表示大小

plt.title('散点图',FontProperties=font)

plt.show()
day18-常用模块III (numpy、pandas、matplotlib)的更多相关文章
- 常用统计分析python包开源学习代码 numpy pandas matplotlib
常用统计分析python包开源学习代码 numpy pandas matplotlib 待办 https://github.com/zmzhouXJTU/Python-Data-Analysis
- python 数据分析工具之 numpy pandas matplotlib
作为一个网络技术人员,机器学习是一种很有必要学习的技术,在这个数据爆炸的时代更是如此. python做数据分析,最常用以下几个库 numpy pandas matplotlib 一.Numpy库 为了 ...
- 第一章:AI人工智能 の 数据预处理编程实战 Numpy, Pandas, Matplotlib, Scikit-Learn
本课主题 数据中 Independent 变量和 Dependent 变量 Python 数据预处理的三大神器:Numpy.Pandas.Matplotlib Scikit-Learn 的机器学习实战 ...
- numpy+pandas+ matplotlib模块(day18)
目录 numpy模块 二维数组 numpy数组的属性 T 数组的装置 dtype 数组元素的数据类型 size 数组元素的个数 ndim 数组的维数 shape数组的维度大小 astype 类型转换 ...
- numpy, pandas, matplotlib等常用库的学习手册
pandas介绍: 待续 参考资料: 中文:https://www.cnblogs.com/skying555/p/5914391.html 英文:http://www.datadependence. ...
- Python模块简介及安装 [numpy,pandas,matplotlib,scipy,statsmodels,Gensim,sklearn,keras]
https://pan.baidu.com/s/1bpVv3Ef 67bd 模块安装文件下载地址 pip install "numpy-1.12.0b+mkl-cp35- ...
- 11-2 numpy/pandas/matplotlib模块
目录 numpy模块 一维数组 二维数组 列表list和numpy的区别 获取多维数组的行和列 多维数组的索引 高级功能 多维数组的合并 通过函数方法创建多维数组 矩阵的运算 求最大值最小值 nump ...
- numpy+pandas+matplotlib+tushare股票分析
一.数据导入 安装tushare模块包 pip install tushare http://tushare.org/ tushare是一个财经数据接口包 import numpy as np imp ...
- python 安装anaconda, numpy, pandas, matplotlib 等
如果没安装anaconda,则这样安装这些库: pip install numpy pip install pandas pip install matplotlib sudo apt-get ins ...
随机推荐
- ajax请求同步与异步的区别
//同步请求 $.ajax({ type:'post', url:"<c:url value='/device/org/' />"+val, data:{'org ...
- Centos下mahout安装与配置
对于Mahout的安装与配置,须要一个前提.就是hadoop已经安装. 假设没有安装能够參考. http://blog.csdn.net/u012965373/article/details/4533 ...
- HDU1864_最大报销额(背包/01背包)
解题报告 pid=1864">题目传送门 #include <cstdio> #include <cstring> #include <iostream& ...
- HTTPie: a CLI, cURL-like tool for humans
HTTPie github HTTPie 是用 Python 编写,用到了 Requests 和 Pygments 这些出色的库. 主要特性: 直观的语法 格式化和色彩化的终端输出 内置 JSON 支 ...
- [计算机故障]excel无法存盘,总是自动重启恢复
同事的excel文档,无法保存.总是提示什么要发送错误报告.错误报告中的错误信息包含event type:BXE.这个文件大小约1M多.工作簿中包含表大约有30张,表名称为中文.我去看了看,其他电子表 ...
- Codeforces Beta Round #96 (Div. 1) C. Logo Turtle DP
C. Logo Turtle A lot of people associate Logo programming language with turtle graphics. In this c ...
- Sqoop异常解决ERROR tool.ImportTool: Encountered IOException running import job: java.io.IOException: No columns to generate for ClassWriter问题
问题详情如下: 解决办法 这个是由于mysql-connector-java的bug造成的,出错时我用的是mysql-connector-java-5.1.10-bin.jar,更新成mysql-co ...
- Android 通过USB查看kernel调试信息【转】
本文转载自:http://blog.csdn.net/lindonghai/article/details/51683644 前提:电脑已安装adb并可正常使用. 在调试Android驱动时,需要查看 ...
- POJ1664 计数 DP
题目传送门 http://poj.org/problem?id=1664 设$dp[i][j]$表示$i$个苹果放在$j$个盘子里的总数 $1.$ 当 苹果数 小于 盘子数 $(M < N) ...
- Mysql建表出现1005错误
转自:http://blog.sina.com.cn/s/blog_757807f30100vz23.html 当在创建一个表时提示1005错误无法创建时,注意检查一下几点: 1.当此表有外键时,检查 ...