
matplotlib极坐标方法详解
一、极坐标
在平面内取一个定点O,叫极点,引一条射线Ox,叫做极轴,再选定一个长度单位和角度的正方向(通常取逆时针方向)。对于平面内任何一点M,用ρ表示线段OM的长度(有时也用r表示),θ表示从Ox到OM的角度,ρ叫做点M的极径,θ叫做点M的极角,有序数对 (ρ,θ)就叫点M的极坐标,这样建立的坐标系叫做极坐标系。通常情况下,M的极径坐标单位为1(长度单位),极角坐标单位为rad(或°)

二、matplotlib绘制极坐标图
1.创建极坐标图
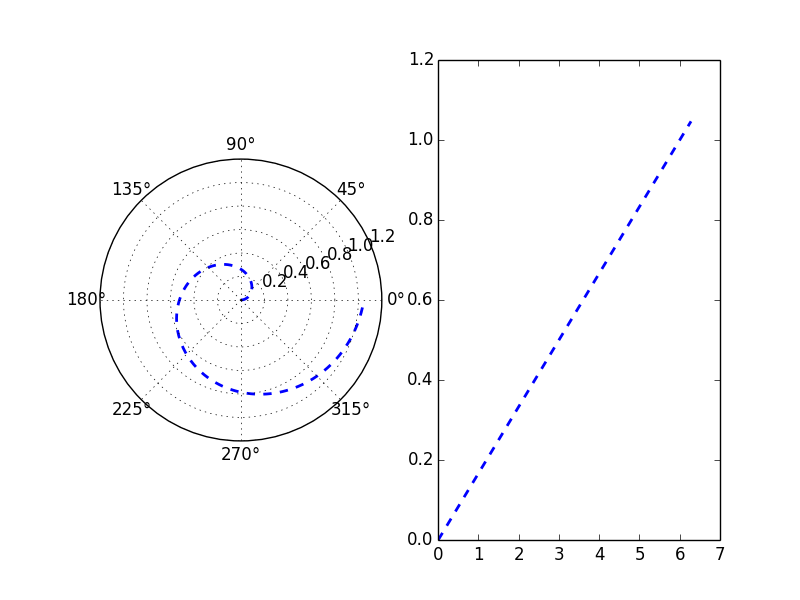
matplotlib的pyplot子库提供了绘制极坐标图的方法,在调用subplot()创建子图时通过设置projection='polar',便可创建一个极坐标子图,然后调用plot()在极坐标子图中绘图。
下面就创建一个极坐标子图和一个直角坐标子图进行对比。
import matplotlib.pyplot as plt

ax1 = plt.subplot(121, projection='polar')

ax2 = plt.subplot(122)

ax1.plot(theta,theta/6,'--',lw=2)

ax2.plot(theta,theta/6,'--',lw=2)

plt.show()
2.极坐标图设置
dir()命令可以得到一个对象的所有方法属性,通过比较ax1与ax2的方法属性便可知道极坐标有哪些设置方法。
>>> print(sorted(set(dir(ax1))-set(dir(ax2))))

['InvertedPolarTransform', 'PolarAffine', 'PolarTransform', 'RadialLocator', 'ThetaFormatter', '_default_rlabel_position', '_default_theta_direction', '_default_theta_offset', '_direction', '_r_label_position', '_theta_label1_position', '_theta_label2_position', '_theta_offset', '_xaxis_text1_transform', '_xaxis_text2_transform', '_yaxis_text_transform', 'get_rlabel_position', 'get_rmax', 'get_rmin', 'get_theta_direction', 'get_theta_offset', 'resolution', 'set_rgrids', 'set_rlabel_position', 'set_rlim', 'set_rmax', 'set_rmin', 'set_rscale', 'set_rticks', 'set_theta_direction', 'set_theta_offset', 'set_theta_zero_location', 'set_thetagrids', 'transProjection', 'transProjectionAffine', 'transPureProjection']
2.1 极坐标正方向
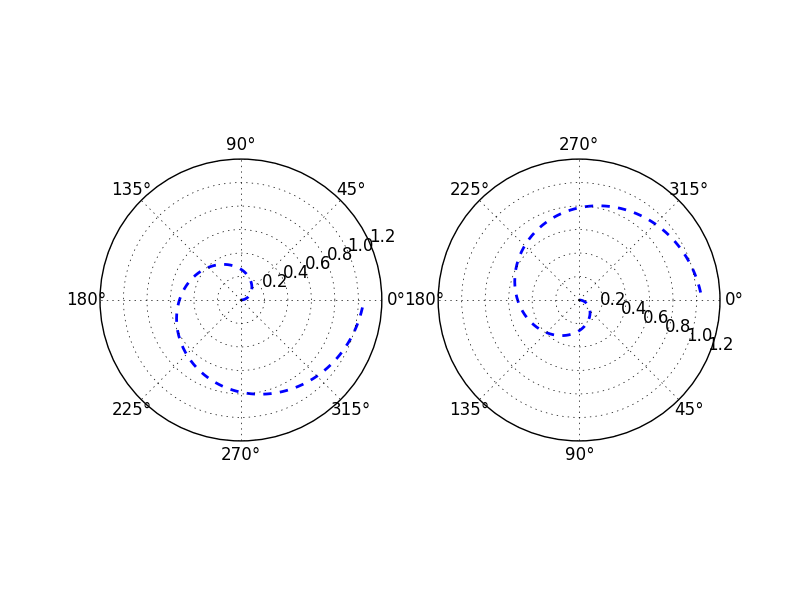
set_theta_direction方法用于设置极坐标的正方向
- 当
set_theta_direction的参数值为1,'counterclockwise'或者是'anticlockwise'的时候,正方向为逆时针; - 当
set_theta_direction的参数值为-1或者是'clockwise'的时候,正方向为顺时针; - 默认情况下正方向为逆时针
import matplotlib.pyplot as plt

import numpy as np

theta=np.arange(0,2*np.pi,0.02)

ax1= plt.subplot(121, projection='polar')

ax2= plt.subplot(122, projection='polar')

ax2.set_theta_direction(-1)

ax1.plot(theta,theta/6,'--',lw=2)

ax2.plot(theta,theta/6,'--',lw=2)

plt.show()
2.2 极坐标0°位置
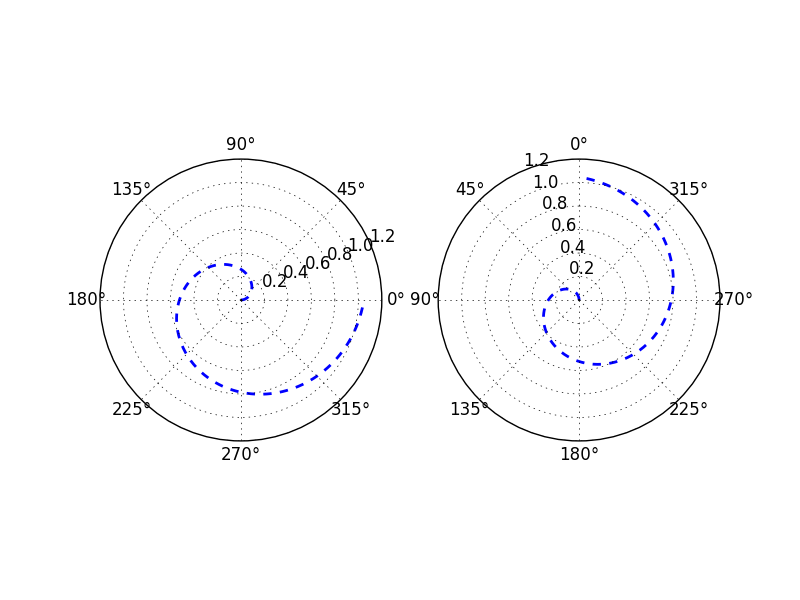
set_theta_zero_location方法用于设置极坐标0°位置
- 0°可设置在八个位置,分别为N, NW, W, SW, S, SE, E, NE
- 当
set_theta_zero_location的参数值为'N','NW','W','SW','S','SE','E','NE'时,0°分别对应的位置为方位N, NW, W, SW, S, SE, E, NE; - 默认情况下0°位于E方位
import matplotlib.pyplot as plt

import numpy as np

theta=np.arange(0,2*np.pi,0.02)

ax1= plt.subplot(121, projection='polar')

ax2= plt.subplot(122, projection='polar')

ax2.set_theta_zero_location('N')

ax1.plot(theta,theta/6,'--',lw=2)

ax2.plot(theta,theta/6,'--',lw=2)

plt.show()
2.3极坐标角度网格线显示
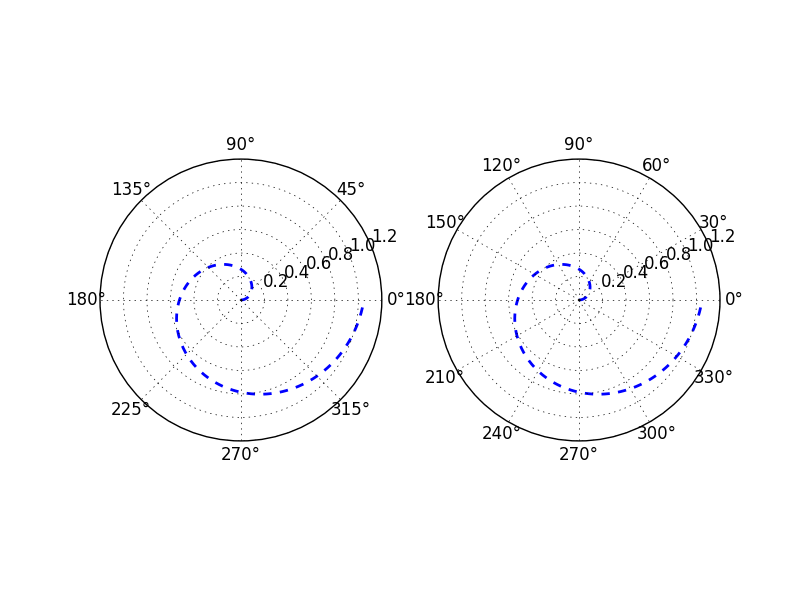
set_thetagrids方法用于设置极坐标角度网格线显示
- 参数为所要显示网格线的角度值列表
- 默认显示0°、45°、90°、135°、180°、225°、270°、315°的网格线
import matplotlib.pyplot as plt

import numpy as np

theta=np.arange(0,2*np.pi,0.02)

ax1= plt.subplot(121, projection='polar')

ax2= plt.subplot(122, projection='polar')

ax2.set_thetagrids(np.arange(0.0, 360.0, 30.0))

ax1.plot(theta,theta/6,'--',lw=2)

ax2.plot(theta,theta/6,'--',lw=2)

plt.show()
2.4极坐标角度偏离
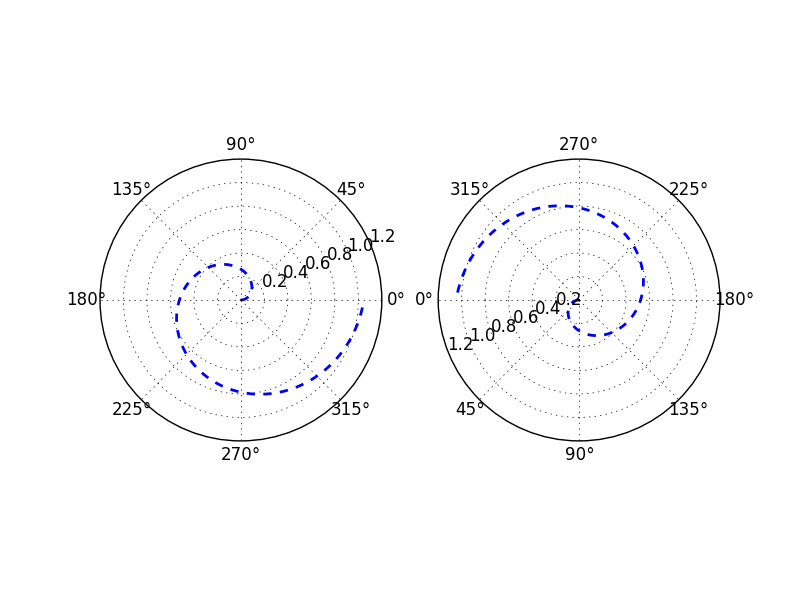
set_theta_offset方法用于设置角度偏离
- 参数值为弧度值数值
import matplotlib.pyplot as plt

import numpy as np

theta=np.arange(0,2*np.pi,0.02)

ax1= plt.subplot(121, projection='polar')

ax2= plt.subplot(122, projection='polar')

ax2.set_theta_offset(np.pi)

ax1.plot(theta,theta/6,'--',lw=2)

ax2.plot(theta,theta/6,'--',lw=2)

plt.show()
2.5极坐标极径网格线显示
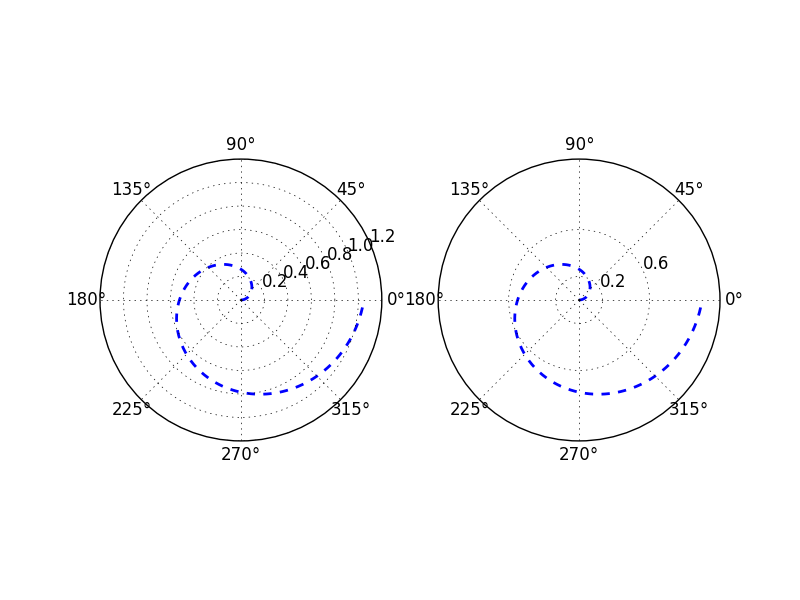
set_rgrids方法用于设置极径网格线显示
- 参数值为所要显示网格线的极径值列表,最小值不能小于等于0
import matplotlib.pyplot as plt

import numpy as np

theta=np.arange(0,2*np.pi,0.02)

ax1= plt.subplot(121, projection='polar')

ax2= plt.subplot(122, projection='polar')

ax2.set_rgrids(np.arange(0.2,1.0,0.4))

ax1.plot(theta,theta/6,'--',lw=2)

ax2.plot(theta,theta/6,'--',lw=2)

plt.show()
2.6极坐标极径标签位置
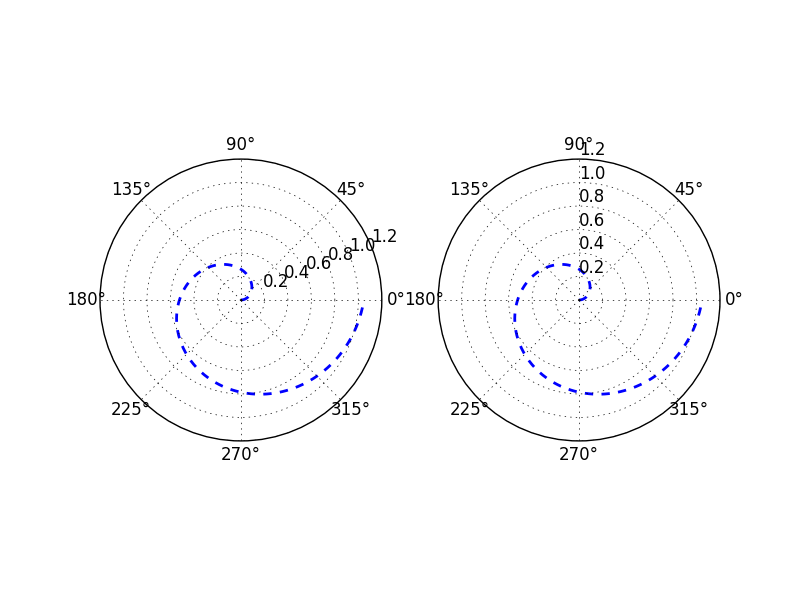
set_rlabel_position方法用于设置极径标签显示位置
- 参数为标签所要显示在的角度
import matplotlib.pyplot as plt

import numpy as np

theta=np.arange(0,2*np.pi,0.02)

ax1= plt.subplot(121, projection='polar')

ax2= plt.subplot(122, projection='polar')

ax2.set_rlabel_position('90')

ax1.plot(theta,theta/6,'--',lw=2)

ax2.plot(theta,theta/6,'--',lw=2)

plt.show()
2.7极坐标极径范围
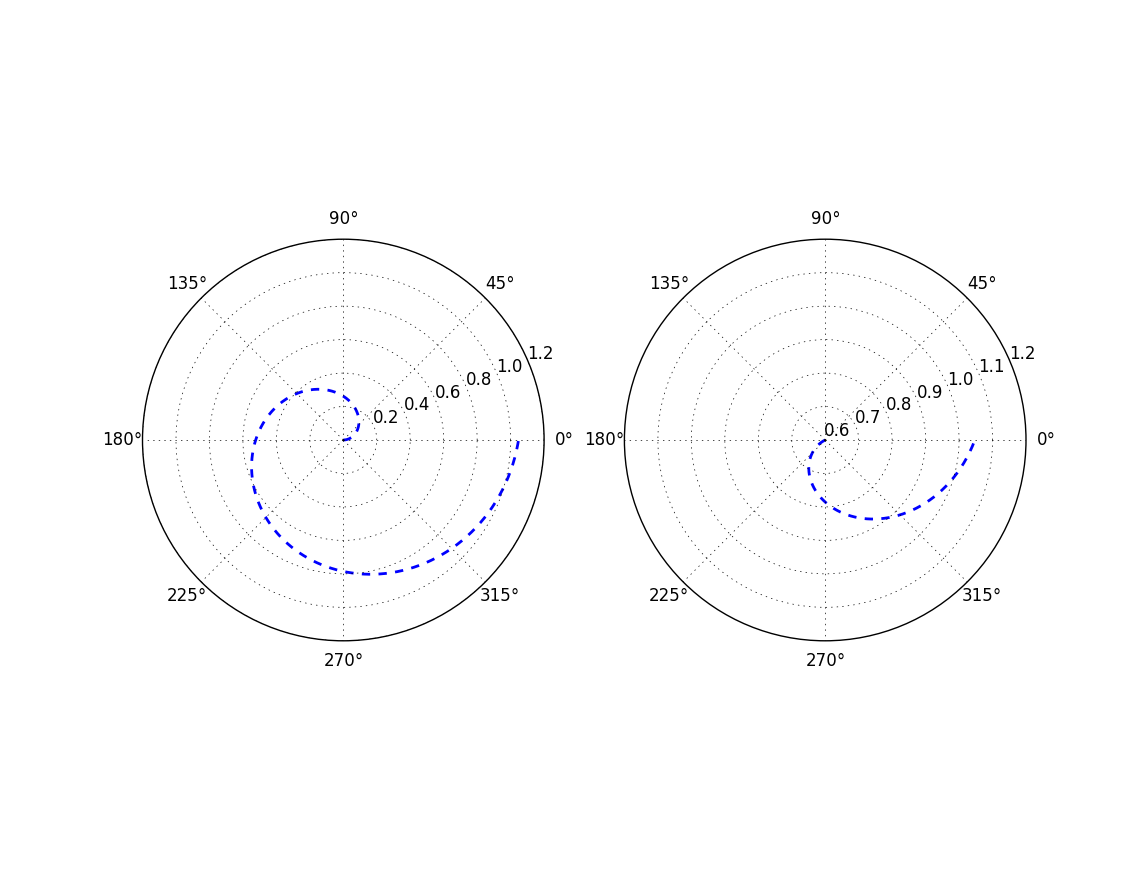
set_rlim方法用于设置显示的极径范围
- 参数为极径最小值,最大值
import matplotlib.pyplot as plt

import numpy as np

theta=np.arange(0,2*np.pi,0.02)

ax1= plt.subplot(121, projection='polar')

ax2= plt.subplot(122, projection='polar')

ax2.set_rlim(0.6,1.2)

ax1.plot(theta,theta/6,'--',lw=2)

ax2.plot(theta,theta/6,'--',lw=2)

plt.show()
2.8极坐标极径最大值
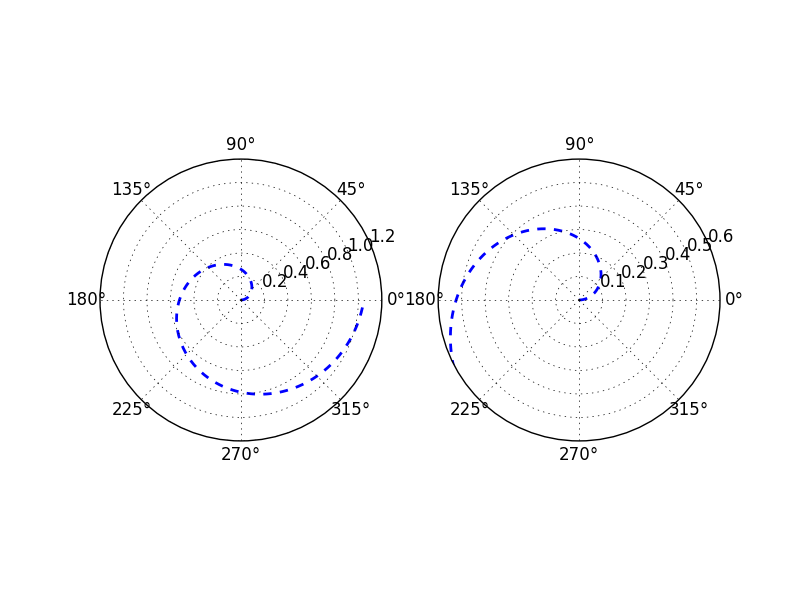
set_rmax方法用于设置显示的极径最大值
- 该方法要在绘制完图像后使用才有效
import matplotlib.pyplot as plt

import numpy as np

theta=np.arange(0,2*np.pi,0.02)

ax1= plt.subplot(121, projection='polar')

ax2= plt.subplot(122, projection='polar')

ax1.plot(theta,theta/6,'--',lw=2)

ax2.plot(theta,theta/6,'--',lw=2)

ax2.set_rmax(0.6)

plt.show()
2.9极坐标极径最小值
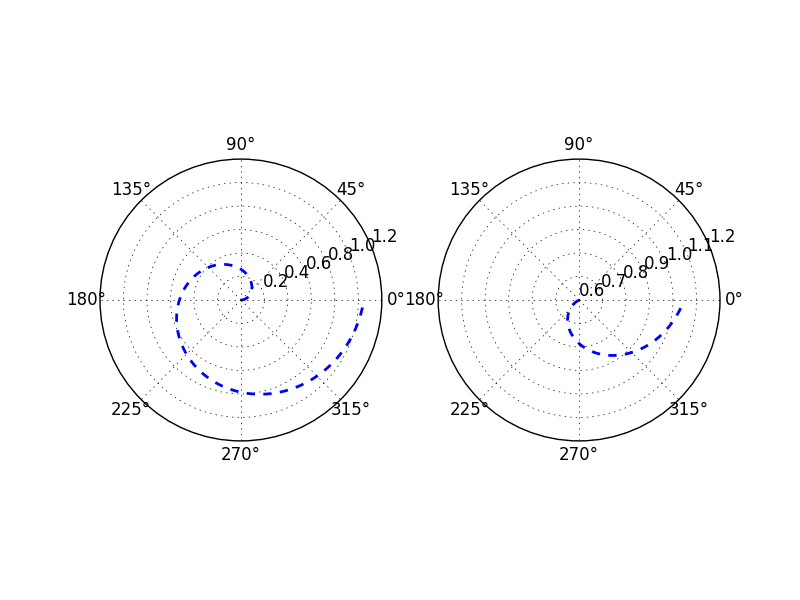
set_rmin方法用于设置显示的极径最小值
- 该方法要在绘制完图像后使用才有效
import matplotlib.pyplot as plt

import numpy as np

theta=np.arange(0,2*np.pi,0.02)

ax1= plt.subplot(121, projection='polar')

ax2= plt.subplot(122, projection='polar')

ax1.plot(theta,theta/6,'--',lw=2)

ax2.plot(theta,theta/6,'--',lw=2)

ax2.set_rmin(0.6)

plt.show()
2.10 极径对数坐标
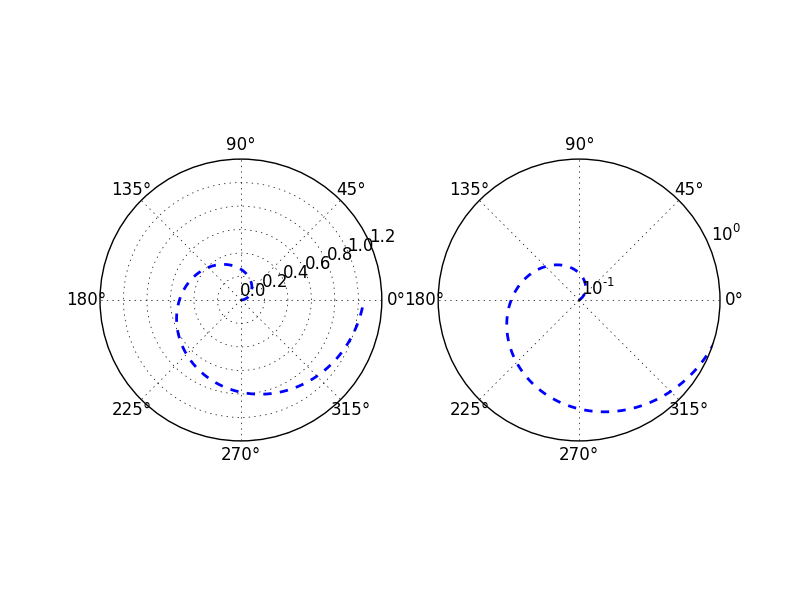
set_rscale方法用于设置极径对数坐标
- 参数值为'linear','log','symlog'
- 默认值为'linear'
- 该方法要在绘制完图像后使用才有效
import matplotlib.pyplot as plt

import numpy as np

theta=np.arange(0,2*np.pi,0.02)

ax1= plt.subplot(121, projection='polar')

ax2= plt.subplot(122, projection='polar')

ax1.plot(theta,theta/6,'--',lw=2)

ax2.plot(theta,theta/6,'--',lw=2)

ax2.set_rlim(math.pow(10,-1),math.pow(10,0))

ax1.set_rscale('linear')

ax2.set_rscale('symlog')

plt.show()
2.11 极坐标极径网格线显示范围
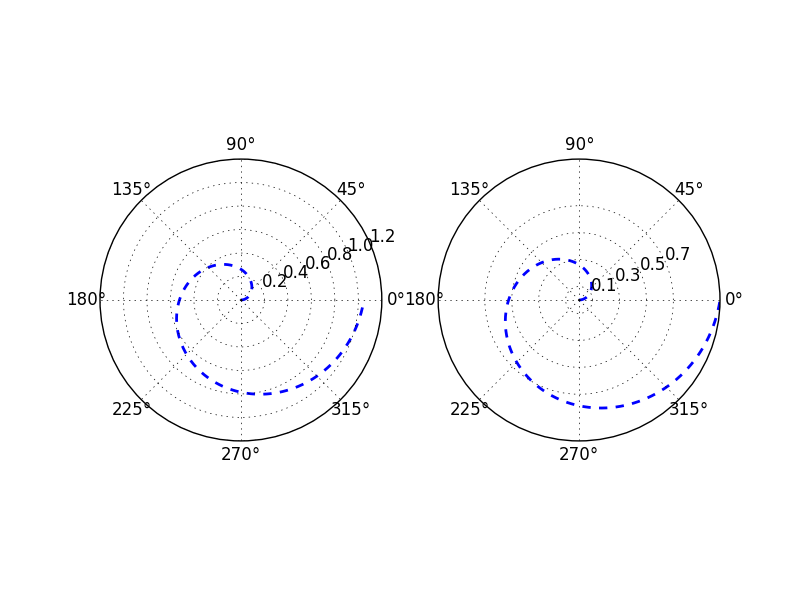
set_rticks方法用于设置极径网格线的显示范围
import matplotlib.pyplot as plt

import numpy as np

theta=np.arange(0,2*np.pi,0.02)

ax1= plt.subplot(121, projection='polar')

ax2= plt.subplot(122, projection='polar')

ax2.set_rticks(np.arange(0.1, 0.9, 0.2))

ax1.plot(theta,theta/6,'--',lw=2)

ax2.plot(theta,theta/6,'--',lw=2)

plt.show()
想观看Matplotlib教学视频,了解更多Matplotlib实用技巧可关注
微信公众账号: MatplotlibClass

今日头条号:Matplotlib小讲堂

matplotlib极坐标方法详解的更多相关文章
- session的使用方法详解
session的使用方法详解 Session是什么呢?简单来说就是服务器给客户端的一个编号.当一台WWW服务器运行时,可能有若干个用户浏览正在运正在这台服务器上的网站.当每个用户首次与这台WWW服务器 ...
- Kooboo CMS - Html.FrontHtml[Helper.cs] 各个方法详解
下面罗列了方法详解,每一个方法一篇文章. Kooboo CMS - @Html.FrontHtml().HtmlTitle() 详解 Kooboo CMS - Html.FrontHtml.Posit ...
- HTTP请求方法详解
HTTP请求方法详解 请求方法:指定了客户端想对指定的资源/服务器作何种操作 下面我们介绍HTTP/1.1中可用的请求方法: [GET:获取资源] GET方法用来请求已被URI识别的资源.指定 ...
- ecshop后台增加|添加商店设置选项和使用方法详解
有时候我们想在Ecshop后台做个设置.radio.checkbox 等等来控制页面的显示,看看Ecshop的设计,用到了shop_config这个商店设置功能 Ecshop后台增加|添加商店设置选项 ...
- (转)Spring JdbcTemplate 方法详解
Spring JdbcTemplate方法详解 文章来源:http://blog.csdn.net/dyllove98/article/details/7772463 JdbcTemplate主要提供 ...
- C++调用JAVA方法详解
C++调用JAVA方法详解 博客分类: 本文主要参考http://tech.ccidnet.com/art/1081/20050413/237901_1.html 上的文章. C++ ...
- windows.open()、close()方法详解
windows.open()方法详解: window.open(URL,name,features,replace)用于载入指定的URL到新的或已存在的窗口中,并返回代表新窗口的Win ...
- CURL使用方法详解
php采集神器CURL使用方法详解 作者:佚名 更新时间:2016-10-21 对于做过数据采集的人来说,cURL一定不会陌生.虽然在PHP中有file_get_contents函数可以获取远程 ...
- JAVA 注解的几大作用及使用方法详解
JAVA 注解的几大作用及使用方法详解 (2013-01-22 15:13:04) 转载▼ 标签: java 注解 杂谈 分类: Java java 注解,从名字上看是注释,解释.但功能却不仅仅是注释 ...
随机推荐
- highcharts为X轴标签添加链接
$(function () { var categoryLinks = { 'Foo': 'http://www.google.com/search?q=foo', 'Bar': 'http://ww ...
- java算法----排序----(6)希尔排序(最小增量排序)
package log; public class Test4 { /** * java算法---希尔排序(最小增量排序) * * @param args */ public static void ...
- linux的convert图片处理工具
得到一个图片的尺寸, identify test.png 结果为: test.png PNG 178x15 178x15+0+0 16-bit PseudoClass 65536c 2.28kb 使用 ...
- Python 学习 第六篇:迭代和解析
Python中的迭代是指按照元素的顺序逐个调用的过程,迭代概念包括:迭代协议.可迭代对象和迭代器三个概念. 迭代协议是指有__next__()函数的对象会前进到下一个结果,而到达系列的末尾时,则会引发 ...
- Python代码转c#部分参考样例
最近在做一部分Pyhton代码转c#代码的工作,以下案例亲自都测试过,现整理出来希望对有帮助的同学提供参考: Python | C# *:first-child{margin-top:0 !impor ...
- RabbitMQ 发布订阅-实现延时重试队列(参考)
RabbitMQ消息处理失败,我们会让失败消息进入重试队列等待执行,因为在重试队列距离真正执行还需要定义的时间间隔,因此,我们可以将重试队列设置成延时处理.今天参考网上其他人的实现,简单梳理下消息延时 ...
- VMware workstation运维实践系列博客导航
第一章:VMware workstation虚拟化1.1 VMware workstation计算网络存储介绍1.2 VMware workstation其他功能特性介绍1.3 VMware work ...
- Docker管理工具 - Swarm部署记录
之前介绍了Docker集群管理工具-Kubernetes部署记录,下面介绍另一个管理工具Swarm的用法,Swarm是Docker原生的集群管理软件,与Kubernetes比起来比较简单. Swarm ...
- Docker容器学习梳理 - 容器登陆方法梳理(attach、exec、nsenter)
对于运行在后台的Docker容器,我们运维人员时常是有登陆进去的需求.登陆Docker容器的方式:1)使用ssh登陆容器.这种方法需要在容器中启动sshd,存在开销和攻击面增大的问题.同时也违反了Do ...
- M2阶段测试报告
一.安全漏洞测试报告: http://files.cnblogs.com/hotsbuaa/M2-安全漏洞测试.pdf 二.全面兼容测试: http://files.cnblogs.com/hotsb ...