TNS-12518 & Linux Error:32:Broken pipe
最近一周,有一台ORACLE数据库服务器的监听服务在凌晨2点过几分的时间点突然崩溃,以前从没有出现过此类情况,但是最近一周出现了两次这种情况,检查时发现了如下一些信息:
$ lsnrctl services
LSNRCTL for Linux: Version 10.2.0.4.0 - Production on 12-DEC-2014 08:22:34
Copyright (c) 1991, 2007, Oracle. All rights reserved.
Connecting to (DESCRIPTION=(ADDRESS=(PROTOCOL=IPC)(KEY=EXTPROC1)))
TNS-12541: TNS:no listener
TNS-12560: TNS:protocol adapter error
TNS-00511: No listener
Linux Error: 111: Connection refused
Connecting to (DESCRIPTION=(ADDRESS=(PROTOCOL=TCP)(HOST=ceglnx01)(PORT=1521)))
TNS-12541: TNS:no listener
TNS-12560: TNS:protocol adapter error
TNS-00511: No listener
Linux Error: 111: Connection refused
检查监听服务的日志信息(/u01/app/oracle/product/10.2.0/db_1/network/log/listener.log),发现如下信息
第一次错误信息截图
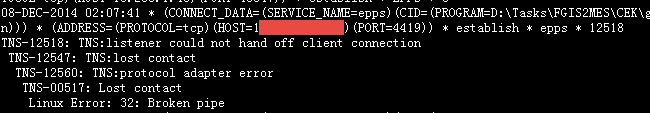
08-DEC-2014 02:07:41 * (CONNECT_DATA=(SERVICE_NAME=epps)(CID=(PROGRAM=D:\Tasks\FGIS2MES\CEK\gmt_auto.exe)(HOST=CEGWEB1)(USER=cegadmin))) * (ADDRESS=(PROTOCOL=tcp)(HOST=192.168.21.34)(PORT=4419)) * establish * epps * 12518
TNS-12518: TNS:listener could not hand off client connection
TNS-12547: TNS:lost contact
TNS-12560: TNS:protocol adapter error
TNS-00517: Lost contact
Linux Error: 32: Broken pipe
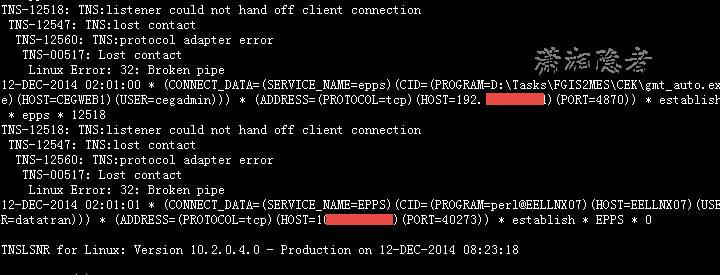
第二次错误信息截图
在metalink上查到ID 550859.1,出现Linux Error: 32: Broken pipe这个错误的原因大概有下面一些因素导致:
Cause:
The error 32 indicates the communication has been broken while the listener is trying to hand off the client connection to the server process or dispatcher process.
Action:
1. One of reason would be processes parameter being low, and can be verified by the v$resource_limit view.
2. In Shared Server mode, check the 'lsnrctl services' output and see if the dispatcher has refused any connections, if so, then consider increasing the number of dispatchers.
3. Check the alert log for any possible errors.
4. Memory resource is also another cause for this issue. Check the swap, memory usage of the OS.
1:错误原因之一:processes参数的值偏低
关于v$resource_limit,如下所示
|
Column |
Datatype |
Description |
|
|
RESOURCE_NAME |
VARCHAR2(30) |
资源名 |
Name of the resource |
|
CURRENT_UTILIZATION |
NUMBER |
资源的当前使用量 |
Number of (resources, locks, or processes) currently being used |
|
MAX_UTILIZATION |
NUMBER |
实例启动以来,资源使用达到的最大值 |
Maximum consumption of this resource since the last instance start-up |
|
INITIAL_ALLOCATION |
VARCHAR2(10) |
初始化值,一般等于limit_value |
Initial allocation. This will be equal to the value specified for the resource in the initialization parameter file (UNLIMITED for infinite allocation). |
|
LIMIT_VALUE |
VARCHAR2(10) |
系统设置的资源值 |
Unlimited for resources and locks. This can be greater than the initial allocation value (UNLIMITED for infinite limit). |
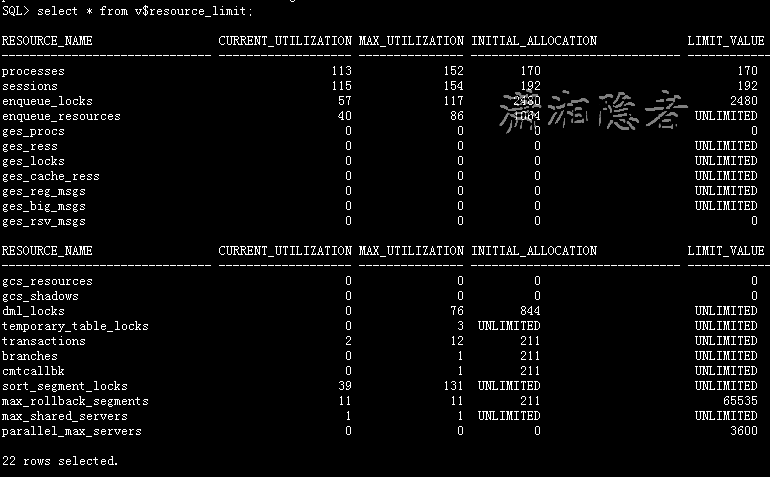
如下所示,我们可以发现自从实例启动以来,processes的最大值为152,而LIMIT_VALUE的值为170,所以可以排除这个原因导致上述错误。
SQL> select * from v$resource_limit;
RESOURCE_NAME CURRENT_UTILIZATION MAX_UTILIZATION INITIAL_ALLOCATION LIMIT_VALUE
--------------------- ------------------- --------------- ------------------ ------------
processes 113 152 170 170
sessions 115 154 192 192
enqueue_locks 57 117 2480 2480
enqueue_resources 40 86 1064 UNLIMITED
ges_procs 0 0 0 0
ges_ress 0 0 0 UNLIMITED
ges_locks 0 0 0 UNLIMITED
ges_cache_ress 0 0 0 UNLIMITED
ges_reg_msgs 0 0 0 UNLIMITED
ges_big_msgs 0 0 0 UNLIMITED
ges_rsv_msgs 0 0 0 0
RESOURCE_NAME CURRENT_UTILIZATION MAX_UTILIZATION INITIAL_ALLOCATION LIMIT_VALUE
--------------------- ------------------- --------------- ------------------ ------------
gcs_resources 0 0 0 0
gcs_shadows 0 0 0 0
dml_locks 0 76 844 UNLIMITED
temporary_table_locks 0 3 UNLIMITED UNLIMITED
transactions 2 12 211 UNLIMITED
branches 0 1 211 UNLIMITED
cmtcallbk 0 1 211 UNLIMITED
sort_segment_locks 39 131 UNLIMITED UNLIMITED
max_rollback_segments 11 11 211 65535
max_shared_servers 1 1 UNLIMITED UNLIMITED
parallel_max_servers 0 0 0 3600
22 rows selected.
SQL>
2: 如下所示,shared_servers的值大于1,服务器是共享模式
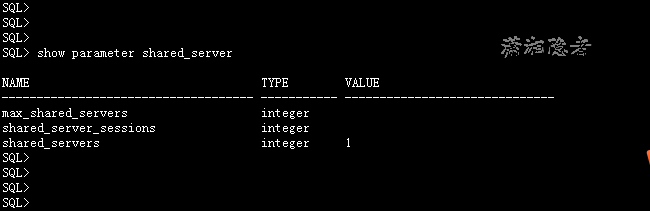
客户端连接数据库都是专用服务器模式dedicated server connection,如下所示
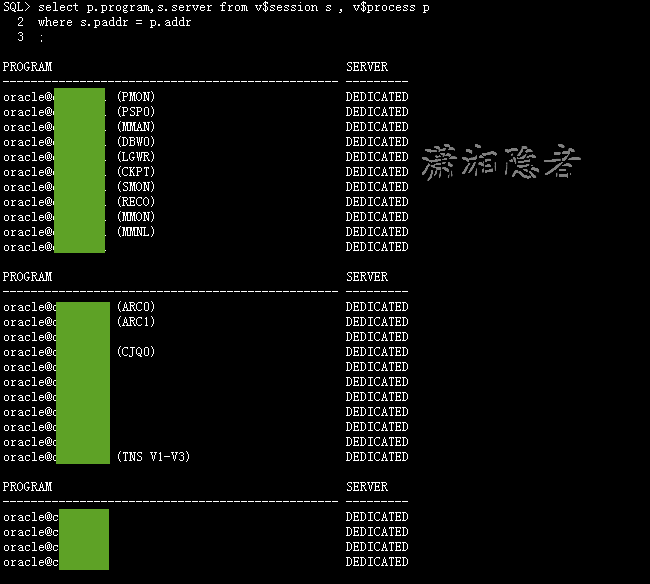
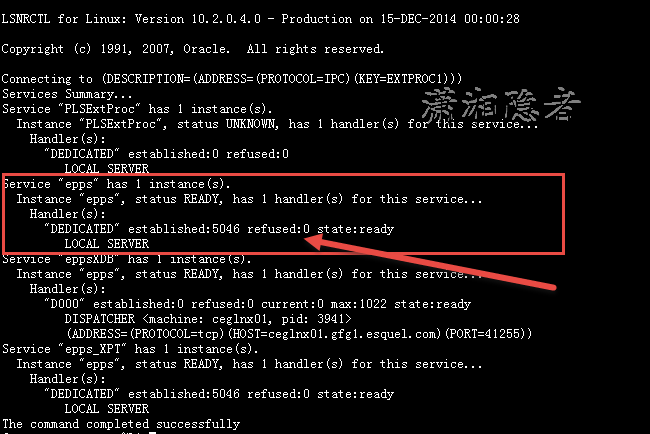
lsnrctl services 查看时并没有发现dispatcher has refused any connections,所以也可以排除dispatchers数量偏少的原因。这个如下截图所示
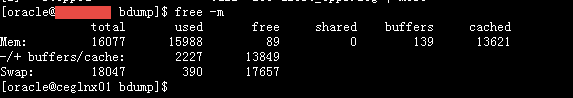
3: 关于内存资源不足会导致该错误,如下所示,服务器RAM 16G, 物理内存基本使用完,但是Swap基本上没有使用多少,有点嫌疑,但是还是没有明显的证据。
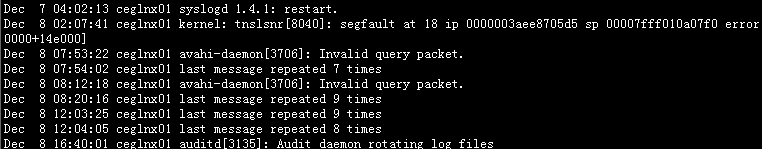
查看系统日志messages,如下所示,第一次在02:07有一条错误记录,查看了一些资料后,判定应该是由内存访问越界造成的。这个倒是一个支持内存不足导致监听服务错误的有力证据。
[root@ceglnx01 log]# more /var/log/messages
Dec 7 04:02:13 ceglnx01 syslogd 1.4.1: restart.
Dec 8 02:07:41 ceglnx01 kernel: tnslsnr[8040]: segfault at 18 ip 0000003aee8705d5 sp 00007fff010a07f0 error 4 in libc-2.5.so[3aee80
0000+14e000]
Dec 8 07:53:22 ceglnx01 avahi-daemon[3706]: Invalid query packet.
Dec 8 07:54:02 ceglnx01 last message repeated 7 times
Dec 8 08:12:18 ceglnx01 avahi-daemon[3706]: Invalid query packet.
Dec 8 08:20:16 ceglnx01 last message repeated 9 times
第二次错误信息,也是发生在凌晨2:07,具体错误信息如下所示:
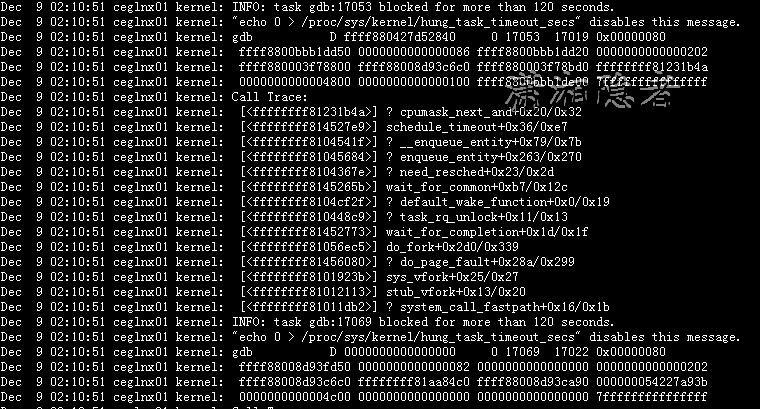
Dec 9 02:10:51 ceglnx01 kernel: INFO: task gdb:17053 blocked for more than 120 seconds.
Dec 9 02:10:51 ceglnx01 kernel: "echo 0 > /proc/sys/kernel/hung_task_timeout_secs" disables this message.
Dec 9 02:10:51 ceglnx01 kernel: gdb D ffff880427d52840 0 17053 17019 0x00000080
Dec 9 02:10:51 ceglnx01 kernel: ffff8800bbb1dd50 0000000000000086 ffff8800bbb1dd20 0000000000000202
Dec 9 02:10:51 ceglnx01 kernel: ffff880003f78800 ffff88008d93c6c0 ffff880003f78bd0 ffffffff81231b4a
Dec 9 02:10:51 ceglnx01 kernel: 0000000000004800 0000000000000100 ffff8800bbb1de00 7fffffffffffffff
Dec 9 02:10:51 ceglnx01 kernel: Call Trace:
Dec 9 02:10:51 ceglnx01 kernel: [<ffffffff81231b4a>] ? cpumask_next_and+0x20/0x32
Dec 9 02:10:51 ceglnx01 kernel: [<ffffffff814527e9>] schedule_timeout+0x36/0xe7
Dec 9 02:10:51 ceglnx01 kernel: [<ffffffff8104541f>] ? __enqueue_entity+0x79/0x7b
Dec 9 02:10:51 ceglnx01 kernel: [<ffffffff81045684>] ? enqueue_entity+0x263/0x270
Dec 9 02:10:51 ceglnx01 kernel: [<ffffffff8104367e>] ? need_resched+0x23/0x2d
Dec 9 02:10:51 ceglnx01 kernel: [<ffffffff8145265b>] wait_for_common+0xb7/0x12c
Dec 9 02:10:51 ceglnx01 kernel: [<ffffffff8104cf2f>] ? default_wake_function+0x0/0x19
Dec 9 02:10:51 ceglnx01 kernel: [<ffffffff810448c9>] ? task_rq_unlock+0x11/0x13
Dec 9 02:10:51 ceglnx01 kernel: [<ffffffff81452773>] wait_for_completion+0x1d/0x1f
Dec 9 02:10:51 ceglnx01 kernel: [<ffffffff81056ec5>] do_fork+0x2d0/0x339
Dec 9 02:10:51 ceglnx01 kernel: [<ffffffff81456080>] ? do_page_fault+0x28a/0x299
Dec 9 02:10:51 ceglnx01 kernel: [<ffffffff8101923b>] sys_vfork+0x25/0x27
Dec 9 02:10:51 ceglnx01 kernel: [<ffffffff81012113>] stub_vfork+0x13/0x20
Dec 9 02:10:51 ceglnx01 kernel: [<ffffffff81011db2>] ? system_call_fastpath+0x16/0x1b
Dec 9 02:10:51 ceglnx01 kernel: INFO: task gdb:17069 blocked for more than 120 seconds.
Dec 9 02:10:51 ceglnx01 kernel: "echo 0 > /proc/sys/kernel/hung_task_timeout_secs" disables this message.
Dec 9 02:10:51 ceglnx01 kernel: gdb D 0000000000000000 0 17069 17022 0x00000080
Dec 9 02:10:51 ceglnx01 kernel: ffff88008d93fd50 0000000000000082 0000000000000000 0000000000000202
Dec 9 02:10:51 ceglnx01 kernel: ffff88008d93c6c0 ffffffff81aa84c0 ffff88008d93ca90 000000054227a93b
Dec 9 02:10:51 ceglnx01 kernel: 0000000000004c00 0000000000000000 0000000000000000 7fffffffffffffff
Dec 9 02:10:51 ceglnx01 kernel: Call Trace:
Dec 9 02:10:51 ceglnx01 kernel: [<ffffffff814527e9>] schedule_timeout+0x36/0xe7
Dec 9 02:10:51 ceglnx01 kernel: [<ffffffff8104541f>] ? __enqueue_entity+0x79/0x7b
Dec 9 02:10:51 ceglnx01 kernel: [<ffffffff81045684>] ? enqueue_entity+0x263/0x270
Dec 9 02:10:51 ceglnx01 kernel: [<ffffffff8104367e>] ? need_resched+0x23/0x2d
Dec 9 02:10:51 ceglnx01 kernel: [<ffffffff8145265b>] wait_for_common+0xb7/0x12c
Dec 9 02:10:51 ceglnx01 kernel: [<ffffffff8104cf2f>] ? default_wake_function+0x0/0x19
Dec 9 02:10:51 ceglnx01 kernel: [<ffffffff810448c9>] ? task_rq_unlock+0x11/0x13
Dec 9 02:10:51 ceglnx01 kernel: [<ffffffff81452773>] wait_for_completion+0x1d/0x1f
Dec 9 02:10:51 ceglnx01 kernel: [<ffffffff81056ec5>] do_fork+0x2d0/0x339
Dec 9 02:10:51 ceglnx01 kernel: [<ffffffff81456080>] ? do_page_fault+0x28a/0x299
Dec 9 02:10:51 ceglnx01 kernel: [<ffffffff8101923b>] sys_vfork+0x25/0x27
Dec 9 02:10:51 ceglnx01 kernel: [<ffffffff81012113>] stub_vfork+0x13/0x20
Dec 9 02:10:51 ceglnx01 kernel: [<ffffffff81011db2>] ? system_call_fastpath+0x16/0x1b
Dec 9 02:12:51 ceglnx01 kernel: INFO: task gdb:17053 blocked for more than 120 seconds.
Dec 9 02:12:51 ceglnx01 kernel: "echo 0 > /proc/sys/kernel/hung_task_timeout_secs" disables this message.
Dec 9 02:12:51 ceglnx01 kernel: gdb D ffff880427d52840 0 17053 17019 0x00000080
Dec 9 02:12:51 ceglnx01 kernel: ffff8800bbb1dd50 0000000000000086 ffff8800bbb1dd20 0000000000000202
Dec 9 02:12:51 ceglnx01 kernel: ffff880003f78800 ffff88008d93c6c0 ffff880003f78bd0 ffffffff81231b4a
Dec 9 02:12:51 ceglnx01 kernel: 0000000000004800 0000000000000100 ffff8800bbb1de00 7fffffffffffffff
Dec 9 02:12:51 ceglnx01 kernel: Call Trace:
Dec 9 02:12:51 ceglnx01 kernel: [<ffffffff81231b4a>] ? cpumask_next_and+0x20/0x32
Dec 9 02:12:51 ceglnx01 kernel: [<ffffffff814527e9>] schedule_timeout+0x36/0xe7
Dec 9 02:12:51 ceglnx01 kernel: [<ffffffff8104541f>] ? __enqueue_entity+0x79/0x7b
Dec 9 02:12:51 ceglnx01 kernel: [<ffffffff81045684>] ? enqueue_entity+0x263/0x270
Dec 9 02:12:51 ceglnx01 kernel: [<ffffffff8104367e>] ? need_resched+0x23/0x2d
Dec 9 02:12:51 ceglnx01 kernel: [<ffffffff8145265b>] wait_for_common+0xb7/0x12c
Dec 9 02:12:51 ceglnx01 kernel: [<ffffffff8104cf2f>] ? default_wake_function+0x0/0x19
Dec 9 02:12:51 ceglnx01 kernel: [<ffffffff810448c9>] ? task_rq_unlock+0x11/0x13
Dec 9 02:12:51 ceglnx01 kernel: [<ffffffff81452773>] wait_for_completion+0x1d/0x1f
Dec 9 02:12:51 ceglnx01 kernel: [<ffffffff81056ec5>] do_fork+0x2d0/0x339
Dec 9 02:12:51 ceglnx01 kernel: [<ffffffff81456080>] ? do_page_fault+0x28a/0x299
Dec 9 02:12:51 ceglnx01 kernel: [<ffffffff8101923b>] sys_vfork+0x25/0x27
Dec 9 02:12:51 ceglnx01 kernel: [<ffffffff81012113>] stub_vfork+0x13/0x20
Dec 9 02:12:51 ceglnx01 kernel: [<ffffffff81011db2>] ? system_call_fastpath+0x16/0x1b
Dec 9 02:12:51 ceglnx01 kernel: INFO: task gdb:17069 blocked for more than 120 seconds.
Dec 9 02:12:51 ceglnx01 kernel: "echo 0 > /proc/sys/kernel/hung_task_timeout_secs" disables this message.
Dec 9 02:12:51 ceglnx01 kernel: gdb D 0000000000000000 0 17069 17022 0x00000080
Dec 9 02:12:51 ceglnx01 kernel: ffff88008d93fd50 0000000000000082 0000000000000000 0000000000000202
Dec 9 02:12:51 ceglnx01 kernel: ffff88008d93c6c0 ffffffff81aa84c0 ffff88008d93ca90 000000054227a93b
Dec 9 02:12:51 ceglnx01 kernel: 0000000000004c00 0000000000000000 0000000000000000 7fffffffffffffff
Dec 9 02:12:51 ceglnx01 kernel: Call Trace:
Dec 9 02:12:51 ceglnx01 kernel: [<ffffffff814527e9>] schedule_timeout+0x36/0xe7
Dec 9 02:12:51 ceglnx01 kernel: [<ffffffff8104541f>] ? __enqueue_entity+0x79/0x7b
Dec 9 02:12:51 ceglnx01 kernel: [<ffffffff81045684>] ? enqueue_entity+0x263/0x270
Dec 9 02:12:51 ceglnx01 kernel: [<ffffffff8104367e>] ? need_resched+0x23/0x2d
Dec 9 02:12:51 ceglnx01 kernel: [<ffffffff8145265b>] wait_for_common+0xb7/0x12c
Dec 9 02:12:51 ceglnx01 kernel: [<ffffffff8104cf2f>] ? default_wake_function+0x0/0x19
Dec 9 02:12:51 ceglnx01 kernel: [<ffffffff810448c9>] ? task_rq_unlock+0x11/0x13
Dec 9 02:12:51 ceglnx01 kernel: [<ffffffff81452773>] wait_for_completion+0x1d/0x1f
Dec 9 02:12:51 ceglnx01 kernel: [<ffffffff81056ec5>] do_fork+0x2d0/0x339
Dec 9 02:12:51 ceglnx01 kernel: [<ffffffff81456080>] ? do_page_fault+0x28a/0x299
Dec 9 02:12:51 ceglnx01 kernel: [<ffffffff8101923b>] sys_vfork+0x25/0x27
Dec 9 02:12:51 ceglnx01 kernel: [<ffffffff81012113>] stub_vfork+0x13/0x20
Dec 9 02:12:51 ceglnx01 kernel: [<ffffffff81011db2>] ? system_call_fastpath+0x16/0x1b
Dec 9 02:14:51 ceglnx01 kernel: INFO: task gdb:17053 blocked for more than 120 seconds.
Dec 9 02:14:51 ceglnx01 kernel: "echo 0 > /proc/sys/kernel/hung_task_timeout_secs" disables this message.
Dec 9 02:14:51 ceglnx01 kernel: gdb D ffff880427d52840 0 17053 17019 0x00000080
Dec 9 02:14:51 ceglnx01 kernel: ffff8800bbb1dd50 0000000000000086 ffff8800bbb1dd20 0000000000000202
Dec 9 02:14:51 ceglnx01 kernel: ffff880003f78800 ffff88008d93c6c0 ffff880003f78bd0 ffffffff81231b4a
Dec 9 02:14:51 ceglnx01 kernel: 0000000000004800 0000000000000100 ffff8800bbb1de00 7fffffffffffffff
Dec 9 02:14:51 ceglnx01 kernel: Call Trace:
Dec 9 02:14:51 ceglnx01 kernel: [<ffffffff81231b4a>] ? cpumask_next_and+0x20/0x32
Dec 9 02:14:51 ceglnx01 kernel: [<ffffffff814527e9>] schedule_timeout+0x36/0xe7
Dec 9 02:14:51 ceglnx01 kernel: [<ffffffff8104541f>] ? __enqueue_entity+0x79/0x7b
Dec 9 02:14:51 ceglnx01 kernel: [<ffffffff81045684>] ? enqueue_entity+0x263/0x270
Dec 9 02:14:51 ceglnx01 kernel: [<ffffffff8104367e>] ? need_resched+0x23/0x2d
Dec 9 02:14:51 ceglnx01 kernel: [<ffffffff8145265b>] wait_for_common+0xb7/0x12c
Dec 9 02:14:51 ceglnx01 kernel: [<ffffffff8104cf2f>] ? default_wake_function+0x0/0x19
Dec 9 02:14:51 ceglnx01 kernel: [<ffffffff810448c9>] ? task_rq_unlock+0x11/0x13
Dec 9 02:14:51 ceglnx01 kernel: [<ffffffff81452773>] wait_for_completion+0x1d/0x1f
Dec 9 02:14:51 ceglnx01 kernel: [<ffffffff81056ec5>] do_fork+0x2d0/0x339
Dec 9 02:14:51 ceglnx01 kernel: [<ffffffff81456080>] ? do_page_fault+0x28a/0x299
Dec 9 02:14:51 ceglnx01 kernel: [<ffffffff8101923b>] sys_vfork+0x25/0x27
Dec 9 02:14:51 ceglnx01 kernel: [<ffffffff81012113>] stub_vfork+0x13/0x20
Dec 9 02:14:51 ceglnx01 kernel: [<ffffffff81011db2>] ? system_call_fastpath+0x16/0x1b
Dec 9 02:14:51 ceglnx01 kernel: INFO: task gdb:17069 blocked for more than 120 seconds.
Dec 9 02:14:51 ceglnx01 kernel: "echo 0 > /proc/sys/kernel/hung_task_timeout_secs" disables this message.
Dec 9 02:14:51 ceglnx01 kernel: gdb D 0000000000000000 0 17069 17022 0x00000080
Dec 9 02:14:51 ceglnx01 kernel: ffff88008d93fd50 0000000000000082 0000000000000000 0000000000000202
Dec 9 02:14:51 ceglnx01 kernel: ffff88008d93c6c0 ffffffff81aa84c0 ffff88008d93ca90 000000054227a93b
Dec 9 02:14:51 ceglnx01 kernel: 0000000000004c00 0000000000000000 0000000000000000 7fffffffffffffff
Dec 9 02:14:51 ceglnx01 kernel: Call Trace:
Dec 9 02:14:51 ceglnx01 kernel: [<ffffffff814527e9>] schedule_timeout+0x36/0xe7
Dec 9 02:14:51 ceglnx01 kernel: [<ffffffff8104541f>] ? __enqueue_entity+0x79/0x7b
Dec 9 02:14:51 ceglnx01 kernel: [<ffffffff81045684>] ? enqueue_entity+0x263/0x270
Dec 9 02:14:51 ceglnx01 kernel: [<ffffffff8104367e>] ? need_resched+0x23/0x2d
Dec 9 02:14:51 ceglnx01 kernel: [<ffffffff8145265b>] wait_for_common+0xb7/0x12c
Dec 9 02:14:51 ceglnx01 kernel: [<ffffffff8104cf2f>] ? default_wake_function+0x0/0x19
Dec 9 02:14:51 ceglnx01 kernel: [<ffffffff810448c9>] ? task_rq_unlock+0x11/0x13
Dec 9 02:14:51 ceglnx01 kernel: [<ffffffff81452773>] wait_for_completion+0x1d/0x1f
Dec 9 02:14:51 ceglnx01 kernel: [<ffffffff81056ec5>] do_fork+0x2d0/0x339
Dec 9 02:14:51 ceglnx01 kernel: [<ffffffff81456080>] ? do_page_fault+0x28a/0x299
Dec 9 02:14:51 ceglnx01 kernel: [<ffffffff8101923b>] sys_vfork+0x25/0x27
Dec 9 02:14:51 ceglnx01 kernel: [<ffffffff81012113>] stub_vfork+0x13/0x20
Dec 9 02:14:51 ceglnx01 kernel: [<ffffffff81011db2>] ? system_call_fastpath+0x16/0x1b
Dec 9 02:16:51 ceglnx01 kernel: INFO: task gdb:17053 blocked for more than 120 seconds.
Dec 9 02:16:51 ceglnx01 kernel: "echo 0 > /proc/sys/kernel/hung_task_timeout_secs" disables this message.
Dec 9 02:16:51 ceglnx01 kernel: gdb D ffff880427d52840 0 17053 17019 0x00000080
Dec 9 02:16:51 ceglnx01 kernel: ffff8800bbb1dd50 0000000000000086 ffff8800bbb1dd20 0000000000000202
Dec 9 02:16:51 ceglnx01 kernel: ffff880003f78800 ffff88008d93c6c0 ffff880003f78bd0 ffffffff81231b4a
Dec 9 02:16:51 ceglnx01 kernel: 0000000000004800 0000000000000100 ffff8800bbb1de00 7fffffffffffffff
Dec 9 02:16:51 ceglnx01 kernel: Call Trace:
Dec 9 02:16:51 ceglnx01 kernel: [<ffffffff81231b4a>] ? cpumask_next_and+0x20/0x32
Dec 9 02:16:51 ceglnx01 kernel: [<ffffffff814527e9>] schedule_timeout+0x36/0xe7
Dec 9 02:16:51 ceglnx01 kernel: [<ffffffff8104541f>] ? __enqueue_entity+0x79/0x7b
Dec 9 02:16:51 ceglnx01 kernel: [<ffffffff81045684>] ? enqueue_entity+0x263/0x270
Dec 9 02:16:51 ceglnx01 kernel: [<ffffffff8104367e>] ? need_resched+0x23/0x2d
Dec 9 02:16:51 ceglnx01 kernel: [<ffffffff8145265b>] wait_for_common+0xb7/0x12c
Dec 9 02:16:51 ceglnx01 kernel: [<ffffffff8104cf2f>] ? default_wake_function+0x0/0x19
Dec 9 02:16:51 ceglnx01 kernel: [<ffffffff810448c9>] ? task_rq_unlock+0x11/0x13
Dec 9 02:16:51 ceglnx01 kernel: [<ffffffff81452773>] wait_for_completion+0x1d/0x1f
Dec 9 02:16:51 ceglnx01 kernel: [<ffffffff81056ec5>] do_fork+0x2d0/0x339
Dec 9 02:16:51 ceglnx01 kernel: [<ffffffff81456080>] ? do_page_fault+0x28a/0x299
Dec 9 02:16:51 ceglnx01 kernel: [<ffffffff8101923b>] sys_vfork+0x25/0x27
Dec 9 02:16:51 ceglnx01 kernel: [<ffffffff81012113>] stub_vfork+0x13/0x20
Dec 9 02:16:51 ceglnx01 kernel: [<ffffffff81011db2>] ? system_call_fastpath+0x16/0x1b
Dec 9 02:16:51 ceglnx01 kernel: INFO: task gdb:17069 blocked for more than 120 seconds.
Dec 9 02:16:51 ceglnx01 kernel: "echo 0 > /proc/sys/kernel/hung_task_timeout_secs" disables this message.
Dec 9 02:16:51 ceglnx01 kernel: gdb D 0000000000000000 0 17069 17022 0x00000080
Dec 9 02:16:51 ceglnx01 kernel: ffff88008d93fd50 0000000000000082 0000000000000000 0000000000000202
Dec 9 02:16:51 ceglnx01 kernel: ffff88008d93c6c0 ffffffff81aa84c0 ffff88008d93ca90 000000054227a93b
Dec 9 02:16:51 ceglnx01 kernel: 0000000000004c00 0000000000000000 0000000000000000 7fffffffffffffff
Dec 9 02:16:51 ceglnx01 kernel: Call Trace:
Dec 9 02:16:51 ceglnx01 kernel: [<ffffffff814527e9>] schedule_timeout+0x36/0xe7
Dec 9 02:16:51 ceglnx01 kernel: [<ffffffff8104541f>] ? __enqueue_entity+0x79/0x7b
Dec 9 02:16:51 ceglnx01 kernel: [<ffffffff81045684>] ? enqueue_entity+0x263/0x270
Dec 9 02:16:51 ceglnx01 kernel: [<ffffffff8104367e>] ? need_resched+0x23/0x2d
Dec 9 02:16:51 ceglnx01 kernel: [<ffffffff8145265b>] wait_for_common+0xb7/0x12c
Dec 9 02:16:51 ceglnx01 kernel: [<ffffffff8104cf2f>] ? default_wake_function+0x0/0x19
Dec 9 02:16:51 ceglnx01 kernel: [<ffffffff810448c9>] ? task_rq_unlock+0x11/0x13
然后在metalink文档 ID 549932.1中发现如下一些信息
APPLIES TO:
Oracle Net Services - Version 10.2.0.1 to 11.1.0.7 [Release 10.2 to 11.1]
Generic UNIX
***Checked for relevance on 22-MAR-2013***
SYMPTOMS
· There may be heavy load on the CPU shooting up to 100%.
· The number of sessions in the database is well below the upper or maximum limit defined in the parameter file.
· The listener crashes suddenly during this heavy CPU load generating the core.
· (Optional) Listener.Ora has SUBSCRIBE_FOR_NODE_DOWN_EVENT_LISTENER=OFF.
Listener Log:
-------------
.....
.....
19-NOV-2007 13:40:49 * (CONNECT_DATA=(SID=ORAC)(CID=(PROGRAM=C:\pegasos\te\usys\bin\uniface.exe)(HOST=TERVI-NB179)(USER=kjokioja))) * (ADDRESS= (PROTOCOL=tcp)(HOST=10.12.152.5)(PORT=1670)) * establish * ORAC * 12518
TNS-12518: TNS:listener could not hand off client connection
TNS-12571: TNS:packet writer failure
TNS-12560: TNS:protocol adapter error
TNS-00530: Protocol adapter error
Linux Error: 104: Connection reset by peer
19-NOV-2007 13:40:49 * (CONNECT_DATA=(SID=ORAC)(CID=(PROGRAM=C:\pegaos\te\usys\bin\uniface.exe)(HOST=TERVI-0184A)(USER=paitasal))) * (ADDRESS=(PROTO COL=tcp)(HOST=10.12.176.136)(PORT=1574)) * establish * ORAC * 12518
TNS-12518: TNS:listener could not hand off client connection
TNS-12547: TNS:lost contact
TNS-12560: TNS:protocol adapter error
TNS-00517: Lost contact
Linux Error: 32: Broken pipe
.........
........
The Operating system log (/var/log/messages) may show the following :
tnslsnr[5841]: segfault at 0000000000000018 rip 0000003eab66854d rsp 0000007fbfff9230 error 4
tnslsnr[6469]: segfault at 0000000000000018 rip 0000003eab66854d rsp 0000007fbfff9420 error 4
tnslsnr[7375]: segfault at 0000000000000018 rip 0000003eab668bb3 rsp 0000007fbfff9c70 error 4
Gdb on the core file generated shows the following stack :
#gdb /home/oracle/db_1/bi/tnslsnr core.7375 Core was generated by `/opt/oracle/ora102/bin/tnslsnr LISTENER -inherit'.
Program terminated with signal 11, Segmentation fault.
Reading symbols from /opt/oracle/ora102/lib/libclntsh.so.10.1...(no debugging symbols found)...done.
........
.........
(gdb) bt
#0 0x00000032b7468bb3 in _int_free () from /lib64/tls/libc.so.6
#1 0x00000032b74691f6 in free () from /lib64/tls/libc.so.6
#2 0x000000000040f01f in nsglhe ()
#3 0x00000000004114e9 in nsglma ()
#4 0x00000000004061cb in main ()
(gdb) where
#0 0x00000032b7468bb3 in _int_free () from /lib64/tls/libc.so.6
#1 0x00000032b74691f6 in free () from /lib64/tls/libc.so.6
#2 0x000000000040f01f in nsglhe ()
#3 0x00000000004114e9 in nsglma ()
#4 0x00000000004061cb in main ()
The core indicates that the program terminated with signal 11, Segmentation fault .
SIGSEGV is reported for improper memory handling .The default action for a program upon receiving
SIGSEGV is abnormal termination. This action will end the process.
The virtual memory stats (vmstat) output may show huge paging/swapping activity .
For Example:
-------------
$vmstat 5 7 The si and so column under the swap section suggests the amount of memory swapped in from disk (/s)and amount of memory swapped to disk (/s) respectively.
procs memory swap io system cpu
r b w swpd free buff cache si so bi bo in cs us sy id
2 0 0 27124 3940 1160 74528 0 1304 956 5360 272 191 51 21 98
3 0 0 27080 3756 1180 72580 0 260 2552 388 218 429 90 10 89
14 2 1 26808 5096 1188 69868 84 1108 2016 9064 490 567 59 22 96
4 0 0 25548 5912 1192 73032 0 0 436 0 478 736 50 50 0
5 0 0 25548 3940 1192 73548 0 0 1560 0 301 385 93 7 0
1 1 1 25548 3336 1192 71800 8 176 2848 432 258 147 91 9 88
1 0 0 25544 4124 1200 70480 116 60 836 60 171 200 97 3 92
Note: You may also use the top command to check the system memory usage.
CAUSE
Extensive paging/swapping activity is a clear indication that the system is running out of the physical memory.
SOLUTION
Solution :
1. Increase the physical memory of the system.
OR
2. Apply the Patch 6139856 for unpublished Bug 6139856 if available for your platform.
OR
3. Configure Hugepages on the OS. Ref : Note 361323.1
A Note on HugePages:
Hugepages is a mechanism that allows the Linux kernel to utilise the multiple page size capabilities of modern hardware architectures. Its important to know that utilising a huge amount of physical memory with the default page size consumes the TLB and adds processing overhead. The Linux kernel is able to set aside a portion of physical memory to be able be addressed using a larger page size. Since the page size is higher, there will be less overhead managing the pages with the TLB. In the Linux 2.6 series of kernels, hugepages is enabled using the CONFIG_HUGETLB_PAGE feature when the kernel is built. Systems with large amount of memory can be configured to utilise the memory more efficiently by setting aside a portion dedicated for hugepages. The actual size of the page is dependent on the system architecture. A typical x86 system will have a Huge Page Size of 2048 kBytes. The huge page size may be found by looking at the /proc/meminfo :
# cat /proc/meminfo |grep Hugepagesize Hugepagesize: 2048 kB
For more on configuring Hugepages please refer Note 361323.1
REFERENCES
BUG:6752308 - LISTENER DIED BY SEGFAULT AFTER TNS ERROR
NOTE:361323.1 - HugePages on Linux: What It Is... and What It Is Not...
如上官方文档所示,有三个解决方案:
1: 增加系统物理内存
2: 打补丁Patch 6139856
3: 启用HugePage设置
鉴于当时操作系统有100多天没有重启过了,于是在2014-12-12 23:00重启了一下Linux服务器,到目前为止已经运行了3天,暂时没有出现这个错误。因为有可能一些内存泄露也会导致内存资源不足情况,例如,TNSListener Leaking Memory Using Dedicated Server (文档 ID 785742.1)。所以暂时没有实施上面方案2、3、想运行一段时间,验证一下自己的想法,如果还是出现这个错误,则尝试方案2、3、
[root@ceglnx01 ~]# who -b
system boot 2014-12-12 23:11
从另外一方面分析,在凌晨2点过几分出现这个错误,是因为,有两个比较大的作业在此时运行。消耗的服务器资源比较大,所以也从侧面验证了内存资源不足。
另外,在网上看到listener.log日志文件大于2G时,也可能出现这个问题。所以有时候也需要排查“监听日志文件过大可能也是导致监听器自己服务宕掉”。
参考资料:
http://blog.itpub.net/23135684/viewspace-675750
TNS-12518 & Linux Error:32:Broken pipe的更多相关文章
- 【故障•监听】TNS-12518、TNS-00517和 Linux Error:32:Broken pipe
[故障|监听]TNS-12518.TNS-00517和 Linux Error:32:Broken pipe 1.1 BLOG文档结构图 1.2 前言部分 1.2.1 导读和注意事项 各位技术爱 ...
- docker运行镜像报错:"write init-p: broken pipe"
docker: Error response from daemon: OCI runtime create failed: container_linux.go:344: starting cont ...
- linux每日命令(32):gzip命令
减少文件大小有两个明显的好处,一是可以减少存储空间,二是通过网络传输文件时,可以减少传输的时间.gzip是在Linux系统中经常使用的一个对文件进行压缩和解压缩的命令,既方便又好用.gzip不仅可以用 ...
- Linux error numbers
Linux error numbers, straight from the horse's mouth. #define EPERM 1 /* Operation not permitted */ ...
- Python的问题解决: IOError: [Errno 32] Broken pipe
被该问题困扰的人还是挺多的,所以又对这个问题进行了一些更深入的分析,希望可以解决读者的问题新版本:Python 的 Broken Pipe 错误问题分析 遇到一个很奇怪的问题, web.py代码里面报 ...
- Linux(CentOS)上配置 SFTP(附解决Write failed: Broken pipe Couldn't read packet: Connection reset by peer)
#创建sftp组: groupadd sftp #创建一个用户sftpuser: useradd -g sftp -s /bin/false sftpuser #提示: /etc/group 文件包含 ...
- (转) 解决ssh的"Write failed: Broken pipe"问题
解决ssh的"Write failed: Broken pipe"问题 问题场景 服务器环境:阿里云 Linux CentOS 主机 客户端:Mac OSX Terminal ...
- ssh 登录报错 packet_write_wait: Connection to x.x.x.x port 22: Broken pipe
问题 更新个人博客文章时遇到:Error: packet_write_wait: Connection to 192.30.253.113 port 22: Broken pipe packet_wr ...
- POI 导入导出时异常[java.io.IOException: Broken pipe]
使用用POI导出文件时抛出异常java.io.IOException: Broken pipe ERROR: 'java.io.IOException: Broken pipe' org.apache ...
随机推荐
- UIScrollView的delaysContentTouches与canCencelContentTouches属性
UIScrollView有一个BOOL类型的tracking属性,用来返回用户是否已经触及内容并打算开始滚动,我们从这个属性开始探究UIScrollView的工作原理: 当手指触摸到UIScrollV ...
- Android Conflict with nineoldandroids等报错
问题 报错:Conflict with nineoldandroids 原因 我在引入Fresco时由于其中也包含nineoldandroids这个库,导致库的冲突,相关的库冲突都是因为这个问题导致的 ...
- 用大白话聊聊JavaSE -- 自定义注解入门
注解在JavaSE中算是比较高级的一种用法了,为什么要学习注解,我想大概有以下几个原因: 1. 可以更深层次地学习Java,理解Java的思想. 2. 有了注解的基础,能够方便阅读各种框架的源码,比如 ...
- SQL Server 2016里的sys.dm_exec_input_buffer
在你的DBA职业里,你们谁有用过DBCC INPUTBUFFER命令,来获得已经提交到SQL Server特定会话的最后SQL语句?请举手!大家都用过! 我们都知道DBCC命令有点尴尬,因为你不能在T ...
- Struts2 源码分析——配置管理之ContainerProvider接口
本章简言 上一章笔者讲到关于Dispatcher类的执行action功能,知道了关于执行action需要用到的信息.而本章将会讲到的内容也跟Dispatcher类有关系.那就是配置管理中的Contai ...
- 通知中心 NSNotificationCenter 的简单使用方法
NSNotificationCenter(通知中心) [注意]需再dealloc中移除观察者 获取通知中心单例对象 NSNotificationCenter *center=[NSNotifi ...
- Windows 10预览版14316开启Bash命令支持
00x0 前言 4月7日凌晨,微软推送了最新的Windows 10一周年更新预览版14316,其中重要的是原生支持Linux Bash命令行支持. 00x1 问题 如何开启Linux Bash命令行? ...
- Web页面实现后台数据处理进度与剩余时间的显示
1.页面后台代码添加如下属性: /// <summary> /// 总数 /// </summary> private double total { set { Session ...
- jQuery图片轮播特效
效果预览:http://hovertree.com/texiao/jquery/51/ 这款特效有缩略图,包含文字说明和链接,可以自动播放,也可以手动切换. 使用的jQuery库版本为1.12.3 , ...
- luogg_java学习_10_异常_反射
本文为博主辛苦总结,希望自己以后返回来看的时候理解更深刻,也希望可以起到帮助初学者的作用. 转载请注明 出自 : luogg的博客园 谢谢配合! 异常_反射 异常 异常就是导致程序中断执行的一段指令流 ...