gprof + kprof + gprof2dot (性能 与 函数调用图)-
http://www.cnblogs.com/rocketfan/archive/2009/11/15/1603465.html
http://blog.csdn.net/stanjiang2010/article/details/5655143
http://blog.csdn.net/stanjiang2010/article/details/5655143
三种方案:

1.程序编绎加 -PG:
   g++ -pg -g  -o test test.cc
./test //运行后生成gmon.out
gprof ./test > prof.log
2. KProf 是gprof 版本////注意已经按照前面的用gprof生成 gmont.out 了
kprof -f ./test
3. gprof2dot.py 与 xdot:生成图像清晰,相对于KProf
gprof ./test | gprof2dot.py | xdot
gprof:系统自带
https://sourceware.org/binutils/docs/gprof/
https://sourceware.org/binutils/
The GNU Binutils are a collection of binary tools. The main ones are:
- ld - the GNU linker.
- as - the GNU assembler.
But they also include:
- addr2line - Converts addresses into filenames and line numbers.
- ar - A utility for creating, modifying and extracting from archives.
- c++filt - Filter to demangle encoded C++ symbols.
- dlltool - Creates files for building and using DLLs.
- gold - A new, faster, ELF only linker, still in beta test.
- gprof - Displays profiling information.
- nlmconv - Converts object code into an NLM.
- nm - Lists symbols from object files.
- objcopy - Copies and translates object files.
- objdump - Displays information from object files.
- ranlib - Generates an index to the contents of an archive.
- readelf - Displays information from any ELF format object file.
- size - Lists the section sizes of an object or archive file.
- strings - Lists printable strings from files.
- strip - Discards symbols.
- windmc - A Windows compatible message compiler.
- windres - A compiler for Windows resource files.
kprof

http://kprof.sourceforge.net/

        % tar xvfz kprof-1.4.1.tar.gz

    	% cd kprof-1.4.1

    	% ./configure --prefix=(where KDE is installed, for example /opt/kde3)

    	% make

    	% su

    	enter your root password

    	# make install
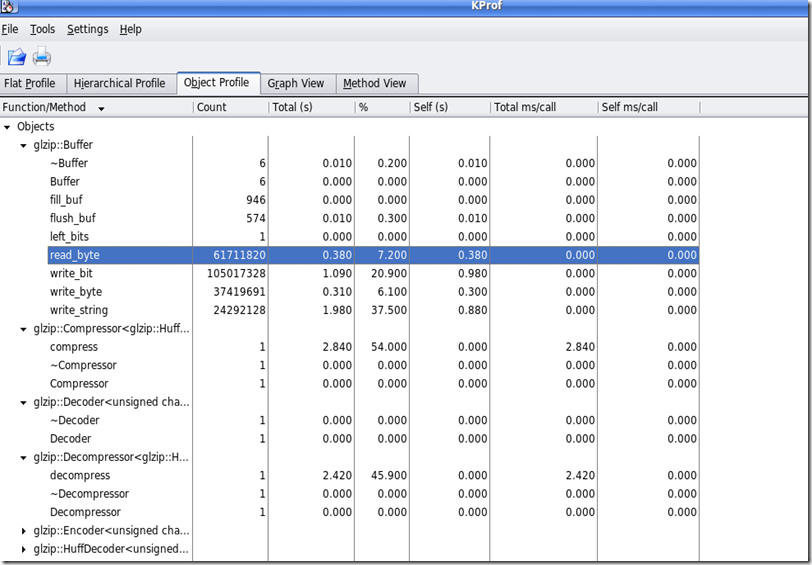
KProf is a visual tool for developers, which displays the execution profiling output generated by code profilers.
The output of profilers being usually difficult to read (beyond the flat profile information),
KProf presents the information in list- or tree-views that make the information very easy to understand.

KProf provides access to the following features:

    Flat profile view displays all function / methods and their profiling information.

    Hierarchical profile view displays a tree for each function / method with the other functions / methods it calls as subelements.

    Object profile view, for C++ developers, groups the methods in a tree view by object name.

    Graph view is a graphical representation of the call-tree, requires GraphViz to work.

    Method view is a more detailed look at an individual method - cross referenced.

    Recursive functions carry a special icon to clearly show that they are recursive.

    Right-clicking a function or method displays a pop-up with the list of callers and called functions.
You can directly go to one of these functions by selecting it in the pop-up menu.

    The flat profile view provides an additional filter edit box to filter the display and show only the functions or methods
 containing the text that you enter.

    Function parameters hiding if the function name is unique (i.e. no different signatures)

    C++ template abbreviation (template parameters can be hidden)

    Automatic generation of call-graph data for GraphViz and VCG, two popular graph image generators.

    Diff mode support to compare two profile results.
gprof2dot     (.txt----->.dot)

https://github.com/jrfonseca
xdot.py是 一个图形可交互查看器,采用Graphviz的 dot 语言开发      (DOT文件------>图像生成)

https://github.com/jrfonseca/xdot.py

gprof + kprof + gprof2dot (性能 与 函数调用图)-的更多相关文章
- linux环境下 C++性能测试工具 gprof + kprof + gprof2dot
1.gprof 很有名了,google下很多教程 g++ -pg -g -o test test.cc ./test //会生成gmon.out gprof ./test > prof.l ...
- 高级工具gprof、gprof2dot.py、dot
可以研究程序性能.函数调用堆栈等,而且能用图标查看. linux环境下 C++性能测试工具 gprof + kprof + gprof2dot - 阁子 - 博客园 gprof.gprof2dot.p ...
- 『MXNet』第六弹_Gluon性能提升 静态图 动态图 符号式编程 命令式编程
https://www.cnblogs.com/hellcat/p/9084894.html 目录 一.符号式编程 1.命令式编程和符号式编程 2.MXNet的符号式编程 二.惰性计算 用同步函数实际 ...
- 看开源代码利器—用Graphviz + CodeViz生成C/C++函数调用图(call graph)
一.Graphviz + CodeViz简单介绍 CodeViz是<Understanding The Linux Virtual Memory Manager>的作者 Mel Gorma ...
- WEB 性能优化导图
看了一下网上对于web性能优化的一些帖子,不是很直观,花了点时间画了一个思维导图. refers: https://segmentfault.com/a/1190000011936772 https: ...
- doxygen+graphviz轻松绘制函数调用图(call graph)
前言 之前的工作环境习惯了使用source insight查看函数分析代码,切换到mac下后改用vscode,发现缺少函数调用关系图生成.跨平台的understand可以很好的解决,但是公司没有购买, ...
- Core Data 和 sqlite3的性能对比【图】3gs,iPhone4,4s,5的性能测试。
demo 和源码再此下载 :http://download.csdn.net/detail/hherima/5603797
- 看开源代码利器—用Graphviz + CodeViz生成C/C++函数调用图(call graph) - 转
From http://www.linuxidc.com/Linux/2015-01/111501.htm 实际按照上文操作,主要是安装gcc-4.6.2出现一些问题,原先在cygwin下安装,结果提 ...
- [转] 2018年最新桌面CPU性能排行天梯图(含至强处理器)
[FROM] http://www.idn100.com/zuzhuangdiannaopeizhi-pc2849/ 排名 处理器 图例 分数 1 Intel Xeon Platinum 8173M ...
随机推荐
- sql数据库优化技巧汇总
(转)SQL 优化原则 一.问题的提出 在应用系统开发初期,由于开发数据库数据比较少,对于查询SQL语句,复杂视图的的编写等体会不出SQL语句各种写法的性能优劣,但是如果将应用系统提交实际应用后,随着 ...
- uboot的mtd功能支持
一.概述 1.MTD MTD是Flash的一种管理方法,将Flash划分成几个分区,便于管理. u-boot的MTD功能是在文件cmd_jffs2.c中实现的,由此我们可以知道怎样打开u-boot的M ...
- PS证件照换背景
综述 博主原创内容. 在PS里,对于抠图,比较有技术含量的便是抠头发丝了,下面为大家带来一个比较详细的抠头发丝的教程. 素材准备 在这里我们用这张图片作为抠图素材,下面让我们一步步来演示抠图的过程,并 ...
- Noah的学习笔记之Python篇:装饰器
Noah的学习笔记之Python篇: 1.装饰器 2.函数“可变长参数” 3.命令行解析 注:本文全原创,作者:Noah Zhang (http://www.cnblogs.com/noahzn/) ...
- C51应用 Modbs Rtu协议实现与KEPServerEx 通信
最近一客户要求使用STC12C5A60S2实现Modbus Rtu协议与KEPServerEx V4.0软件通信,采集单片机P2口每位的状态,设置P0口每位的状态,实现三路AD转换其中一路采集的是C0 ...
- jquery判断邮箱格式问题
方法一: var search_str = /^[\w\-\.]+@[\w\-\.]+(\.\w+)+$/; var email_val = $("#Email").val(); ...
- Spring MVC 解读——<context:component-scan/>
转自:http://my.oschina.net/HeliosFly/blog/203149 作者:GoodLoser. Spring MVC 解读---<context:component-s ...
- Android开源项目发现--- 工具类数据库ORM篇(持续更新)
orm的db工具类,简化建表.查询.更新.插入.事务.索引的操作 1. greenDAO Android Sqlite orm的db工具类 项目地址:https://github.com/greenr ...
- C 常用的输入输出 栈 哈希 文件写读 实现 字符串处理
#include "stdafx.h"#include <stdio.h>#include <string.h>#include <stdlib.h& ...
- 【HDOJ】1728 逃离迷宫
题目大坑,注意行列顺序式反的,另外注意起点和终点相同. #include <iostream> #include <cstdio> #include <cstring&g ...