
linux c 及 c++打印调用者函数caller function的方法,包括arm c平台
一般情况下,编译的时候可能需要加 -g 选项,对于android ndk的-g选项添加请参见android类目下的另一篇文章。
以下文章中的__builtin_return_address() 宏,若要确认它是否在编译器源码中存在,可以在编译器源码中搜索 return_address, 若找到则可以直接使用(不同架构的编译器调用方法可能不同),而且同时也搜索到了需要包含哪些头文件。
__builtin_return_address() 宏简单好用,如果只支持层级0,则只有不断的循环用0来找调用者的调用者了。
http://codingrelic.geekhold.com/2009/05/pre-mortem-backtracing.html
A backtrace is often the first step in debugging a problem. Generating a backtrace is generally thought of as a function of the debugger, on a core file after a process has died. However it is sometimes quite useful to generate a live backtrace while a process runs. For example, crashing the process in the field may not be acceptable if a problem is survivable. Logging a backtrace and other information can provide enough to locate the root cause, without having to trigger any customer downtime.
gcc backtrace support
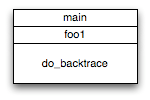 The simplest way to get a crude backtrace is the __builtin_return_address() macro supplied by gcc. You provide the frame number you want to retrieve, and get the return address for that stack frame:
void do_backtrace2()

{

    void *pc0 = __builtin_return_address(0);

    void *pc1 = __builtin_return_address(1);

    void *pc2 = __builtin_return_address(2);

    void *pc3 = __builtin_return_address(3);

    printf("Frame 0: PC=%p\n", pc0);

    printf("Frame 1: PC=%p\n", pc1);

    printf("Frame 2: PC=%p\n", pc2);

    printf("Frame 3: PC=%p\n", pc3);

}
This code will produce the following output:
Frame 0: PC=0x80483ca

Frame 1: PC=0x80483e1

Frame 2: PC=0x62079d

Frame 3: PC=0x80482b9
__builtin_return_address() has significant limitations. It constructs code at compile time to walk back through the stack frames. That means you cannot use a variable in a loop, you can only use integer constants like the 0,1,2,3 shown above. Also on some architectures, including my beloved MIPS, only __builtin_return_address(0) works. MIPS has no frame pointer, making it difficult to walk back up the stack. Frame 0 can use the return address register directly.
glibc's backtrace()
glibc contains a simple backtrace function, which is somewhat more powerful than __builtin_return_address(). The backtrace() call populates an array with the program counter of each calling function, while a separate backtrace_symbols() call can look up the symbolic names for each address:
#include <execinfo.h>

#define BACKTRACE_SIZ   64

void do_backtrace()

{

    void    *array[BACKTRACE_SIZ];

    size_t   size, i;

    char   **strings;

    size = backtrace(array, BACKTRACE_SIZ);

    strings = backtrace_symbols(array, size);

    for (i = 0; i < size; i++) {

        printf("%p : %s\n", array[i], strings[i]);

    }

    free(strings);  // malloced by backtrace_symbols

}
The output shows the backtrace with the address of each function call site:
# gcc -g -o backtrace ./backtrace.c

# ./backtrace

0x8048422 : ./backtrace(backtrace_symbols+0xd6) [0x8048422]

0x80484be : ./backtrace(backtrace_symbols+0x172) [0x80484be]

0x80484d5 : ./backtrace(backtrace_symbols+0x189) [0x80484d5]

0x071479d : /lib/tls/libc.so.6(__libc_start_main+0xed) [0x71479d]

0x804837d : ./backtrace(backtrace_symbols+0x31) [0x804837d]
To get useful symbolic names, the -rdynamic option must be passed to the linker:
# gcc -g -rdynamic -o backtrace ./backtrace.c

# ./backtrace

0x804874a : ./backtrace(do_backtrace+0x1a) [0x804874a]

0x80487e6 : ./backtrace(foo1+0xb) [0x80487e6]

0x80487fd : ./backtrace(main+0x15) [0x80487fd]

0x012679d : /lib/tls/libc.so.6(__libc_start_main+0xed) [0x12679d]

0x80486a5 : ./backtrace(backtrace_symbols+0x31) [0x80486a5]
There is also a backtrace_symbols_fd() function, which nicely prints the output to a file descriptor without having to malloc a table of strings. If thats all you're trying to do, it is a simpler API.
As an aside: notice how the address of __libc_start_main varies in the examples above, 0x62079d versus 0x71479d versus 0x12679d? That is address space randomization in action. libc is mapped at a randomized base address every time a binary is started. The offset of __libc_start_main within the page is a constant 0x79d, but the upper bits of the address will vary from one run to the next. This helps prevent buffer overflow and other code injection attacks, by randomizing the address of library routines.
libunwind
libunwind is a library for extracting call chain information. It supports many different CPU architectures. Here is an example of using libunwind to accomplish a similar result as glibc's backtrace() function:
#include <libunwind.h>

void do_backtrace2()

{

    unw_cursor_t    cursor;

    unw_context_t   context;

    unw_getcontext(&context);

    unw_init_local(&cursor, &context);

    while (unw_step(&cursor) > 0) {

        unw_word_t  offset, pc;

        char        fname[64];

        unw_get_reg(&cursor, UNW_REG_IP, &pc);

        fname[0] = '\0';

        (void) unw_get_proc_name(&cursor, fname, sizeof(fname), &offset);

        printf ("%p : (%s+0x%x) [%p]\n", pc, fname, offset, pc);

    }

}
The output:
0x80486b3 : (foo+0xb) [0x80486b3]

0x80486ca : (main+0x15) [0x80486ca]

0x016379d : (__libc_start_main+0xed) [0x16379d]

0x80484c9 : (_start+0x21) [0x80484c9]
That is quite a bit more code to get a simple backtrace, but libunwind offers more capability to examine the program state at each frame. For example, one can print the saved register values:
#include <libunwind.h>

void do_backtrace2()

{

    unw_cursor_t    cursor;

    unw_context_t   context;

    unw_getcontext(&context);

    unw_init_local(&cursor, &context);

    while (unw_step(&cursor) > 0) {

        unw_word_t  offset;

        unw_word_t  pc, eax, ebx, ecx, edx;

        char        fname[64];

        unw_get_reg(&cursor, UNW_REG_IP,  &pc);

        unw_get_reg(&cursor, UNW_X86_EAX, &eax);

        unw_get_reg(&cursor, UNW_X86_EDX, &edx);

        unw_get_reg(&cursor, UNW_X86_ECX, &ecx);

        unw_get_reg(&cursor, UNW_X86_EBX, &ebx);

        fname[0] = '\0';

        unw_get_proc_name(&cursor, fname, sizeof(fname), &offset);

        printf ("%p : (%s+0x%x) [%p]\n", pc, fname, offset, pc);

        printf("\tEAX=0x%08x EDX=0x%08x ECX=0x%08x EBX=0x%08x\n",

                eax, edx, ecx, ebx);

    }

}
The output:
0x80486b3 : (foo1+0xb) [0x80486b3]

 EAX=0x00000000 EDX=0x00b548b0 ECX=0x00000000 EBX=0x00000000

0x80486ca : (main+0x15) [0x80486ca]

 EAX=0x00000000 EDX=0x00b548b0 ECX=0x00000000 EBX=0x00000000

0x044879d : (__libc_start_main+0xed) [0x44879d]

 EAX=0x00000000 EDX=0x003368b0 ECX=0x00000000 EBX=0x00000000

0x80484c9 : (_start+0x21) [0x80484c9]

 EAX=0x00000000 EDX=0x00b548b0 ECX=0x00000000 EBX=0x00000000
When would this be useful? Given the relative costs, it is not unusual to have an embedded CPU with considerably more RAM than flash. In the event of a crash there may not be enough flash to save a full core file. Having the process deliberately catch SIGSEGV and dump its own backtrace with register values means you'd at least have something to work with even if there is no core file.
Conclusion
Over time I think I have used __builtin_return_address(0) more often than any of the other techniques. Whether constructing simple performance instrumentation or logging problems from the field, knowing the caller has often been sufficient. For more extensive backtrace functionality I end up using libunwind. The backtrace() function in glibc always seems to be too heavy for the simple stuff yet not sufficient for the complex stuff.
linux c 及 c++打印调用者函数caller function的方法,包括arm c平台的更多相关文章
- 【Linux开发】为qt-embedded添加jpeg库的交叉编译方法for arm
看了一个文章: =====================================谢论坛内各位的帮助,我的qt/e2.3.10和qtopia2.1.1终于全部编译通过. 下面是jpeg和uui ...
- Linux 内核启动信息的打印 --- dev_driver_string函数/dev_name函数
内核启动时,常会打印出一些信息:开头是 "驱动模块的名字: + 具体的信息" 如:在运行的linux系统设备上,插入鼠标,就会打印出鼠标的相关信息; [ 402.134068] i ...
- 使用linux backtrace打印出错函数堆栈信息
一般察看函数运行时堆栈的方法是使用GDB(bt命令)之类的外部调试器,但是,有些时候为了分析程序的BUG,(主要针对长时间运行程序的分析),在程序出错时打印出函数的调用堆栈是非常有用的. 在glibc ...
- linux 内核(驱动)常用函数
2.4.1 内存申请和释放 include/linux/kernel.h里声明了kmalloc()和kfree().用于在内核模式下申请和释放内存. void *kmalloc(unsigned ...
- PHP 打印调用函数入口地址(堆栈)
今天网站出现一个BUG,然后直接在数据库类里面写日志,看是哪条SQL出了问题,SQL语句到是找到了,但是不知道这条SQL语句来自何处,于是就想啊,如果能有一个办法,查看当前正在运行的这个方法是被哪个方 ...
- linux下c程序调用reboot函数实现直接重启【转】
转自:http://www.blog.chinaunix.net/uid-20564848-id-73878.html linux下c程序调用reboot函数实现直接重启 当然你也可以直接调用syst ...
- PHP 打印调用函数入口地址(堆栈),方便调式
今天网站出现一个BUG,然后直接在数据库类里面写日志,看是哪条SQL出了问题,SQL语句到是找到了,但是不知道这条SQL语句来自何处,于是就想啊,如果能有一个办法,查看当前正在运行的这个方法是被哪个方 ...
- linux网络编程九:splice函数,高效的零拷贝
from:http://blog.csdn.net/jasonliuvip/article/details/22600569 linux网络编程九:splice函数,高效的零拷贝 最近在看<Li ...
- Linux pwn入门教程(10)——针对函数重定位流程的几种攻击
作者:Tangerine@SAINTSEC 本系列的最后一篇 感谢各位看客的支持 感谢原作者的付出一直以来都有读者向笔者咨询教程系列问题,奈何该系列并非笔者所写[笔者仅为代发]且笔者功底薄弱,故无法解 ...
随机推荐
- 自己画一个ActivityIndicatorView-b
苹果的UI控件中有一个UIActivityIndicatorView,俗称菊花.→_→现在我们仿照它来制作一个其它样式的指示器,如下: ActivityView.png 自定义指示器 首先画一个白色的 ...
- Android Learning:微信第三方登录
这两天,解决了微信第三方授权登录的问题,作为一个新手,想想也是一把辛酸泪.我想着,就把我的遇到的坑给大家分享一下,避免新手遇到我这样的问题能够顺利避开. 步骤一 微信开发者平台 我开始的解决思路是,去 ...
- c# 获取MP3和AMR文件格式的时长
//网上摘录整理private long GetAMRFileDuration(string fileName) { ; FileStream fs = new FileStream(fileName ...
- css中table-layout:fixed 属性的用法
table-layout:fixed 属性的用法:如果想要一个table固定大小,里面的文字强制换行(尤其是在一长串英文文本,并且中间无空格分隔的情况下),以达到使过长的文字 不撑破表格的目的,一般是 ...
- Searching for Approximate Nearest Neighbours
Searching for Approximate Nearest Neighbours Nearest neighbour search is a common task: given a quer ...
- 【NOIP 2012 国王游戏】 贪心+高精度
题目描述 恰逢 H 国国庆,国王邀请 n 位大臣来玩一个有奖游戏.首先,他让每个大臣在左.右 手上面分别写下一个整数,国王自己也在左.右手上各写一个整数.然后,让这 n 位大臣排 成一排,国王站在队伍 ...
- [topcoder]FoxAndChess
http://community.topcoder.com/stat?c=problem_statement&pm=12725&rd=15702 这题比较简单.首先所有的LR的顺序要一 ...
- [topcoder]SmartWordToy
广度搜索BFS,要用Queue.还不是很熟,这道题帮助理清一些思绪了.其实这道题是求最短路径,所以BFS遇到第一个就可以返回了,所以后面有些现有大小和历史大小的判断可以省却. 过程中拿数组存step还 ...
- LINUX下安装PHP(CGI模式)和NGINX[转]
安装所需依赖 yum -y install gcc gcc-c++ autoconf libjpeg libjpeg-devel libpng libpng-devel freetype freety ...
- js中replace用法
js中replace的用法 replace方法的语法是:stringObj.replace(rgExp, replaceText) 其中stringObj是字符串(string),reExp可以是正则 ...