Python自动化办公--Pandas玩转Excel【一】
相关文章:
Python自动化办公--Pandas玩转Excel数据分析【二】
Python自动化办公--Pandas玩转Excel数据分析【三】_汀、的博客-CSDN博客
python处理Excel实现自动化办公教学(含实战)【一】
python处理Excel实现自动化办公教学(含实战)【二】
python处理Excel实现自动化办公教学(数据筛选、公式操作、单元格拆分合并、冻结窗口、图表绘制等)【三】
python入门之后须掌握的知识点(模块化编程、时间模块)【一】
python入门之后须掌握的知识点(excel文件处理+邮件发送+实战:批量化发工资条)【二】
pandas玩转excel码源.zip-数据挖掘文档类资源-CSDN下载 码源
1.基础温故【Pandas】
1.1 创建文件
import pandas as pd

df = pd.DataFrame()

df.to_excel('001.xlsx') #可以指定路径

#df.to_excel('H:\\Anaconda\\001.xlsx')

df = pd.DataFrame({'id':[1,2,3],'name':['a','b','c']})

df.to_excel('001-data.xlsx')

df = pd.DataFrame({'id':[1,2,3],'name':['a','b','c']})

df = df.set_index('id')

df.to_excel('001-data-index.xlsx')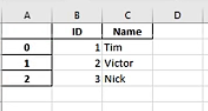
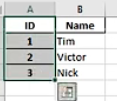
第一幅图索引默认在A列,通过set_index把ID设置为索引。
1.2 读取excel中的数据

脏数据处理:第一行错误数据,或者没有数据
import pandas as pd

people = pd.read_excel('people001.xlsx')

print(people.shape)

print(people.columns)

# 默认打印3行

print(people.head())

print(people.head(3))

# 默认打印5行

print(people.tail())

#脏数据处理:第一行错误数据,或者没有数据

#存在空行会自动识别并跳过,获取列名

people = pd.read_excel('people002.xlsx',header=1)

print(people.columns)

#脏数据处理:第一行没有列名,添加列名

people = pd.read_excel('people003.xlsx',header=None)

people.columns = ['ID', 'Type', 'Title', 'FirstName', 'MiddleName', 'LastName']

people = people.set_index('ID',inplace=True)

people.to_excel('output.xlsx')
其中在colums中是把列名和索引区别的,
people = people.set_index('ID',inplace=True)

#设置完index后,

print(people.columns)

#显示

'Type', 'Title', 'FirstName', 'MiddleName', 'LastName'
再次读取时:id还是会当作列

这时候在读取的时候需要设置index,即可。
import pandas as pd

people = pd.read_excel('people001.xlsx',index_col="ID")
1.3 生成列、行、单元格(Series)
Series和python中的字典类似,下面是几种创建方法:
import pandas as pd

d = {

    'x':100,

    'y':200,

    'z':300,

}

print(d.values())

print(d.keys())

s1 = pd.Series(d)

print(s1.index)

L1 = [100,200,300]

L2 = ['x','y','z']

s2 = pd.Series(L1,index=L2)

print(s2.index)

s3 = pd.Series([100,200,300],index=['x','y','z'])

print(s3.index)
创建一个简单的列表:行列不同形式添加。


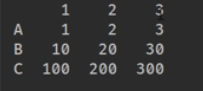
index是默认对齐的方式,如果不相同会用NaN填充。

1.4 自动填充功能【数据区域读取填充数字】
1.4.1 数值填充
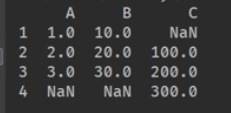
原始数据:只有name(书名)进行填充数据

数据区域不是定格,无法自动识别
import pandas as pd

books = pd.read_excel('books.xlsx',skiprows=4,usecols='C:F',index_col=None)

#usecols='C,D,E,F',填充完再设置index_col

print(books)

#NaN填充的dtype是float64
import pandas as pd

books = pd.read_excel('books.xlsx',skiprows=4,usecols='C:F',index_col=None)

for i in books.index:

    books["ID"].at[i]=i+1

print(books)
为了显示为整型,先把类型设置为str
import pandas as pd

books = pd.read_excel('books.xlsx',skiprows=4,usecols='C:F',index_col=None,dtype={"ID":str,"InStore":str,"Date":str})

for i in books.index:

    books["ID"].at[i]=i+1

print(books)
import pandas as pd

books = pd.read_excel('books.xlsx',skiprows=4,usecols='C:F',index_col=None,dtype={"ID":str,"InStore":str,"Date":str})

for i in books.index:

    books["ID"].at[i]=i+1

    books["InStroe"].at[i]="yes" if i%2==0 else "no"

print(books)
import pandas as pd

from datetime import date, timedelta

books = pd.read_excel('books.xlsx',skiprows=4,usecols='C:F',index_col=None,dtype={"ID":str,"InStore":str,"Date":str})

start=date(2018,1,1)

for i in books.index:

    books["ID"].at[i]=i+1

    books["InStroe"].at[i]="yes" if i%2==0 else "no"

    books["Date"].at[i]=start+timedelta(days=i)  #没有年月 month year; 时分秒有

    #books["Date"].at[i]=date(start.year+i,start.month,start.day)

print(books)

月份相加需要计算一下,定义个子函数
import pandas as pd

from datetime import date, timedelta

def add_month[d, md):

    yd=md/12

    m=d.month+md%12

    if m!= 12:

        yd+=m/12

        m=m%12

    return date(d.year + yd,m, d.day)

books = pd.read_excel('books.xlsx',skiprows=4,usecols='C:F',index_col=None,dtype={"ID":str,"InStore":str,"Date":str})

start=date(2018,1,1)

for i in books.index:

    books["ID"].at[i]=i+1

    books["InStroe"].at[i]="yes" if i%2==0 else "no"

    books["Date"].at[i]=start+timedelta(days=i)  #没有年月 month year; 时分秒有

    #books["Date"].at[i]=date(start.year+i,start.month,start.day)

    #books["Date"].at[i]=add_month(start,i)

#print(books)

books.set_index("ID",inplace=True)

books.to_excel("output/xlsx")

还有一种写法不改series直接改单元格写法如下:
for i in books.index:

    booksat[i,"ID"]]=i+1

    books.at[i,"InStroe"]="yes" if i%2==0 else "no"

    books.at[i,"Date"]=start+timedelta(days=i)  #没有年月 month year; 时分秒有

    #books["Date"].at[i]=date(start.year+i,start.month,start.day)

    #books["Date"].at[i]=add_month(start,i)

#print(books)
1.4.2 计算填充(列操作)

列相乘,操作符重载【不用循环计算更方便】

循环:【不从头到尾计算,部分区域计算采用单元格计算】


价格加2 使用apply

lambda:

1.5 排序,多重排序


ascending默认从小到大排序:【true 从大到小 false从小到大】

1.6 数据筛选、过滤

找出年龄【18,30】分数【60,90】之间的
import pandas as pd

def validate_age(a):

    return 18 <= a <= 30  #pandas特有写法

def level_b(s):

    return 60 <= s < 90

students = pd.read_excel('Students.xlsx', index_col='ID')#id作为index

students = students.loc[students['Age'].apply(validate_age)].loc[students.Score.apply(level_b)]  # 两

种语法

students = students.loc[students.Age.apply(validate_age)].loc[students.Score.apply(level_b)]  # 两

种语法

print(students)
loc与iloc功能介绍:数据切片。通过索引来提取数据集中相应的行数据or列数据(可以是多行or多列)总结不同:
1. loc函数通过调用index名称的具体值来取数据
2. iloc函数通过行序号来取数据
3.取多行数据时iloc不包含末尾
4.对数据进行筛选使用loc函数,当使用loc函数时, 如果index不具有特定意义,而且重复,那么提取的数据需要进一步处理,可用.reset index()函数重置index相同: .
5.【】中无逗号时,默认取行
筛选出来的结果:
           Name  Age  Score

ID

4   Student_004   27     73

8   Student_008   21     61

9   Student_009   18     85

19  Student_019   19     86
换一种写法:lambda
import pandas as pd

# def validate_age(a):

#     return 18 <= a <= 30

# def level_b(s):

#     return 60 <= s < 90

students = pd.read_excel('Students.xlsx', index_col='ID')

students = students.loc[students['Age'].apply(

    lambda a:18 <= a <= 30)] .loc[students.Score.apply(lambda s:60 <= s < 90)]  # 两种语法

print(students)
2.数据可视化
2.1 柱状图
| Field | Number |
| Agriculture | 12,318 |
| Business and Management | 200,312 |
| Education | 19,483 |
| Engineering | 216,932 |
| Fine and Applied Arts | 59,736 |
| Health Professions | 33,947 |
| Humanities | 17,664 |
| Mathematics and Computer Sciences | 141,651 |
| Other/Unspecified Subject Areas | 185,107 |
| Physical and Life Sciences | 75,385 |
| Social Sciences | 81,304 |
import pandas as pd

import matplotlib.pyplot as plt

students = pd.read_excel('Students1.xlsx')

students.sort_values(by='Number', inplace=True, ascending=False)

students.index = range(0, len(students))

print(students)

plt.bar(students['Field'], students['Number'], color='orange', width=0.7)#

plt.xticks(students['Field'], rotation='90') #rotation旋转

plt.title('International Student by Field', fontsize=16)

plt.xlabel('Field')

plt.ylabel('Number')

plt.tight_layout() #j紧凑型,避免下标显示不全

plt.show()
pandas中inplace参数在很多函数中都会有,它的作用是:是否在原对象基础上进行修改
inplace = True:不创建新的对象,直接对原始对象进行修改;
inplace = False:对数据进行修改,创建并返回新的对象承载其修改结果。
默认是False,即创建新的对象进行修改,原对象不变, 和深复制和浅复制有些类似。


或者直接用pandas自带的:
import pandas as pd

import matplotlib.pyplot as plt

students = pd.read_excel('C:/Temp/Students.xlsx')

students.sort_values('Number', inplace=True, ascending=False)

print(students)

students.plot.bar(x='Field', y='Number', color='blue', title='International Students by Field')

plt.tight_layout()

plt.show()
2.2 分组柱图深度优化(比较图)
| Field | 2016 | 2017 |
| Agriculture | 12,318 | 12,602 |
| Business and Management | 200,312 | 200,754 |
| Communications and Journalism | 21,160 | 21,913 |
| Education | 19,483 | 17,993 |
| Engineering | 216,932 | 230,711 |
| Fine and Applied Arts | 59,736 | 61,506 |
| Humanities | 17,664 | 17,561 |
| Intensive English | 40,877 | 30,309 |
| Legal Studies and Law Enforcement | 15,077 | 15,306 |
| Math and Computer Science | 141,651 | 167,180 |
| Physical and Life Sciences | 75,385 | 76,838 |
| Social Sciences | 81,304 | 83,046 |
| Other Fields of Study | 81,318 | 87,577 |
| Undeclared | 26,675 | 21,131 |
import numpy as np

import pandas as pd

import matplotlib.pyplot as plt

students = pd.read_excel('Students2.xlsx')

students.sort_values(by='2017', inplace=True, ascending=False)

print(students)

students.plot.bar('Field', ['2016', '2017'], color=['orange', 'Red'])

plt.title('International Students by Field', fontsize=16,fontweight="bold")

plt.xlabel('Field', fontweight='bold')

plt.ylabel('Number', fontweight='bold')

plt.tight_layout()

ax = plt.gca() #坐标轴移动修改

ax.set_xticklabels(students['Field'], rotation=40, ha='right') #默认中心旋转

plt.gcf().subplots_adjust(left=0.2, bottom=0.42) #画布大小调整

plt.show()
推荐第一个
import numpy as np

import pandas as pd

import matplotlib.pyplot as plt

students = pd.read_excel('Students2.xlsx')

students.sort_values(by='2017', inplace=True, ascending=False)

students.index = range(0, len(students))

print(students)

bar_width = 0.7

x_pos = np.arange(len(students) * 2, step=2)

plt.bar(x_pos, students['2016'], color='green', width=bar_width)

plt.bar(x_pos + bar_width, students['2017'], color='blue', width=bar_width)

plt.legend()

plt.xticks(x_pos + bar_width / 2, students['Field'], rotation='90')

plt.title('International Student by Field', fontsize=16)

plt.xlabel('Field')

plt.ylabel('Number')

plt.tight_layout()

plt.show()
2.3 叠加柱状图

用户总量从大到小排序:
import pandas as pd

import matplotlib.pyplot as plt

users = pd.read_excel('Users.xlsx')

users['Total'] = users['Oct'] + users['Nov'] + users['Dec']

users.sort_values(by='Total', inplace=True, ascending=False)

print(users)

users.plot.bar(x='Name', y=['Oct', 'Nov', 'Dec'], stacked=True)

# users.plot.barh(x='Name', y=['Oct', 'Nov', 'Dec'], stacked=True)#水平柱状图堆积

plt.tight_layout()

plt.show()


users.sort_values(by='Total', inplace=True, ascending=Ture)

users.plot.barh(x='Name', y=['Oct', 'Nov', 'Dec'], stacked=True)#水平柱状图堆积
2.4 饼图

其中2016 2017是字符串,避免pandas误认为数字。
import pandas as pd

import matplotlib.pyplot as plt

students = pd.read_excel('Students3.xlsx', index_col='From')

print(students)

# counterclock顺逆时针,startangle开始点确认

students['2017'].plot.pie(fontsize=8, counterclock=False, startangle=-270)

plt.title('Source of International Students', fontsize=16, fontweight='bold')

plt.ylabel('2017', fontsize=12, fontweight='bold')

plt.show()
2.5 折现趋势图,叠加区域图

import pandas as pd

import matplotlib.pyplot as plt

weeks = pd.read_excel('Orders.xlsx', index_col='Week')

print(weeks)

weeks.plot(y=['Accessories', 'Bikes', 'Clothing', 'Components'])

weeks.plot.area(y=['Accessories', 'Bikes', 'Clothing', 'Components'])

plt.title('Sales Trends', fontsize=16, fontweight='bold')

plt.xticks(weeks.index, fontsize=8)

plt.show()


2.6 散点图直方图密度图

import pandas as pd

import matplotlib.pyplot as plt

pd.options.display.max_columns = 999#所有列都会显示

homes = pd.read_excel('home_data.xlsx')

# print(homes.head())

print(homes.corr())#相关性

homes.plot.scatter(x='sqft_living', y='price')

plt.figure()

homes.sqft_living.plot.kde() #密度图

plt.figure()

homes.sqft_living.plot.hist(bins=100) #区间设置

plt.xticks(range(0, max(homes.sqft_living), 500), fontsize=8, rotation=90) #面积

# homes.price.plot.hist(bins=200)

# plt.xticks(range(0, max(homes.price), 100000), fontsize=8, rotation=90)  #房价

plt.show()

密度图:

相关性:corr()
                     id     price  bedrooms  bathrooms  sqft_living  \

id             1.000000 -0.016762  0.001286   0.005160    -0.012258

price         -0.016762  1.000000  0.308350   0.525138     0.702035

bedrooms       0.001286  0.308350  1.000000   0.515884     0.576671

bathrooms      0.005160  0.525138  0.515884   1.000000     0.754665

sqft_living   -0.012258  0.702035  0.576671   0.754665     1.000000

sqft_basement -0.005151  0.323816  0.303093   0.283770     0.435043

sqft_lot      -0.132109  0.089661  0.031703   0.087740     0.172826

floors         0.018525  0.256794  0.175429   0.500653     0.353949

yr_built       0.021380  0.054012  0.154178   0.506019     0.318049

               sqft_basement  sqft_lot    floors  yr_built

id                 -0.005151 -0.132109  0.018525  0.021380

price               0.323816  0.089661  0.256794  0.054012

bedrooms            0.303093  0.031703  0.175429  0.154178

bathrooms           0.283770  0.087740  0.500653  0.506019

sqft_living         0.435043  0.172826  0.353949  0.318049

sqft_basement       1.000000  0.015286 -0.245705 -0.133124

sqft_lot            0.015286  1.000000 -0.005201  0.053080

floors             -0.245705 -0.005201  1.000000  0.489319

yr_built           -0.133124  0.053080  0.489319  1.000000
Python自动化办公--Pandas玩转Excel【一】的更多相关文章
- Python数据分析:pandas玩转Excel (二)
1 对Excel文件的操作 方法一: 使用xlrd库或者xlwt库进行对excel表格的操作读与写: 方法二: pandas库同样支持excel的读写操作:且更加简便. 2 pd.read_excel ...
- Python数据分析:pandas玩转Excel (一)
目录 1 pandas简介 2 导入 3 使用 4 读取.写入 1 pandas简介 1.Pandas是什么? Pandas是一个强大的分析结构化数据的工具集: 它的使用基础是Numpy(提供高性能的 ...
- Python数据分析:pandas玩转Excel(三)
将对象写入Excel工作表. 要将单个对象写入 Excel .xlsx 文件,只需指定目标文件名即可.要写入多个工作表,必须创建具有目标文件名的ExcelWriter对象,并在文件中指定要写入的工作表 ...
- Python自动化办公知识点整理汇总
知乎上有人提问:用python进行办公自动化都需要学习什么知识呢? 很多人学习python,不知道从何学起.很多人学习python,掌握了基本语法过后,不知道在哪里寻找案例上手.很多已经做案例的人,却 ...
- 20210105 - python自动化办公简介
新的一年开始了, 计划每周至少更新三篇博客. 人生苦短,如果不做改变,人生很快会过去!2021年寻求改变,加油! python自动化办公: 1.相关工具与环境的安装概要: 需要用到python(一种开 ...
- Python自动化办公:将文本文档内容批量分类导入Excel表格
序言 (https://jq.qq.com/?_wv=1027&k=GmeRhIX0) 它来了,它又来了. 本文实现用Python将文本文件自动保存到Excel表格里面去. 需求 将锦江区.t ...
- Python自动化办公:27行代码实现将多个Excel表格内容批量汇总合并到一个表格
序言 (https://jq.qq.com/?_wv=1027&k=GmeRhIX0) 老板最近越来越过分了,快下班了发给我几百个表格让我把内容合并到一个表格内去.还好我会Python,分分钟 ...
- Python自动化办公之操作Excel文件
模块导入 import openpyxl 读取Excel文件 打开Excel文件 workbook = openpyxl.load_workbook("test.xlsx") 输出 ...
- 《Python编程快速上手 —让繁琐工作自动化》|百度网盘免费下载|Python自动化办公
Python编程快速上手—让繁琐工作自动化 提取码:u8vj 如今,人们面临的大多数任务都可以通过编写计算机软件来完成. Python 是一种解释型.面向对象.动态数据类型的高级程序设计语言.通过 P ...
- Python自动化办公第三方库xlwt
Python向excel表格写入内容,首先安装第三方库: pip3 install xlwt 代码实例(结合xlrd): #!usr/bin/env python3 #!-*-coding=utf-8 ...
随机推荐
- 在 SDXL 上用 T2I-Adapter 实现高效可控的文生图
T2I-Adapter 是一种高效的即插即用模型,其能对冻结的预训练大型文生图模型提供额外引导.T2I-Adapter 将 T2I 模型中的内部知识与外部控制信号结合起来.我们可以根据不同的情况训练各 ...
- 【3rd Party】Cpp 中使用 Protobuf
前置条件: [Protoc]VS2019 (VS平台) 使用 CMake 编译安装.使用 Protobuf 库 [ToolChains]CLion(VS2019) + CMake + Vcpkg 的使 ...
- AcWing 第 2 场周赛
比赛链接:Here AcWing 3626. 三元一次方程 暴力即可 void solve() { int n; cin >> n; for (int i = 0; i <= n / ...
- 一、@Configuration、@Conponent 、@ComponentScan 注解等
一句话概括 区别: @Configuration 中所有带 @Bean 注解的方法都会被动态代理,因此调用该方法返回的都是同一个实例.2. 可以直接调用方法,不需要 @Autowired 注入后使用. ...
- 成都站|阿里云 Serverless 技术实战营邀你来玩!
活动简介 "Serverless 技术实战与创新沙龙 " 是一场以 Serverless 为主题的开发者活动,活动受众以关注Serverless 技术的开发者.企业决策人.云原生领 ...
- 3 分钟将免费无限制的 Claude 2.0 接入任意 GPT 套壳应用,太香了!
Claude 是 ChatGPT 的最强竞争对手,由 OpenAI 早期团队成员创建,目标就是打造出能 赶超 ChatGPT 的 AI.最新版的 Claude 2.0,能力已经开始领先 ChatGPT ...
- Gradle 出现 Could not resolve gradle
Gradle 在进行 sync 的时候会出现 Caused by: org.gradle.internal.resolve.ModuleVersionResolveException: Could n ...
- SV Clocking Review
clocking会设置input和output的延时 default input #3ns output #1ns 数据是在时钟上升沿驱动的,在时钟上升沿,将vld驱动到dut,dut中也会在时钟上升 ...
- DC-实验
设置及综合流程
- P5733 【深基6.例1】自动修正
1.题目介绍 2. 题解 2.1 字符串大小写转换 思路 str[i] -= 'a' -'A'; 注意这里转换方式,即减去偏移量(ASCII码表中,'a'在'A'前面,如果记不得偏移量,就直接写'a' ...