
python 内存监控模块之memory_profiler
0. memory_profiler是干嘛的
This is a python module for monitoring memory consumption of a process as well as line-by-line analysis of memory consumption for python programs. It is a pure python module and has the psutil module as optional (but highly recommended) dependencies.
memory_profiler是监控python进程的神器,它可以分析出每一行代码所增减的内存状况。
1. 入门例子
#del3.py
import time

@profile

def my_func():

    a = [1] * (10 ** 6)

    b = [2] * (2 * 10 ** 7)

    time.sleep(10)

    del b

    del a

    print "+++++++++"

if __name__ == '__main__':

    my_func()
结果
$python -m memory_profiler del3.py

+++++++++

Filename: del3.py

Line #    Mem usage    Increment   Line Contents

================================================

     2   10.293 MiB    0.000 MiB   @profile

     3                             def my_func():

     4   17.934 MiB    7.641 MiB       a = [1] * (10 ** 6)

     5  170.523 MiB  152.590 MiB       b = [2] * (2 * 10 ** 7)

     6  170.527 MiB    0.004 MiB       time.sleep(10)

     7   17.938 MiB -152.590 MiB       del b

     8   10.305 MiB   -7.633 MiB       del a

     9   10.309 MiB    0.004 MiB       print "+++++++++"
代码执行一遍,然后给出具体代码在某一步占用的内存,通过内存加减可以看出某个对象的大小。
2. 对象不删除,直接赋值内存是否会继续增长
#对比1
@profile

def my_func():

    a = 'a' * 1024 * 1024 * 1024;

    a = 'a' * 1024 * 1024

    a = 'a' * 1024

    del a

    print "+++++++++"

if __name__ == '__main__':

    my_func()
结果
Line #    Mem usage    Increment   Line Contents

================================================

     1   10.293 MiB    0.000 MiB   @profile

     2                             def my_func():

     3 1034.301 MiB 1024.008 MiB       a = 'a' * 1024 * 1024 * 1024;

     4   11.285 MiB -1023.016 MiB       a = 'a' * 1024 * 1024

     5   11.285 MiB    0.000 MiB       a = 'a' * 1024

     6   11.285 MiB    0.000 MiB       del a

     7   11.289 MiB    0.004 MiB       print "+++++++++"
#对比2
@profile

def my_func():

    a = 'a' * 1024 * 1024 * 1024;

    del a

    a = 'a' * 1024 * 1024

    del a

    a = 'a' * 1024

    del a

    print "+++++++++"

if __name__ == '__main__':

    my_func()
结果
Line #    Mem usage    Increment   Line Contents

================================================

     1   10.293 MiB    0.000 MiB   @profile

     2                             def my_func():

     3 1034.301 MiB 1024.008 MiB       a = 'a' * 1024 * 1024 * 1024;

     4   10.297 MiB -1024.004 MiB       del a

     5   11.285 MiB    0.988 MiB       a = 'a' * 1024 * 1024

     6   11.285 MiB    0.000 MiB       del a

     7   11.285 MiB    0.000 MiB       a = 'a' * 1024

     8   11.285 MiB    0.000 MiB       del a

     9   11.289 MiB    0.004 MiB       print "+++++++++"
结论:是否 del对象没有影响,新赋的值会替代旧的值
3. 对象赋值是否会增加同样的内存
#对比1
@profile

def my_func():

    a = 'a' * 1024 * 1024 * 1024;

    b = a

    del a

    print "+++++++++"

if __name__ == '__main__':

    my_func()
结果
Line #    Mem usage    Increment   Line Contents

================================================

     1   10.293 MiB    0.000 MiB   @profile

     2                             def my_func():

     3 1034.301 MiB 1024.008 MiB       a = 'a' * 1024 * 1024 * 1024;

     4 1034.301 MiB    0.000 MiB       b = a

     5 1034.301 MiB    0.000 MiB       del a

     6 1034.305 MiB    0.004 MiB       print "+++++++++"
#对比2
@profile

def my_func():

    a = 'a' * 1024 * 1024 * 1024;

    b = a

    del a

    del b

    print "+++++++++"

if __name__ == '__main__':

    my_func()
结果
Line #    Mem usage    Increment   Line Contents

================================================

     1   10.297 MiB    0.000 MiB   @profile

     2                             def my_func():

     3 1034.305 MiB 1024.008 MiB       a = 'a' * 1024 * 1024 * 1024;

     4 1034.305 MiB    0.000 MiB       b = a

     5 1034.305 MiB    0.000 MiB       del a

     6   10.301 MiB -1024.004 MiB       del b

     7   10.305 MiB    0.004 MiB       print "+++++++++"
结论,把a赋值给b,内存没有增加。但是只删除其中一个对象的时候,内存不会减。
4. 另一种等价的启动方式
from memory_profiler import profile

@profile(precision=4)

def my_func():

    a = 'a' * 1024 * 1024 * 1024;

    del a

    a = 'a' * 1024 * 1024

    del a

    a = 'a' * 1024

    del a

    print "+++++++++"

if __name__ == '__main__':

    my_func()
结果
$python -m memory_profiler del3.py

+++++++++

Filename: del3.py

Line #    Mem usage    Increment   Line Contents

================================================

     2  10.3867 MiB   0.0000 MiB   @profile(precision=4)

     3                             def my_func():

     4 1034.3945 MiB 1024.0078 MiB       a = 'a' * 1024 * 1024 * 1024;

     5  10.3906 MiB -1024.0039 MiB       del a

     6  11.3789 MiB   0.9883 MiB       a = 'a' * 1024 * 1024

     7  11.3789 MiB   0.0000 MiB       del a

     8  11.3789 MiB   0.0000 MiB       a = 'a' * 1024

     9  11.3789 MiB   0.0000 MiB       del a

    10  11.3828 MiB   0.0039 MiB       print "+++++++++"
5. 非python内置对象例子
from memory_profiler import profile

import networkx as nx

@profile(precision=4)

def my_func():

    a = 'a' * 1024 * 1024 * 1024;

    del a

    G = nx.Graph()

    G.add_node(1)

    G.add_nodes_from([i for i in range(10000)])

    G.add_nodes_from([i for i in range(10000, 20000)])

    G.add_edges_from([(1,2), (1,4), (2, 9), (4, 1), (3, 8)])

    del G

    print "++++++"

if __name__ == '__main__':

    my_func()
结果
$python del3.py

++++++

Filename: del3.py

Line #    Mem usage    Increment   Line Contents

================================================

     4  23.4844 MiB   0.0000 MiB   @profile(precision=4)

     5                             def my_func():

     6 1047.4922 MiB 1024.0078 MiB       a = 'a' * 1024 * 1024 * 1024;

     7  23.4883 MiB -1024.0039 MiB       del a

     8  23.4883 MiB   0.0000 MiB       G = nx.Graph()

     9  23.4883 MiB   0.0000 MiB       G.add_node(1)

    10  31.3359 MiB   7.8477 MiB       G.add_nodes_from([i for i in range(10000)])

    11  36.9219 MiB   5.5859 MiB       G.add_nodes_from([i for i in range(10000, 20000)])

    12  36.9219 MiB   0.0000 MiB       G.add_edges_from([(1,2), (1,4), (2, 9), (4, 1), (3, 8)])

    13  25.9219 MiB -11.0000 MiB       del G

    14  25.9258 MiB   0.0039 MiB       print "++++++"
6. 类怎么使用呢
#del4.py
from memory_profiler import profile

class people:

    name = ''

    age = 0

    __weight = 0

    def __init__(self,n,a,w):

        self.name = n

        self.age = a

        self.__weight = w

    @profile(precision=4)

    def speak(self):

        a = 'a' * 1024

        b = 'b' * 1024 * 1024

        print("%s is speaking: I am %d years old" % (self.name,self.age))

if __name__ == '__main__':

    p = people('tom', 10, 30)

    p.speak()
结果
$python del4.py

tom is speaking: I am 10 years old

Filename: del4.py

Line #    Mem usage    Increment   Line Contents

================================================

    13   9.4219 MiB   0.0000 MiB       @profile(precision=4)

    14                                 def speak(self):

    15   9.4258 MiB   0.0039 MiB           a = 'a' * 1024

    16  10.4297 MiB   1.0039 MiB           b = 'b' * 1024 * 1024

    17  10.4336 MiB   0.0039 MiB           print("%s is speaking: I am %d years old" % (self.name,self.age))
7. 随时间内存统计
#test.py
import time

@profile

def test1():

    n = 10000

    a = [1] * n

    time.sleep(1)

    return a

@profile

def test2():

    n = 100000

    b = [1] * n

    time.sleep(1)

    return b

if __name__ == "__main__":

    test1()

    test2()
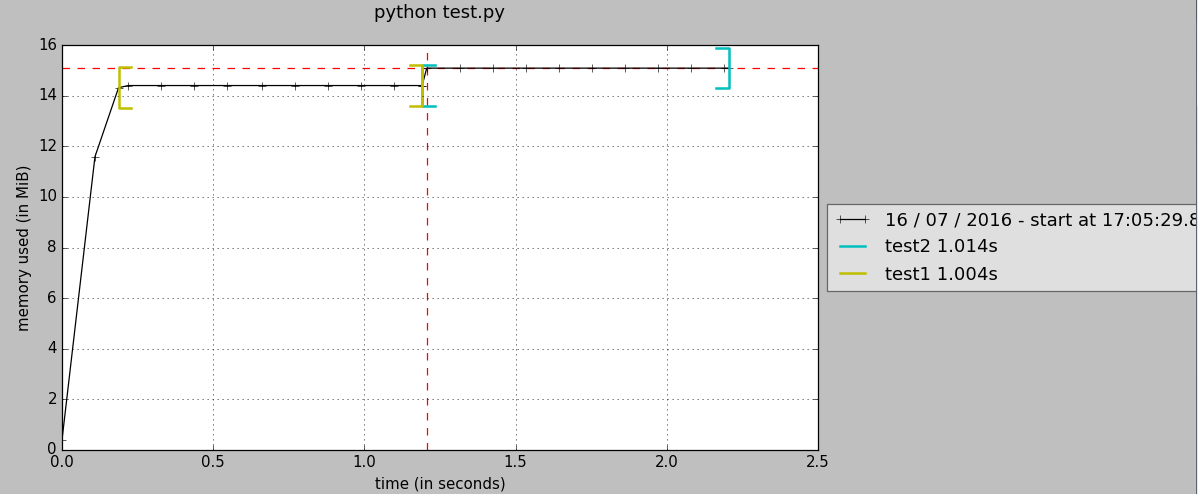
test.py 里有两个两个待分析的函数(@profile标识),为了形象地看出内存随时间的变化,每个函数内sleep 1s,执行
mprof run test.py
如果执行成功,结果这样
$ mprof run test.py

mprof: Sampling memory every 0.1s

running as a Python program...
结果会生成一个.dat文件,如"mprofile_20160716170529.dat",里面记录了内存随时间的变化,可用下面的命令以图片的形式展示出来:
mprof plot
8. API
memory_profiler提供很多包给第三方代码,如
>>> from memory_profiler import memory_usage

>>> mem_usage = memory_usage(-1, interval=.2, timeout=1)

>>> print(mem_usage)

    [7.296875, 7.296875, 7.296875, 7.296875, 7.296875]
memory_usage(proc=-1, interval=.2, timeout=None)返回一段时间的内存值,其中proc=-1表示此进程,这里可以指定特定的进程号;interval=.2表示监控的时间间隔是0.2秒;timeout=1表示总共的时间段为1秒。那结果就返回5个值。
如果要返回一个函数的内存消耗,示例
def f(a, n=100):

     import time

     time.sleep(2)

     b = [a] * n

     time.sleep(1)

     return b

from memory_profiler import memory_usage

print memory_usage((f, (2,), {'n' : int(1e6)}))
这里执行了 f(1, n=int(1e6)) ,并返回在执行此函数时的内存消耗。
9. 优化实例
对比str & int
from datetime import datetime

@profile

def my_func():

    beg = datetime.now()

    a = {}

    for i in range():

        a[i] = i

        #a[str(i)] = i

    print "+++++++++"

    del a

    print "+++++++++"

    end = datetime.now()

    print "time:", end - beg

if __name__ == '__main__':

    my_func()
用a[i] = i,结果
+++++++++

+++++++++

time: 0:06:14.790899

Filename: int.py

Line #    Mem usage    Increment   Line Contents

================================================

     2   14.727 MiB    0.000 MiB   @profile

     3                             def my_func():

     4   14.734 MiB    0.008 MiB       beg = datetime.now()

     5   14.734 MiB    0.000 MiB       a = {}

     6   94.031 MiB   79.297 MiB       for i in range(1000000):

     7   94.031 MiB    0.000 MiB           a[i] = i

     8                                     #a[str(i)] = i

     9   86.402 MiB   -7.629 MiB       print "+++++++++"

    10   38.398 MiB  -48.004 MiB       del a

    11   38.398 MiB    0.000 MiB       print "+++++++++"

    12   38.398 MiB    0.000 MiB       end = datetime.now()

    13   38.406 MiB    0.008 MiB       print "time:", end - beg
用a[str(i)] = i,结果
+++++++++

+++++++++

time: 0:06:00.288052

Filename: int.py

Line #    Mem usage    Increment   Line Contents

================================================

     2   14.723 MiB    0.000 MiB   @profile

     3                             def my_func():

     4   14.730 MiB    0.008 MiB       beg = datetime.now()

     5   14.730 MiB    0.000 MiB       a = {}

     6  140.500 MiB  125.770 MiB       for i in range(1000000):

     7                                     #a[i] = i

     8  140.500 MiB    0.000 MiB           a[str(i)] = i

     9  132.871 MiB   -7.629 MiB       print "+++++++++"

    10   38.539 MiB  -94.332 MiB       del a

    11   38.539 MiB    0.000 MiB       print "+++++++++"

    12   38.539 MiB    0.000 MiB       end = datetime.now()

    13   38.547 MiB    0.008 MiB       print "time:", end - beg
python 内存监控模块之memory_profiler的更多相关文章
- python内存管理机制
主要分为三部分: (1)内存池机制(2)引用计数(3)垃圾回收 (1)内存池机制对于python来说,对象的类型和内存都是在运行时确定的,所以python对象都是动态类型简单来说,python内存分为 ...
- 解读Python内存管理机制
转自:http://developer.51cto.com/art/201007/213585.htm 内存管理,对于Python这样的动态语言,是至关重要的一部分,它在很大程度上甚至决定了Pytho ...
- 转发:[Python]内存管理
本文为转发,原地址为:http://chenrudan.github.io/blog/2016/04/23/pythonmemorycontrol.html 本文主要为了解释清楚python的内存管理 ...
- python 内存泄露的诊断 - 独立思考 - ITeye技术网站
python 内存泄露的诊断 - 独立思考 - ITeye技术网站 python 内存泄露的诊断 博客分类: 编程语言: Python Python多线程Blog.net 对于一个用 python ...
- Python内存优化
实际项目中,pythoner更加关注的是Python的性能问题,之前也写过一篇文章<Python性能优化>介绍Python性能优化的一些方法.而本文,关注的是Python的内存优化,一般说 ...
- 使用gc、objgraph干掉python内存泄露与循环引用!
Python使用引用计数和垃圾回收来做内存管理,前面也写过一遍文章<Python内存优化>,介绍了在python中,如何profile内存使用情况,并做出相应的优化.本文介绍两个更致命的问 ...
- python 内存NoSQL数据库
python 内存NoSQL数据库 来自于网络,经过修改,秉承Open Source精神,回馈网络! #!/usr/bin/python #-*- coding: UTF-8 -*- # # memd ...
- [转] 使用gc && objgraph 优化python内存
转自https://www.cnblogs.com/xybaby/p/7491656.html 使用gc.objgraph干掉python内存泄露与循环引用! 目录 一分钟版本 python内存管 ...
- Python内存优化:Profile,slots,compact dict
实际项目中,pythoner更加关注的是Python的性能问题,之前也写过一篇文章<Python性能优化>介绍Python性能优化的一些方法.而本文,关注的是Python的内存优化,一般说 ...
随机推荐
- Javascript 笔记与总结(2-8)对象2
注意:标签属性与 DOM 对象属性的对应关系,绝大部分 2 者是相同的,例如 imgobj.src 属性对应 <img src=""> 中的 src 属性 例外:< ...
- razor 添加html5属性
在 HTML5 中, 可以使用 data- 属性来表示用户数据,这些数据甚至可以是 JSON 格式的数据,对 Web 前端开发带来很大的方便. 在 MVC 的 Razor 中,可以使用匿名对象来生成定 ...
- LoadRunner系统架构简介
1.LoadRunner系统架构简介 LoadRunner是通过创建虚拟用户来代替真实实际用户来操作客户端软件比如Internet Explorer,来向IIS.Apache等Web服务器发送HTTP ...
- Python之 continue继续循环和多重循环
Python之 continue继续循环 在循环过程中,可以用break退出当前循环,还可以用continue跳过后续循环代码,继续下一次循环. 假设我们已经写好了利用for循环计算平均分的代码: L ...
- (转)js闭包初入门
先看一段JS代码: 1 2 3 4 5 6 7 8 9 10 11 12 13 function a(){ var num = 0; function ...
- 蓝牙—服务发现协议(SDP)
服务搜索协议(SDP)提供了应用发现可用服务以及确定可用服务特点的方法.SDP发现协议提供下面的能力 <1>为客户提供搜索所需要服务的能力. <2>允许基于服务类型搜索服务 & ...
- yum-config-manager YUM安装遭遇: [Errno 256] No more mirrors to try CentOS yum之$releasever和$basearch
YUM安装遭遇: [Errno 256] No more mirrors to try createrepo 有问题. CentOS yum之$releasever和$basearch分类: 操作系统 ...
- Android源码剖析之Framework层基础版(窗口、linux、token、Binder)
本文来自http://blog.csdn.net/liuxian13183/ ,引用必须注明出处! 关于Framework,就是应用层底下的控制层,离应用层最近,总想找个机会,写写WindowMang ...
- java中关于集合的知识点梳理
一:概述 1.集合的特点 只存储对象,集合长度是可变的,集合可以存储不同类型的对象. 2.集合框架 Collection List | | Set ArrayList Linked ...
- 企业服务总线(ESB)
思考: 1.ESB的定义到底是什么?是一款产品还是一种架构模式? 2.ESB有何实际用处? 定义ESB 对于企业服务总线(Enterprise Service Bus),目前还没有公认的定义,根据供应 ...