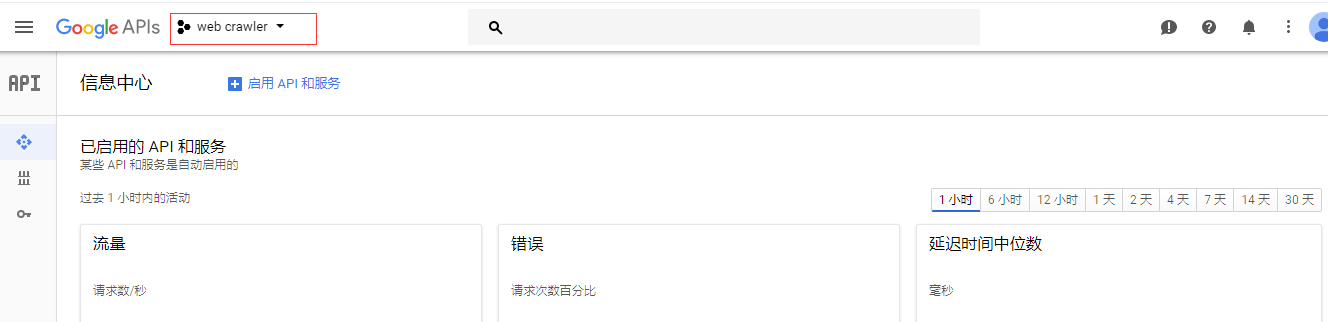
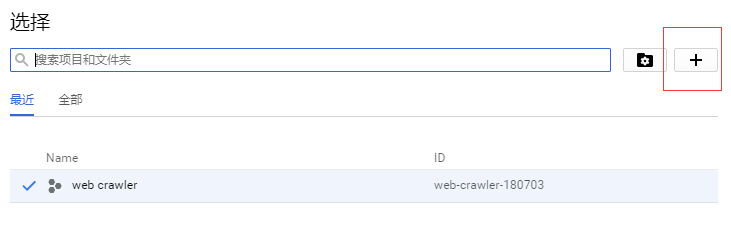
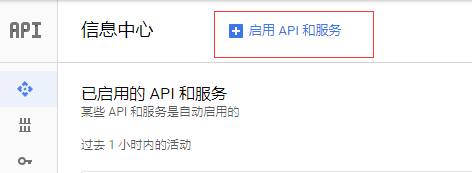
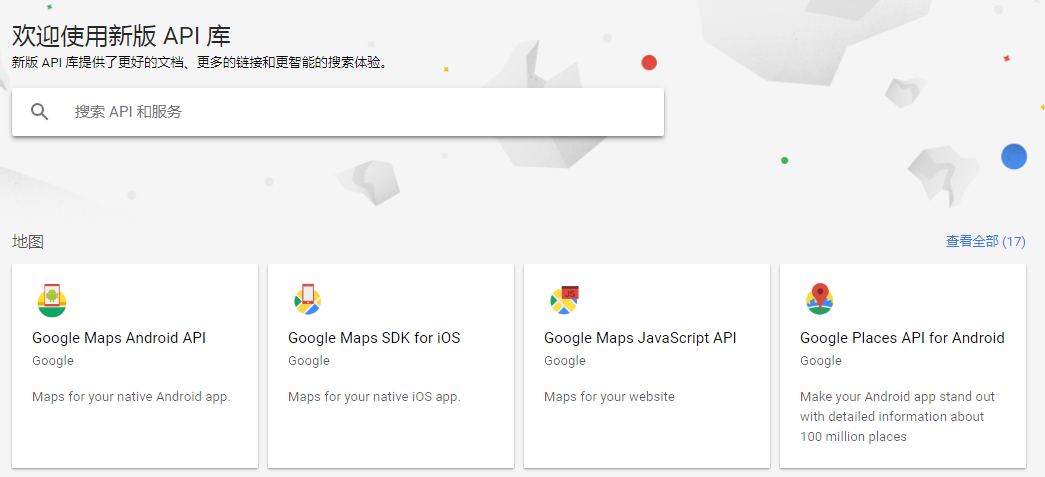
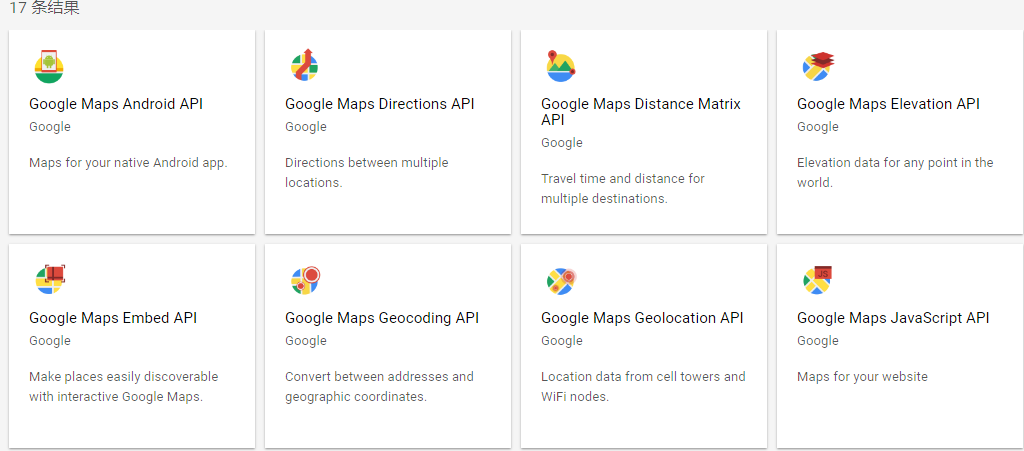
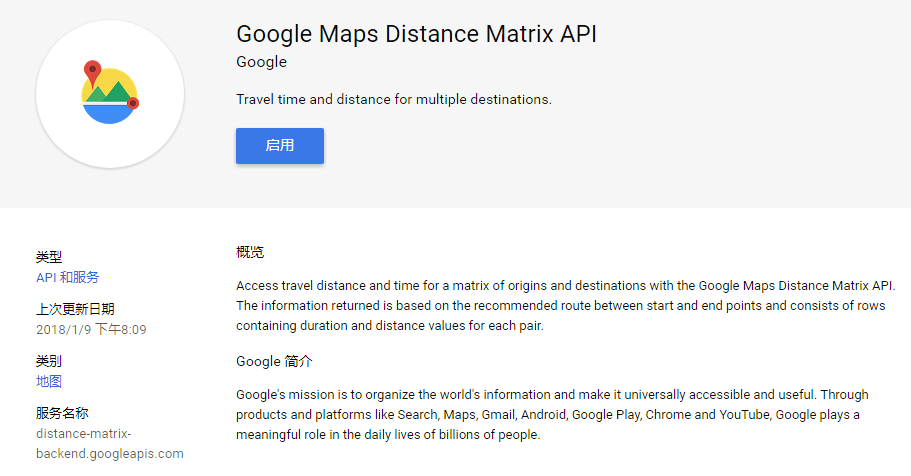
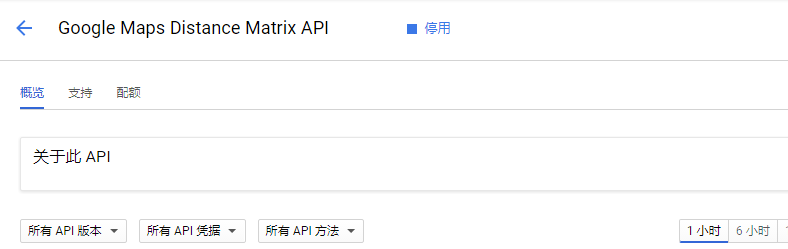
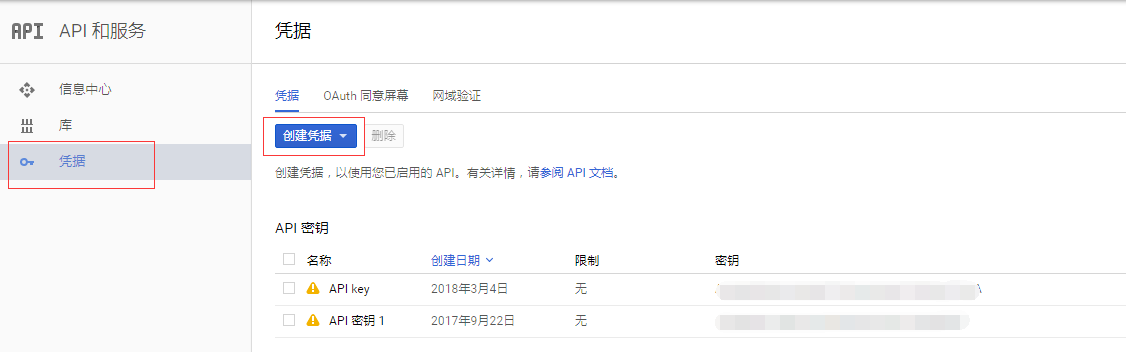
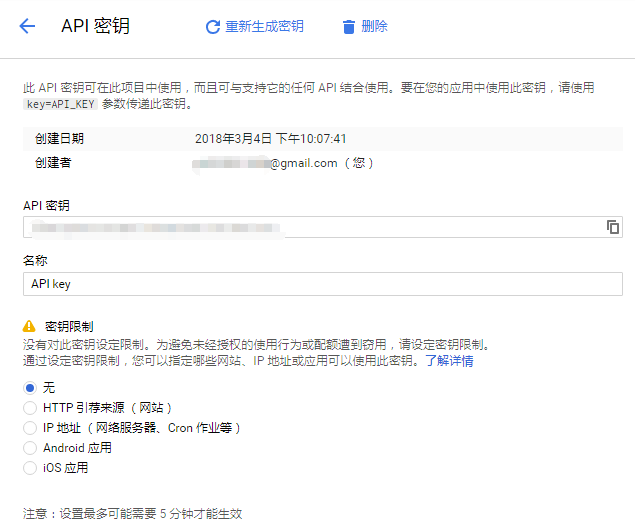
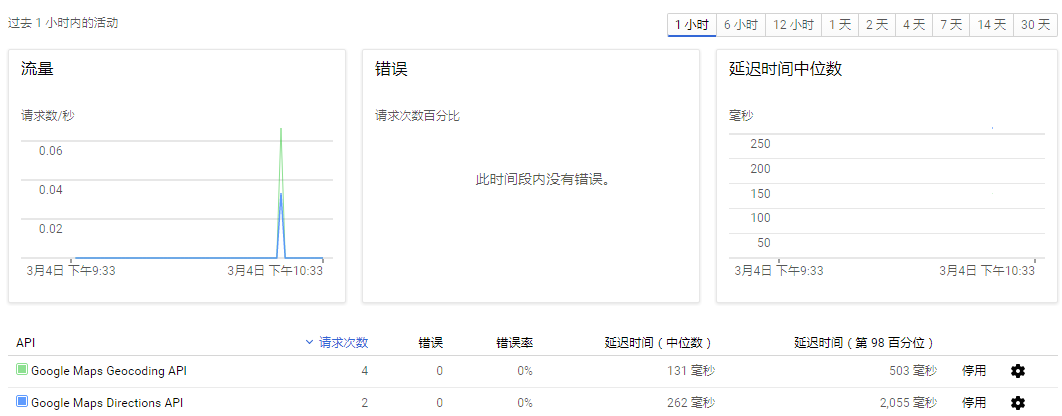
Google Maps API的使用

.png)
.png)
.png)
.png)
.png)
.png)
.png)
.png)
import googlemaps

from datetime import datetime

gmaps = googlemaps.Client(key='Add Your Key here')

# Geocoding an address

geocode_result = gmaps.geocode('1600 Amphitheatre Parkway, Mountain View, CA')

print(geocode_result[0]['geometry']['location'])

# Look up an address with reverse geocoding

reverse_geocode_result = gmaps.reverse_geocode((40.714224, -73.961452))

print(reverse_geocode_result[0]['address_components'][1]['long_name'])
.png)
import googlemaps

from datetime import datetime

gmaps = googlemaps.Client(key='Add Your Key here')

# Request directions via public transit

now = datetime.now()

directions_result = gmaps.directions("Sydney Town Hall",

                                     "Parramatta, NSW",

                                     mode="transit",

                                     departure_time=now)

print(directions_result)
import googlemaps
from datetime import datetime
import os
import csv
import pandas as pd
import matplotlib.pyplot as plt
import math # 将已知的多个txt文件中的内容放到一个CSV文件下
def txt2Csv(dataPath, csvname):
fileList = os.listdir(dataPath)
csvFile = open(dataPath + '\\' + csvname, 'w+')
writer = csv.writer(csvFile)
for fileName in fileList:
with open(dataPath + '\\' + fileName) as fileObj:
lines = fileObj.readlines()
for line in lines:
line = line.split(',')
line[-1] = line[-1][0:-1]
writer.writerow((line))
csvFile.close() # 根据经纬度获取两地之间的距离及花费的时间
def getDistanceDuration(key, path, csvName):
gmaps = googlemaps.Client(key=key)
df = pd.read_csv(path + '\\' + csvName)
df.columns = ['id', 'time', 'longitude', 'latitude']
durationList = []
distanceList = []
try:
for i in range(1, 1000):
now = datetime.now()
# 调取google API的directions:
directions_result = gmaps.directions((df.iloc[i, 3], df.iloc[i, 2]),
(df.iloc[i+1, 3], df.iloc[i+1, 2]),
mode="driving",
departure_time=now)
# 按照返回的格式,找出distance及duration,追加到列表中并返回
distanceList.append(directions_result[0]['legs'][0]['distance']['value'])
durationList.append(directions_result[0]['legs'][0]['duration']['value'])
except googlemaps.exceptions._RetriableRequest:
pass
return distanceList, durationList path = 'D:\\Learnning\\python\\scrape\\taxiData\\T-drive Taxi Trajectories\\release\\taxi_log_2008_by_id'
txt2Csv(path, 'geodata.csv') distanceList, durationList = getDistanceDuration('AIzaSyD8X6tJx6Ap5TVHlqwSso8iTwZfDWcFsOA', path, 'geodata.csv')
# 对返回数据的单位做转换, 并使用math.ceil对数据向上取整
distanceList = [math.ceil(dis/1000) for dis in distanceList]
durationList = [math.ceil(dis/60) for dis in durationList] totalDistance = 0
totalDuration = 0
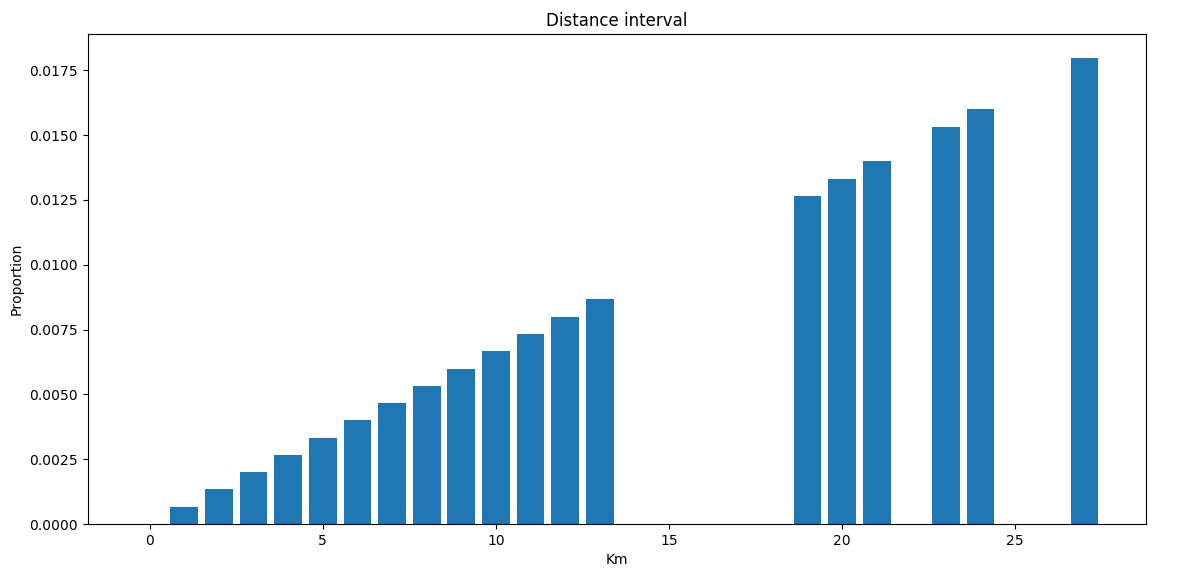
# 计算总路程,并画出每段路程的距离在总路程中的占比:
for distance in distanceList:
totalDistance += distance
distancePropo = [distance/totalDistance for distance in distanceList]
plt.bar(distanceList, distancePropo)
plt.title("Distance interval")
plt.xlabel("Km")
plt.ylabel("Proportion")
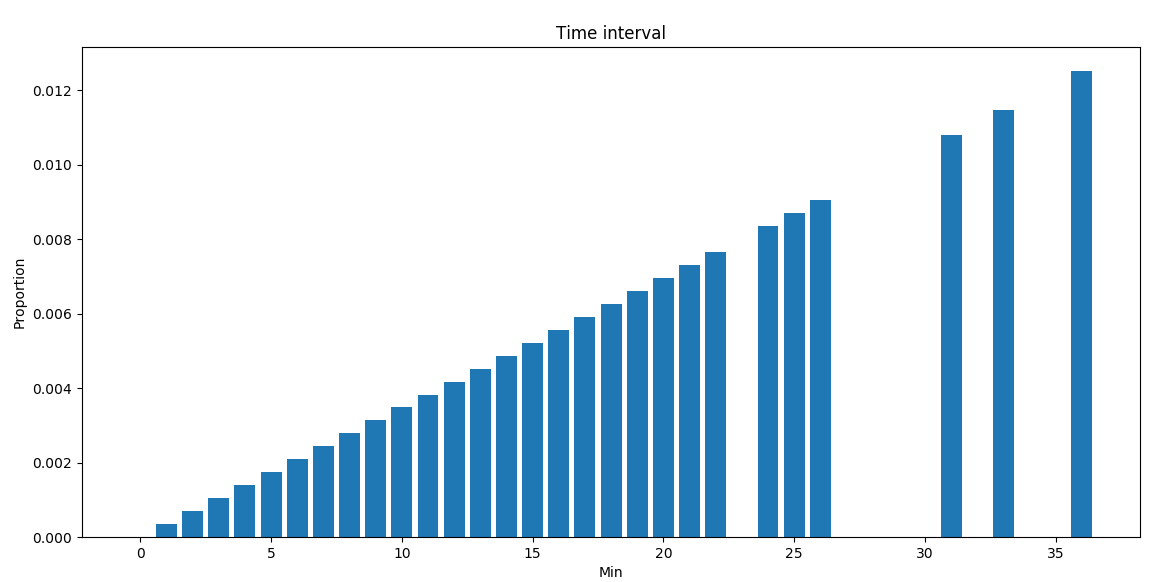
plt.show() # 计算总时间,并画出每段路程花费的时间在总时间中的占比:
for duration in durationList:
totalDuration += duration
durationPropo = [duration/totalDuration for duration in durationList]
plt.bar(durationList, durationPropo)
plt.title("Time interval")
plt.xlabel("Min")
plt.ylabel("Proportion")
plt.show()
.png)
按行驶距离分布:
.png) 具体的使用文档可参考:
具体的使用文档可参考:Google Maps API的使用的更多相关文章
- Google Maps API V3 之绘图库 信息窗口
Google官方教程: Google 地图 API V3 使用入门 Google 地图 API V3 针对移动设备进行开发 Google 地图 API V3 之事件 Google 地图 API V3 ...
- Google Maps API V3 之 图层
Google官方教程: Google 地图 API V3 使用入门 Google 地图 API V3 针对移动设备进行开发 Google 地图 API V3 之事件 Google 地图 API V3 ...
- Google Maps API V3 之 路线服务
Google官方教程: Google 地图 API V3 使用入门 Google 地图 API V3 针对移动设备进行开发 Google 地图 API V3 之事件 Google 地图 API V3 ...
- google maps api申请的问题
现在已经改由统一的GOOGLE API控制台进行所有GOOGLE API的管理了. 方法是使用Google帐号登入 https://code.google.com/apis/console. 然后在所 ...
- Google maps API开发(一)(转)
一.加载Google maps API <script type="text/javascript" src="http://ditu.google.com/map ...
- Google maps API开发(二)(转)
这一篇主要实现怎么调用Google maps API中的地址解析核心类GClientGeocoder: 主要功能包括地址解析.反向解析.本地搜索.周边搜索等, 我这里主要有两个实例: 实例一.当你搜索 ...
- Google Maps API Web Services
原文:Google Maps API Web Services 摘自:https://developers.google.com/maps/documentation/webservices/ Goo ...
- Google maps API开发
原文:Google maps API开发 Google maps API开发(一) 最近做一个小东西用到google map,突击了一下,收获不小,把自己学习的一些小例子记录下来吧 一.加载Googl ...
- Google Maps API Key申请办法(最新)
之前的Google Maps Api的API Key很容易申请,只需要按照一个简单的表单提交部署的网站地址即可,自动生成API Key并给出引用的路径. 但是最近在处理另外一个项目的时候发现之前的这种 ...
- 如何插入谷歌地图并获取javascript api 秘钥--Google Maps API error: MissingKeyMapError
参考:https://blog.csdn.net/klsstt/article/details/51744866 Google Maps API error: MissingKeyMapError h ...
随机推荐
- 《android开发艺术探索》读书笔记(十一)--Android的线程和线程池
接上篇<android开发艺术探索>读书笔记(十)--Android的消息机制 No1: 在Android中可以扮演线程角色的有很多,比如AsyncTask.IntentService.H ...
- javascript正则表达式的一些笔记
正则表达式:Regular Expression.使用单个字符串来描述,匹配一系列符合某个句法规则的字符串.即按照某种规则去匹配符合条件的字符串.正则表达式就是规则. \b 单词边界 regexp对象 ...
- hihoCoder1330 数组重排
题意 小Hi想知道,如果他每次都按照一种固定的顺序重排数组,那么最少经过几次重排之后数组会恢复初始的顺序? 具体来讲,给定一个1 - N 的排列 P,小Hi每次重排都是把第 i 个元素放到第 Pi个位 ...
- POJ1639 - Picnic Planning
原题链接 Description 给出一张个点的无向边权图并钦定点,求使得点的度不超过的最小生成树. Solution 首先无视掉与相连的所有边,原图会变成若干互不连通的个块.对每个块分别求MST,再 ...
- CentOS7网卡命名规则
CentOS6之前基于传统的命名方式如:eth1,eth0.... Centos7提供了不同的命名规则,默认是基于固件.拓扑.位置信息来分配.这样做的优点是命名是全自动的.可预知的,缺点是比eth0. ...
- Hbase的存储
Hbase在生态系统中的位置 Hbase存储的逻辑视图 Hbase的存储格式 Hbase写数据流程 Hbase快速响应数据 Hbase在生态系统中的位置 HBase位于结构化存储层,Hadoop HD ...
- Centos搭建mysql/Hadoop/Hive/Hbase/Sqoop/Pig
目录: 准备工作 Centos安装 mysql Centos安装Hadoop Centos安装hive JDBC远程连接Hive Hbase和hive整合 Centos安装Hbase 准备工作: 配置 ...
- iOS 开发之内存泄漏问题
关于内存泄漏问题,一般情况下就是控制器或者视图没有正常的释放引起的,我们通常可以通过dealloc方法来检查一个控制器或者视图是否释放. 对于一个控制器或者视图没有释放,其实也就是还有强引用引用着这个 ...
- 关系网络理论︱细讲中介中心性(Betweeness Centrality)
关系网络在我认为都是一种很简单暴力地能挖掘人群特征关系的一种方式,特别今天去听了一场关于AI与金融领域的结合,里面提到了拓扑分析其实就是关系网络的解释.我在之前的文章( R语言︱SNA-社会关系网络- ...
- Microsoft+R:Microsoft R Open (MRO)安装和多核运作
每每以为攀得众山小,可.每每又切实来到起点,大牛们,缓缓脚步来俺笔记葩分享一下吧,please~ --------------------------- 本文转载于公众号大猫的R语言课堂,公众号作者使 ...