CPU使用率原理及计算方式
本文转载自CPU使用率原理及计算方式
CPU:超线程和多核
超线程(Hyper-Threading )
超线程是Intel最早提出一项技术,最早出现在2002年的Pentium4上。单个采用超线程的CPU对于操作系统来说就像有两个逻辑CPU,为此P4处理器需要多加入一个Logical CPU Pointer(逻辑处理单元)。
虽然采用超线程技术能同时执行两个线程,但它并不像两个真正的CPU那样,每个CPU都具有独立的资源。当两个线程都同时需要某一个资源时,其中一个要暂时停止,并让出资源,直到这些资源闲置后才能继续。因此超线程的性能并不等于两颗CPU的性能。
多核(multi-cores)
最开始CPU只有一个核(core),为了提高性能,引入了双核CPU,四核CPU等,双核CPU能同时执行两个线程。和超线程不同的是,双核CPU是实打实的有两个central processing units在一个CPU chip。
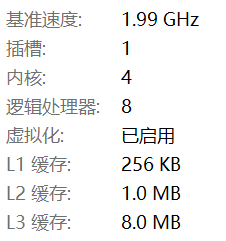
上图显示主板上有1个插槽(socket),这个插槽插着一个CPU,这个CPU有4个核(core),每个核都使用超线程技术,所以这台机器总共有8个逻辑核。
CPU使用率计算
CPU使用率测试
一台拥有8个logic core CPU的机器,执行如下程序:
#include <pthread.h>

const int num = 9;

pthread_t threads[num];

void *func(void* arg) {

	while(1) {}

	return ((void *)0);

}

int main(int argc, char* argv[]) {

	for (int i = 0; i < num; i++) {

		pthread_create(&threads[i], NULL, func, NULL);

	}

	for (int i = 0; i < num; i++) {

		pthread_join(threads[i], NULL);

	}

	return 0;

}
该程序开启9个线程每个线程都执行一个死循环。执行后用top查看cpu使用情况:
332 root 20 0 84312 612 416 S 800.0 0.0 7:18.41 cputest
可以看到cputest的CPU使用情况为800%,也就是8个logic core都在执行cputest这个进程。
而在一个只有1个logic的CPU上跑的结果如下:
13812 ubuntu 20 0 80284 708 628 S 97.7 0.1 0:10.14 cputest
可以看到,纵使开启了9个线程,每个线程都执行死循环,CPU使用率只有97.7%。
如何计算CPU使用率
        1. %CPU  --  CPU Usage

           The task's share of the elapsed CPU time since the last screen update, expressed as a percentage of total CPU time.

           In a true SMP environment, if a process is multi-threaded and top is not operating in Threads mode, amounts greater than 100% may be reported.  You  toggle

           Threads mode with the `H' interactive command.

           Also  for  multi-processor environments, if Irix mode is Off, top will operate in Solaris mode where a task's cpu usage will be divided by the total number

           of CPUs.  You toggle Irix/Solaris modes with the `I' interactive command.
以上截取自man top中对于CPU使用率的定义,总结来说某个进程的CPU使用率就是这个进程在一段时间内占用的CPU时间占总的CPU时间的百分比。
比如某个开启多线程的进程1s内占用了CPU0 0.6s, CPU1 0.9s, 那么它的占用率是150%。这样就不难理解上例中cputest进程CPU占用率为800%这个结果了。
实现CPU使用率统计程序
原理
某进程cpu使用率 = 该进程cpu时间 / 总cpu时间。
/proc/pid/stat中可以得出进程自启动以来占用的cpu时间。以bash进程为例:
79 (bash) S 46 79 79 34816 0 0 0 0 0 0 46 135 387954 4807 20 0 1 0 6114 232049254400 873 18446744073709551615 0 0 0 0 0 0 0 0 0 0 0 0 0 0 0 0 0 0 0 0 0 0 0 0 0 0 0
第14项utime和第15项stime分别表示bash自启动起来,执行用户代码态占用的时间和执行内核态代码占用的时间,单位是clock tick,clock tick是时间单位。这两项的详细解释如下(摘自man proc):
              (14) utime  %lu

                        Amount  of  time  that  this process has been scheduled in user mode, measured in clock ticks (divide by sysconf(_SC_CLK_TCK)).  This includes

                        guest time, guest_time (time spent running a virtual CPU, see below), so that applications that are not aware of the guest time field  do  not

                        lose that time from their calculations.

              (15) stime  %lu

                        Amount of time that this process has been scheduled in kernel mode, measured in clock ticks (divide by sysconf(_SC_CLK_TCK)).
每个clock tick占用多少时间呢?
可以通过sysconf(_SC_CLK_TCK)获取1秒内有多少个clock tick(通常是100)。也就是说1 clock tick为1 / 100秒。
实现
有了上面的基础,
我们可以每隔period秒读取/proc/pid/stat,解析其中的utime和stime,将其和(utime+stime)减去上一次采样时这两项的和(lastutime + laststime),这就是period秒内该进程占用CPU的时间,单位为clock tick。
总的CPU时间为period * sysconf(_SC_CLK_TCK),单位也为clock tick。
所以公式如下:
某进程cpu使用率 = ((utime+stime) - (lastutime + laststime)) / (period * sysconf(_SC_CLK_TCK))
以下是实现:
#include <unistd.h>

#include <stdio.h>

#include <sys/time.h>

#include <string.h>

#include <signal.h>

#include <stdlib.h>

#include <fstream>

#include <iostream>

#include <sstream>

using namespace std;

struct StatData

{

  void parse(const string& content)

  {

	size_t rp = content.rfind(')');

    std::istringstream iss(content.data() + rp + 1);

    //            0    1    2    3     4    5       6   7 8 9  11  13   15

    // 3770 (cat) R 3718 3770 3718 34818 3770 4202496 214 0 0 0 0 0 0 0 20

    // 16  18     19      20 21                   22      23      24              25

    //  0 1 0 298215 5750784 81 18446744073709551615 4194304 4242836 140736345340592

    //              26

    // 140736066274232 140575670169216 0 0 0 0 0 0 0 17 0 0 0 0 0 0

    iss >> state;

    iss >> ppid >> pgrp >> session >> tty_nr >> tpgid >> flags;

    iss >> minflt >> cminflt >> majflt >> cmajflt;

    iss >> utime >> stime >> cutime >> cstime;

    iss >> priority >> nice >> num_threads >> itrealvalue >> starttime;

  }

  string name;

  char state;

  int ppid;

  int pgrp;

  int session;

  int tty_nr;

  int tpgid;

  int flags;

  long minflt;

  long cminflt;

  long majflt;

  long cmajflt;

  long utime;

  long stime;

  long cutime;

  long cstime;

  long priority;

  long nice;

  long num_threads;

  long itrealvalue;

  long starttime;

};

int clockTicks = static_cast<int>(::sysconf(_SC_CLK_TCK));

const int period = 2;

int pid;

int ticks;

StatData lastStatData;

bool processExists(pid_t pid)

{

  char filename[256];

  snprintf(filename, sizeof filename, "/proc/%d/stat", pid);

  return ::access(filename, R_OK) == 0;

}

//read /proc/pid/stat

string readProcFile(int pid) {

	char filename[256];

	snprintf(filename, sizeof filename, "/proc/%d/stat", pid);

	ifstream in;

	in.open(filename);

	stringstream ss;

	ss << in.rdbuf();

	string ret = ss.str();

	return ret;

}

double cpuUsage(int userTicks, int sysTicks, double kPeriod, double kClockTicksPerSecond)

{

	return (userTicks + sysTicks) / (kClockTicksPerSecond * kPeriod); //CPU使用率计算

}

void tick(int num) {

	string content = readProcFile(pid);

	StatData statData;

	memset(&statData, 0, sizeof statData);

	statData.parse(content);

	if (ticks > 0) {

		int userTicks = std::max(0, static_cast<int>(statData.utime - lastStatData.utime));

		int sysTicks = std::max(0, static_cast<int>(statData.stime - lastStatData.stime));

		printf("pid %d cpu usage:%.1f%%\n", pid, cpuUsage(userTicks, sysTicks, period, clockTicks) * 100);

	}

	ticks++;

	lastStatData = statData;

}

int main(int argc, char* argv[]) {

	if (argc < 2) {

		printf("Usage: %s pid\n", argv[0]);

		return 0;

	}

	pid = atoi(argv[1]);

	if (!processExists(pid)) {

		printf("Process %d doesn't exist.\n", pid);

    	return 1;

	}

	if (signal(SIGALRM, tick) == SIG_ERR) {

		exit(0);

	}

	struct itimerval tick;

	memset(&tick, 0, sizeof tick);

	tick.it_value.tv_sec = period;

	tick.it_value.tv_usec = 0;

	tick.it_interval.tv_sec = period;

	tick.it_interval.tv_usec = 0;

	setitimer(ITIMER_REAL, &tick, NULL);

	while (1) {

		pause();

	}

	return 0;

}
代码很简单,每隔两秒采一次样,计算这两秒内指定进程的CPU使用率。
为了测试,先将前文的cputest运行起来,该程序会占满8个logic core。
./cputest &,然后top看下CPU使用率,大约占用了800%的CPU。
867 root 20 0 84312 616 416 S 800.0 0.0 17:44.60 cputest
接着用我们的自己的写的程序看下,pid是867,
./cpumon 867
pid 867 cpu usage:786.0%

pid 867 cpu usage:785.5%

pid 867 cpu usage:787.5%

pid 867 cpu usage:759.5%

pid 867 cpu usage:781.5%

pid 867 cpu usage:791.5%

pid 867 cpu usage:743.5%

pid 867 cpu usage:782.0%

pid 867 cpu usage:777.5%

pid 867 cpu usage:785.0%

pid 867 cpu usage:790.5%

pid 867 cpu usage:786.0%

^C
可以看到每隔两秒都会计算一次,使用率略低于800%,也可以理解,因为现在cpumon也会占用一定的CPU时间。
参考资料:
CPU Basics: Multiple CPUs, Cores, and Hyper-Threading Explained
CPU使用率原理及计算方式的更多相关文章
- Linux c 获取cpu使用率(2)
上一篇博文当中,我们谈论了在Linux中如何获取执行命令行的结果,最终得到cpu的 使用率,但是十分不幸的事情是: 1)通过top -n 1 | grep Cpu获取的cpu使用率不会刷新,每次读取结 ...
- 【转】STM32: 一种计算CPU使用率的方法及其实现原理
1 前言出于性能方面的考虑,有的时候,我们希望知道CPU的使用率为多少,进而判断此CPU的负载情况和对于当前运行环境是否足够“胜任”.本文将介绍一种计算CPU占有率的方法以及其实现原理. 2 移植 ...
- Linux平台Cpu使用率的计算
proc文件系统 /proc文件系统是一个伪文件系统,它只存在内存当中,而不占用外存空间.它以文件系统的方式为内核与进程提供通信的接口.用户和应用程序可以通过/proc得到系统的信息,并可以改变内核的 ...
- CPU使用率计算
昨天接到临时任务,需要将一个工作线程执行真正工作的时机推迟到CPU空闲时执行.当时第一感觉认为是将线程优先级设置为空闲级别就行了,以为只有CPU空闲下来才会去跑这个线程,实际上应该不是,毕竟即时是空闲 ...
- 在linux系统中实现各项监控的关键技术(1)--cpu使用率的计算
转载自 Linux中通过/proc/stat等文件计算Cpu使用率 http://www.blogjava.net/fjzag/articles/317773.html proc文件系统 /proc文 ...
- Linux中通过/proc/stat等文件计算Cpu使用率
Linux平台Cpu使用率的计算 proc文件系统 /proc文件系统是一个伪文件系统,它只存在内存当中,而不占用外存空间.它以文件系统的方式为内核与进程提供通信的接口.用户和应用程序可以通过/pro ...
- Linux CPU使用率的计算
CPU 使用率衡量的是程序运行占用的CPU 百分比.Linux 的CPU 使用率信息可以通过/proc/stat 文件计算得到. proc 文件系统 /proc 文件系统是一个伪 ...
- 笔记整理:计算CPU使用率 ----linux 环境编程 从应用到内核
linux 提供time命令统计进程在用户态和内核态消耗的CPU时间: [root@localhost ~]# time sleep real 0m2.001s user 0m0.001s sys 0 ...
- java程序中线程cpu使用率计算
原文地址:https://www.imooc.com/article/27374 最近确实遇到题目上的刚需,也是花了一段时间来思考这个问题. cpu使用率如何计算 计算使用率在上学那会就经常算,不过往 ...
随机推荐
- Docker综述
Docker综述 1.Docker是干什么的? 2.Docker的核心:镜像.容器.仓库 2.1 容器与虚拟机的区别 2.2 仓库 Docker作用 3.Docker的使用 1.Docker是干什么的 ...
- 小白搭建WAMP详细教程---apache、mysql、php的整合配置
Apache与PHP整合 我们之前说过PHP能够解析PHP代码, 可是不服务于apache,apache能够获取接收浏览器的请求, 可是不能处理PHP代码, 要实现动态站点开发,就必须结合apache ...
- labuladong 算法小抄
<labuladong的算法小抄官方完整版> 本书目前可以手把手带你解决 110 道 LeetCode 算法问题,而且在不断更 新,全部基于 LeetCode 的题目,涵盖了所有题型和技巧 ...
- 设计模式(十四)——模板模式(SpringIOC源码分析)
1 豆浆制作问题 编写制作豆浆的程序,说明如下: 1) 制作豆浆的流程 选材--->添加配料--->浸泡--->放到豆浆机打碎 2) 通过添加不同的配料,可以制作出不同口味的豆浆 3 ...
- 动态规划TG.lv(1) (洛谷提高历练地)
动态规划TG.lv(1) P1005 矩阵取数游戏 分析:每行不超过80个数字,直接区间DP即可,\(dp[i][j]\)表示区间\([i,j]\)之间取数可以得到的答案,每次向右或者向左扩展即可.但 ...
- Codeforces Round #687 (Div. 2, based on Technocup 2021 Elimination Round 2) D. XOR-gun (二进制,异或,前缀和)
题意:给你一组非递减的数,你可以对两个连续的数进行异或,使其合并为一个数,问最少操作多少次使得这组数不满足非递减. 题解:首先,给出的这组数是非递减的,我们考虑二进制,对于三个连续的非递减的最高位相同 ...
- Codeforces Global Round 4 B. WOW Factor (前缀和,数学)
题意:找出序列中有多少子序列是\(wow\),但是\(w\)只能用\(vv\)来表示. 题解:我们分别记录连续的\(v\)和\(o\)的个数,用\(v1\)和\(v2\)存,这里要注意前导\(o\)不 ...
- Windows环境下Node.js环境搭建
1.Node.js下载与安装 https://nodejs.org/zh-cn/download/ Windows现在windows安装包(.msi),现在后手动安装,安装目录无要求,选项默认即可 2 ...
- Explain 索引优化分析
Explain 语法 # 语法 explain + DQL语句 mysql> explain select * from city where countrycode ='CHN' or cou ...
- spring再学习之基本概念
二.spring之IOC与DI 注入的方式: set方法注入: 构造方法注入: 字段注入: 注入类型: 值类型注入:8中基本类型 引用类型注入: BeanFaactory是原始接口:功能比较单一. A ...