Prometheus为你的SpringBoot应用保驾护航
前面我们介绍了Prometheus的作用和整体的架构,相信大家对Prometheus有了一定的了解。
具体可以查看这篇文章:https://mp.weixin.qq.com/s/QoAs0-AYy8krWTa3HbmJZA
今天着重介绍下如何在项目中将Prometheus用起来,结合漂亮的图表做数据展示,真的非常帅气。
使用之前先介绍一个Micrometer,Micrometer 是一款监控指标的度量类库,提供了对各种指标的监控。比如JVM, 线程池,数据库连接池等。
项目集成
首先在项目中添加下面的Maven依赖,如下:
<dependency>

    <groupId>org.springframework.boot</groupId>

    <artifactId>spring-boot-starter-actuator</artifactId>

</dependency>

<dependency>

    <groupId>io.micrometer</groupId>

    <artifactId>micrometer-registry-prometheus</artifactId>

    <version>1.5.9</version>

</dependency>
增加对应的配置,如下:
management:

  endpoints:

    web:

      exposure:

        include: "*"

  metrics:

    tags:

      application: ${spring.application.name}
exposure.include配置你要暴露的端点信息,全部就配置成 * 号。
tags.application配置成跟服务名一样即可。
访问/actuator/prometheus就可以看到很多指标数据了,至于这些数据是怎么出来的就不做过多讲解,对应的代码都在micrometer-registry-prometheus包中,大家可以自己去研究下。
# HELP hikaricp_connections_max Max connections

# TYPE hikaricp_connections_max gauge

hikaricp_connections_max{application="haomai-customer",pool="HikariPool-1",} 10.0

# HELP process_start_time_seconds Start time of the process since unix epoch.

# TYPE process_start_time_seconds gauge

process_start_time_seconds{application="haomai-customer",} 1.611642684781E9

# HELP jvm_gc_max_data_size_bytes Max size of old generation memory pool

# TYPE jvm_gc_max_data_size_bytes gauge

jvm_gc_max_data_size_bytes{application="haomai-customer",} 2.68435456E8

# HELP tomcat_sessions_created_sessions_total

# TYPE tomcat_sessions_created_sessions_total counter

tomcat_sessions_created_sessions_total{application="haomai-customer",} 0.0
数据采集
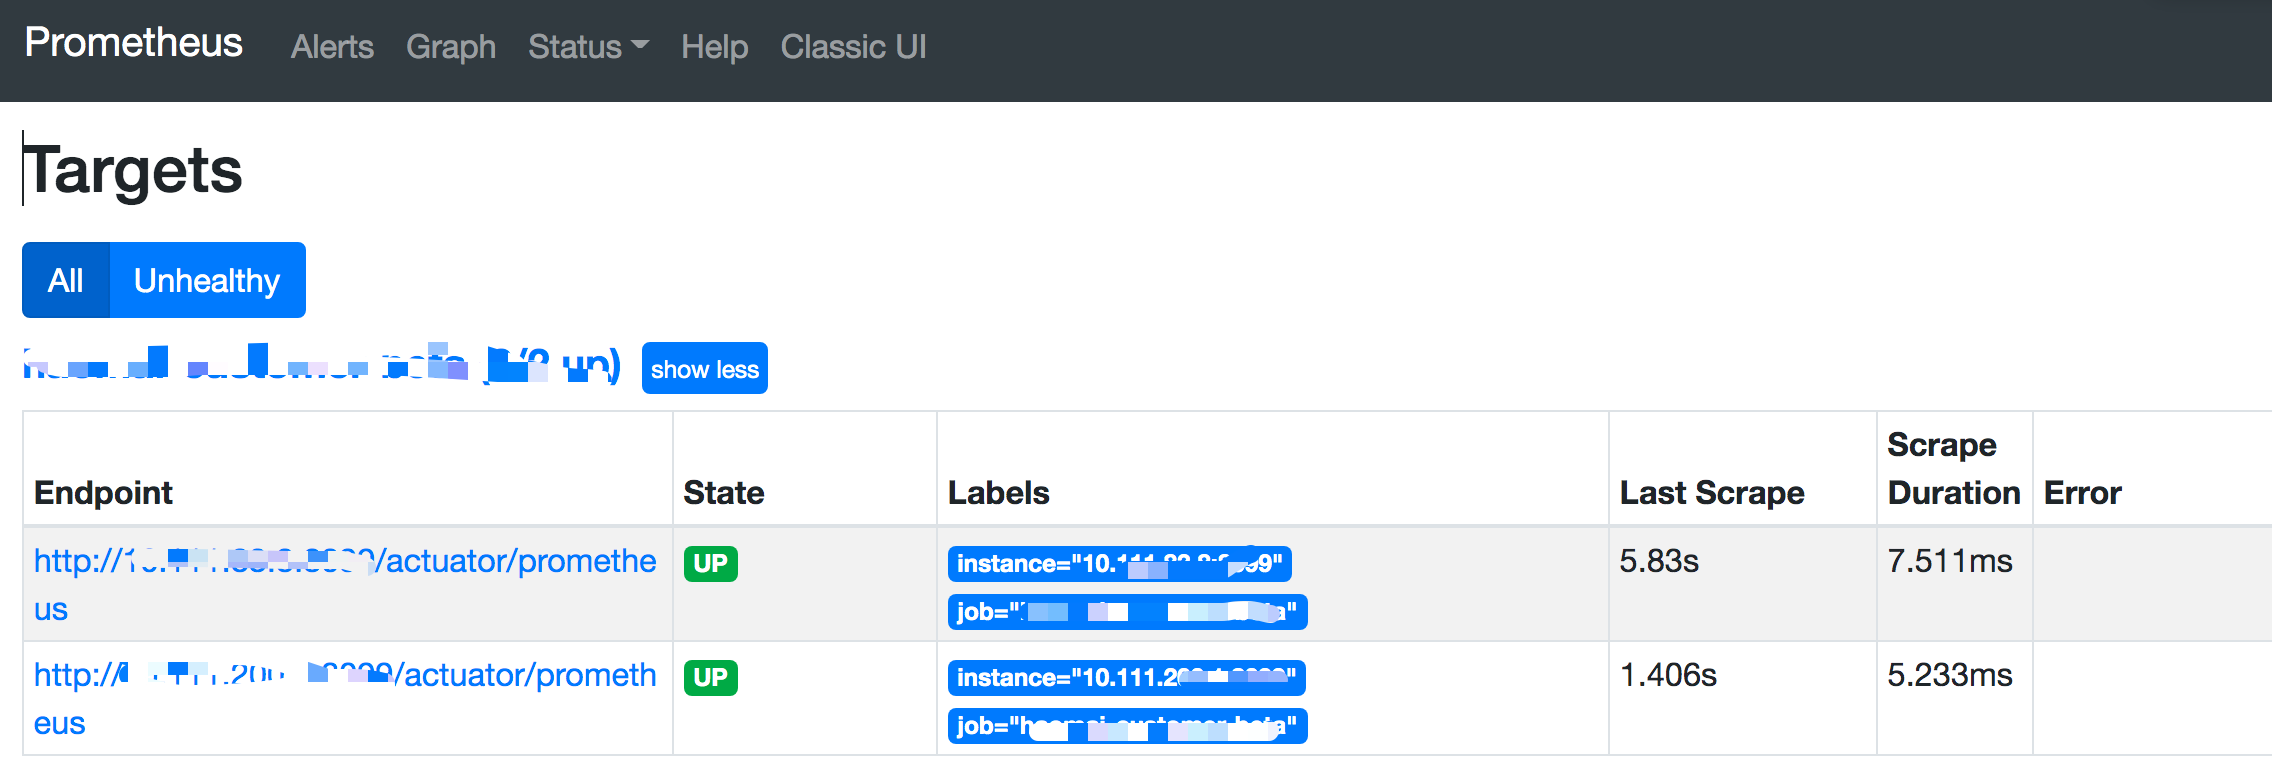
如果没有做服务动态发现,那就手动修改Prometheus配置文件,新增一个任务进行抓取。
 - job_name: 'haomai-customer-beta'

    scrape_interval: 5s

    metrics_path: '/actuator/prometheus'

    static_configs:

      - targets: ['192.168.1.49:8099']
在Targets中查看是否成功。
数据展示
先去grafana搜一个帅气的图表,地址如下:
https://grafana.com/grafana/dashboards?search=spring%20boot
选第一个就行了,星星数量多点。
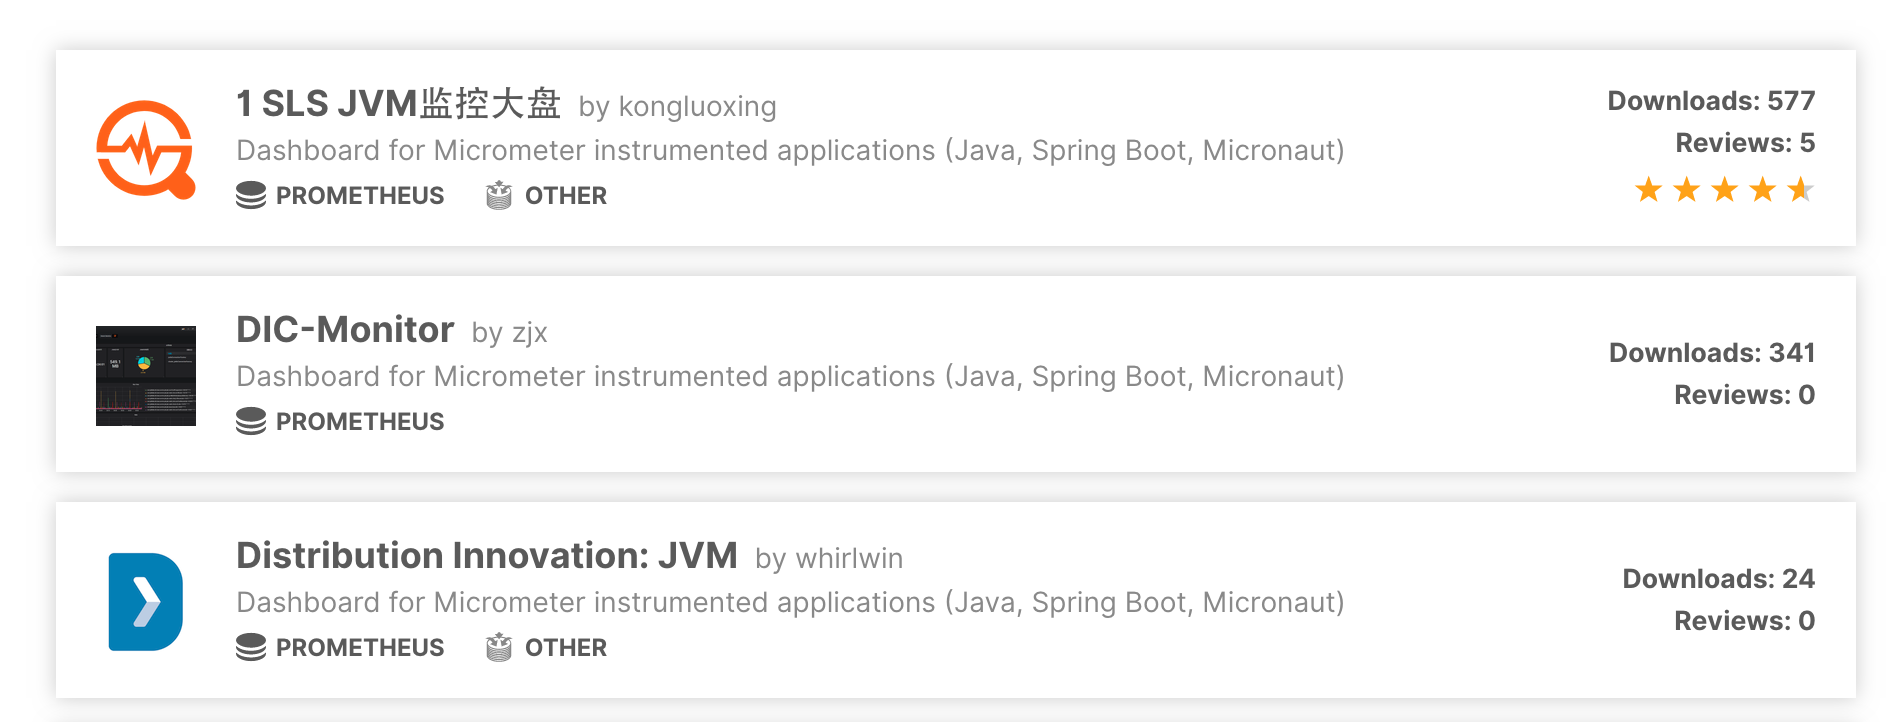
点进去复制图表的编号12856,去grafana中导入即可,选择数据源就可以展示了。
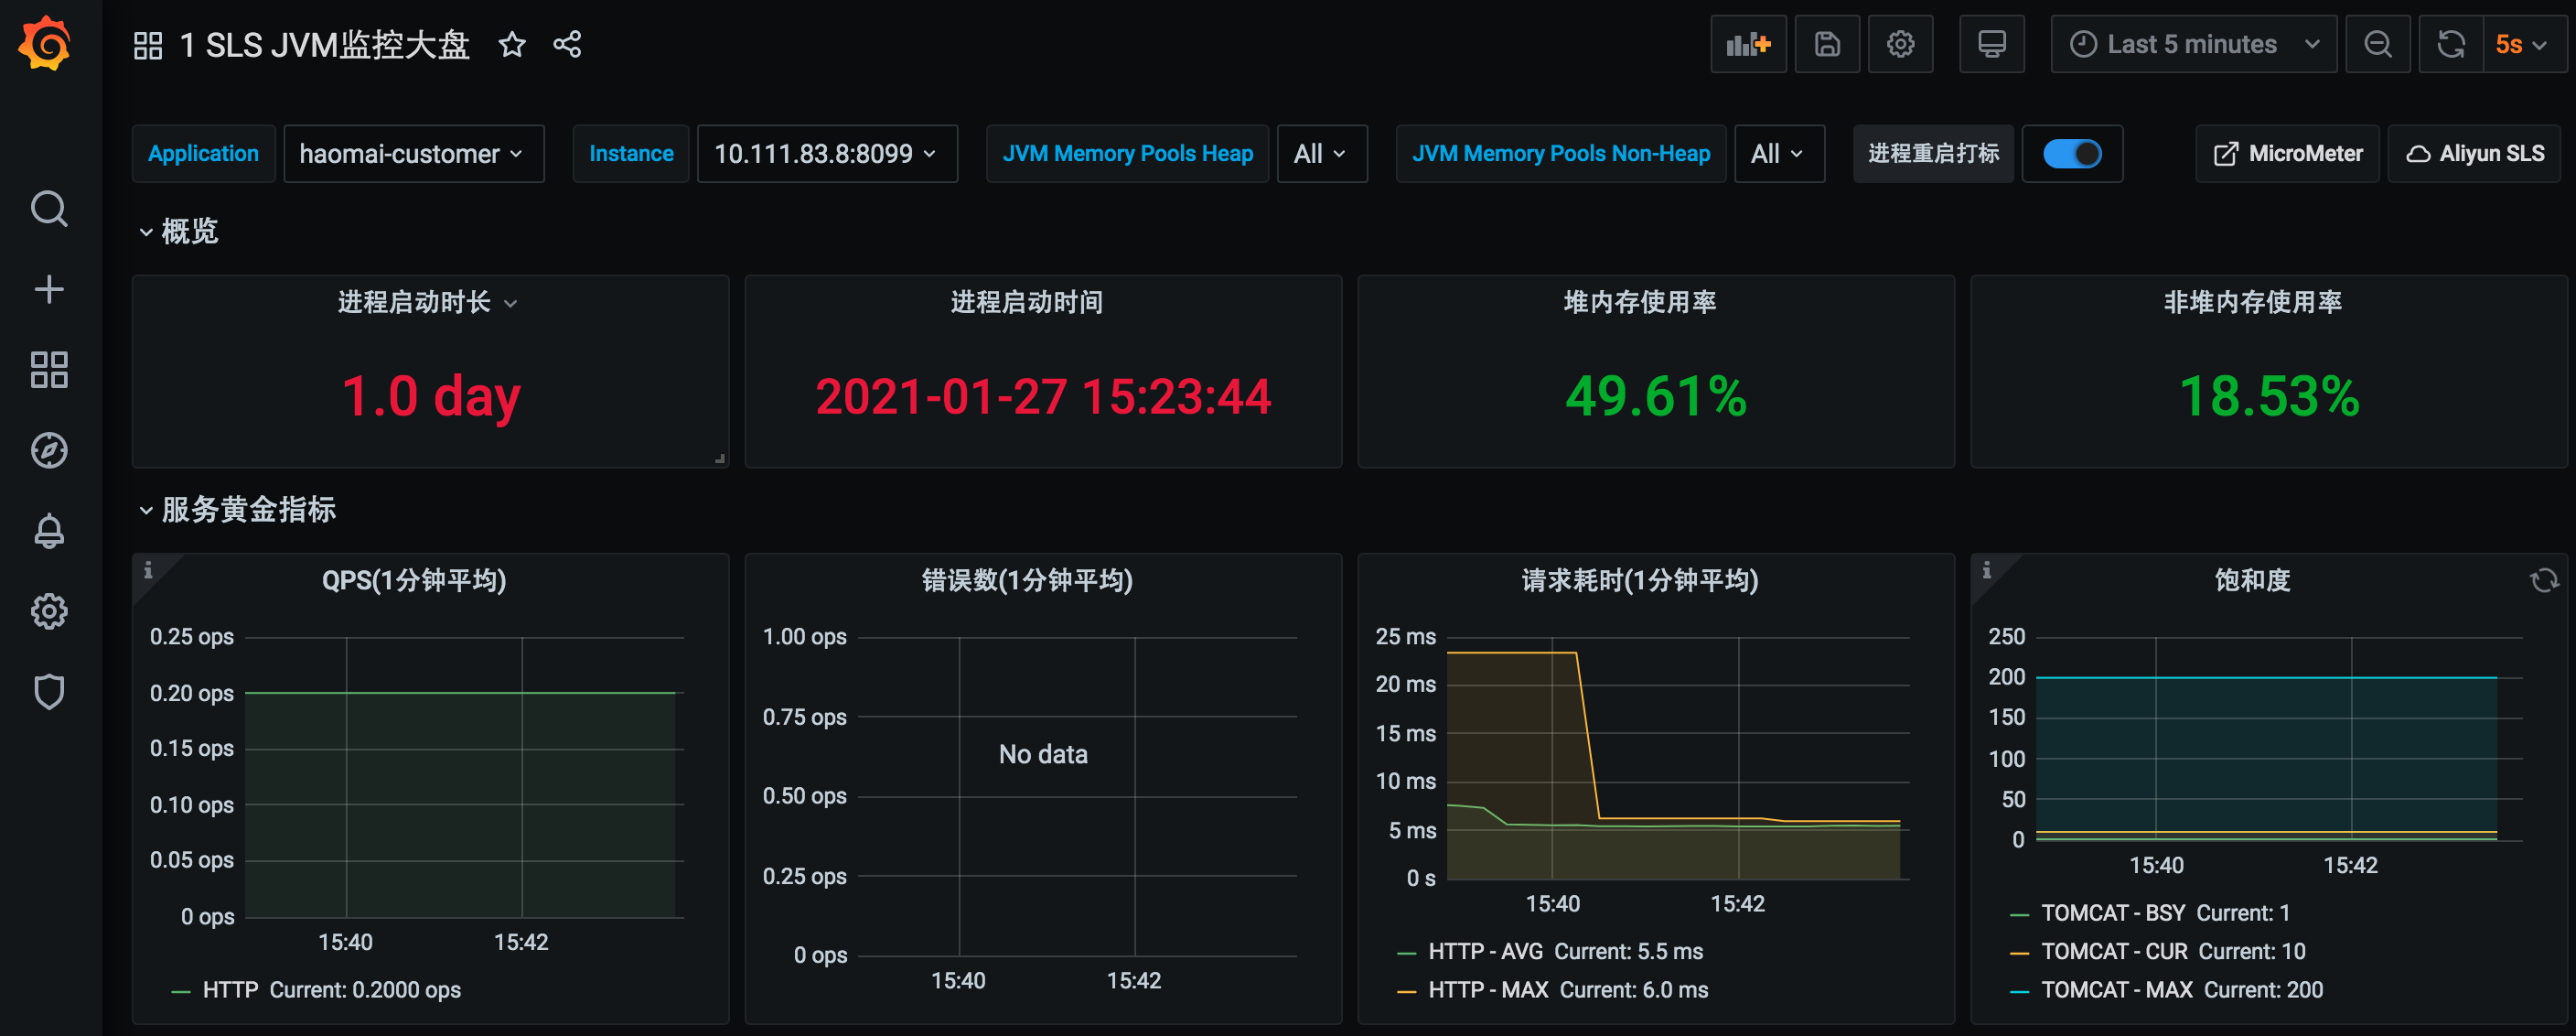
当然像数据库连接之类的也可以去搜专门的图表来展示,或者自定义图表,这个后面再给大家介绍。
同样还有告警也是需要单独做的,可以用grafana自带的告警来做,也可以单独部署Alertmanager来做告警。后续再单独再介绍哈。
关于作者:尹吉欢,简单的技术爱好者,《Spring Cloud微服务-全栈技术与案例解析》, 《Spring Cloud微服务 入门 实战与进阶》作者, 公众号猿天地发起人。
Prometheus为你的SpringBoot应用保驾护航的更多相关文章
- Grafana+Prometheus系统监控之SpringBoot
前言 前一段时间使用SpringBoot创建了一个webhook项目,由于近期项目中也使用了不少SpringBoot相关的项目,趁着周末,配置一下使用prometheus监控微服务Springboot ...
- 基于Docker+Prometheus+Grafana监控SpringBoot健康信息
在微服务体系当中,监控是必不可少的.当系统环境超过指定的阀值以后,需要提醒指定的运维人员或开发人员进行有效的防范,从而降低系统宕机的风险.在CNCF云计算平台中,Prometheus+Grafana是 ...
- Prometheus+Grafana监控SpringBoot
Prometheus+Grafana监控SpringBoot 一.Prometheus监控SpringBoot 1.1 pom.xml添加依赖 1.2 修改application.yml配置文件 1. ...
- SpringCloud使用Prometheus监控(基于Eureka)
本文介绍SpringCloud使用Prometheus,基于Eureka服务发现. 1.Prometheus介绍 在之前写过两篇有关Prometheus使用的文章,如下: <SpringBoot ...
- Prometheus + Node Exporter + Grafana 监控主机运行信息
上一篇文章中讲了如何利用Prometheus和Grafana监控SpringBoot应用的JVM信息,这次就来看看如何监控 服务器运行状态,先列出用到的工具: Prometheus node_ex ...
- SpringCloud使用Sofa-lookout监控(基于Eureka)
本文介绍SpringCloud使用Sofa-lookout,基于Eureka服务发现. 1.前景 本文属于是前几篇文章的后续,其实一开始感觉这个没有什么必要写的,但是最近一个朋友问我关于这个的问题,所 ...
- SpringBoot使用prometheus监控
本文介绍SpringBoot如何使用Prometheus配合Grafana监控. 1.关于Prometheus Prometheus是一个根据应用的metrics来进行监控的开源工具.相信很多工程都在 ...
- Grafana+Prometheus打造springboot监控平台
1. 环境 springboot 1.5.10.RELEASE Grafana 5.4.2 Prometheus 2.6.0 jdk 1.8 2.通过micrometer与springboot应用和p ...
- 使用Prometheus监控SpringBoot应用
通过之前的文章我们使用Prometheus监控了应用服务器node_exporter,数据库mysqld_exporter,今天我们来监控一下你的应用.(本文以SpringBoot 2.1.9.REL ...
随机推荐
- 基于socket的netty demo
前面一文说了 基于http的netty demo 和http不一样,http可以用浏览器来充当客户端调用,所以基于socket的netty,必须要编写客户端和服务器的代码 实现功能: 客户端给服务器发 ...
- Daphile FAQ -- 官方文档译文 [原创]
Daphile FAQ 英文原文:https://www.daphile.com/download/FAQ.txt 采集日期:2021-01-03 常见问题解答:(FAQ) Q1:没有声音.Daphi ...
- 每日一个linux命令5 -- rm
rm命令.rm是常用的命令,该命令的功能为删除一个目录中的一个或多个文件或目录,它也可以将某个目录及其下的所有文件及子目录均删除.对于链接文件,只是删除了链接,原有文件均保持不变. rm是一个危险的命 ...
- idea多模块启动
2018版本的idea 原文链接http://zhhll.icu/2020/04/07/idea/idea%E4%B9%8B%E5%A4%9A%E6%A8%A1%E5%9D%97%E5%90%AF%E ...
- DM TDD使用小结
1.搭建流程 1.1 ss初始化及启动 --->1节点: cd /dm/bin ./dmdssinit path=/dm/data inst=ss1 port=35300 REGION_SIZE ...
- python常见题型
语言特性 1. 谈谈对 Python 和其他语言的区别 2. 简述解释型和编译型编程语言 3. Python 的解释器种类以及相关特点? 4. Python3 和 Python2 的区别? 5. Py ...
- redis之集群二:哨兵
回顾 上一篇介绍了Redis的主从集群模式,这个集群模式配置很简单,只需要在Slave的节点上进行配置,Master主节点的配置不需要做任何更改.但是,我们发现这种集群模式当主节点宕机,主从无法自动切 ...
- 【Web】实现动态文章列表
简单记录 -慕课网- 步骤二:动态文章列表效果 实现这个 一个网页中常见的文章列表效果. 怎么实现文章列表案例 分解一波,CSS来改变样式 标题标签 HTML的无序列表 去掉项目符号 符号所占空间 列 ...
- 【EXPDP】导出全部表的时候,选择不导出某个表
导出的时候指定某一张表不导出的话,一般都用的是数据泵的expdp来操作 具体方法是: expdp test/test dumpfile=test.dmp directory=test_dir excl ...
- 【Oracle】生成随机数
Oracle生成随机数: dbms_random.string(opt, 6) --括号里的opt要从下面的列表中选择,数字代表要生成几位随机数,如果是1位的话,就改成1 以此类推 opt可取 ...