Prometheus为你的SpringBoot应用保驾护航
前面我们介绍了Prometheus的作用和整体的架构,相信大家对Prometheus有了一定的了解。
具体可以查看这篇文章:https://mp.weixin.qq.com/s/QoAs0-AYy8krWTa3HbmJZA
今天着重介绍下如何在项目中将Prometheus用起来,结合漂亮的图表做数据展示,真的非常帅气。
使用之前先介绍一个Micrometer,Micrometer 是一款监控指标的度量类库,提供了对各种指标的监控。比如JVM, 线程池,数据库连接池等。
项目集成
首先在项目中添加下面的Maven依赖,如下:
<dependency>

    <groupId>org.springframework.boot</groupId>

    <artifactId>spring-boot-starter-actuator</artifactId>

</dependency>

<dependency>

    <groupId>io.micrometer</groupId>

    <artifactId>micrometer-registry-prometheus</artifactId>

    <version>1.5.9</version>

</dependency>
增加对应的配置,如下:
management:

  endpoints:

    web:

      exposure:

        include: "*"

  metrics:

    tags:

      application: ${spring.application.name}
exposure.include配置你要暴露的端点信息,全部就配置成 * 号。
tags.application配置成跟服务名一样即可。
访问/actuator/prometheus就可以看到很多指标数据了,至于这些数据是怎么出来的就不做过多讲解,对应的代码都在micrometer-registry-prometheus包中,大家可以自己去研究下。
# HELP hikaricp_connections_max Max connections

# TYPE hikaricp_connections_max gauge

hikaricp_connections_max{application="haomai-customer",pool="HikariPool-1",} 10.0

# HELP process_start_time_seconds Start time of the process since unix epoch.

# TYPE process_start_time_seconds gauge

process_start_time_seconds{application="haomai-customer",} 1.611642684781E9

# HELP jvm_gc_max_data_size_bytes Max size of old generation memory pool

# TYPE jvm_gc_max_data_size_bytes gauge

jvm_gc_max_data_size_bytes{application="haomai-customer",} 2.68435456E8

# HELP tomcat_sessions_created_sessions_total

# TYPE tomcat_sessions_created_sessions_total counter

tomcat_sessions_created_sessions_total{application="haomai-customer",} 0.0
数据采集
如果没有做服务动态发现,那就手动修改Prometheus配置文件,新增一个任务进行抓取。
 - job_name: 'haomai-customer-beta'

    scrape_interval: 5s

    metrics_path: '/actuator/prometheus'

    static_configs:

      - targets: ['192.168.1.49:8099']
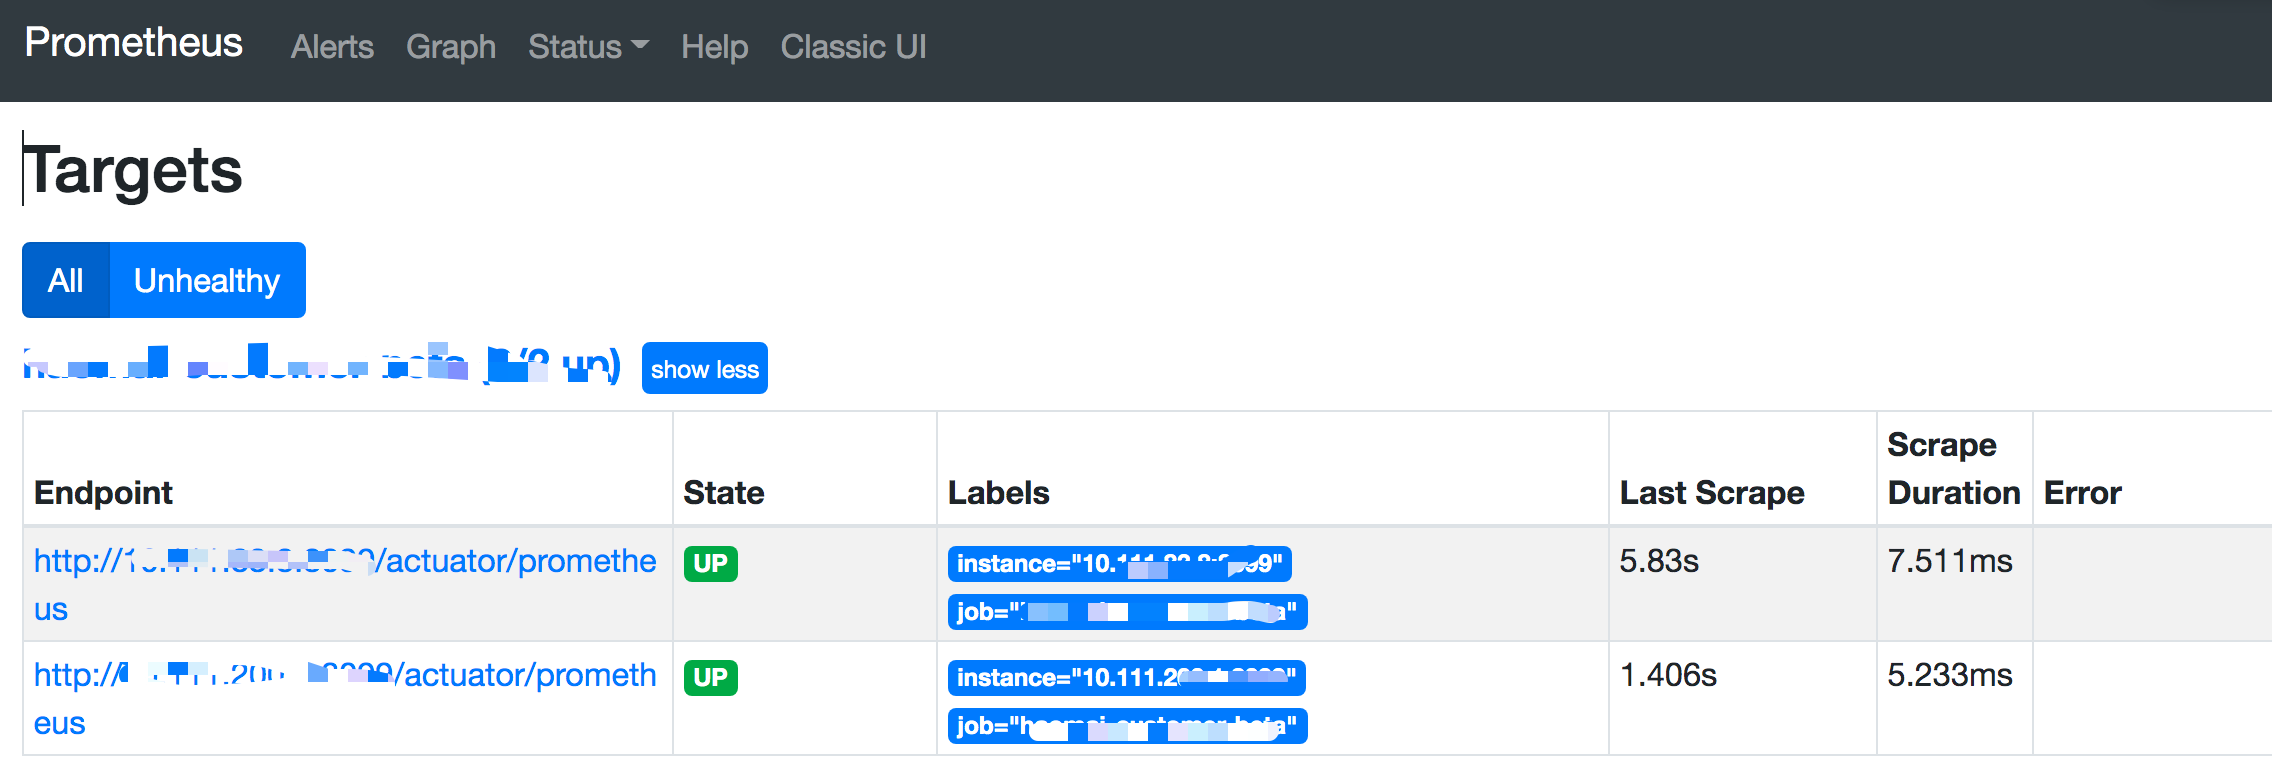
在Targets中查看是否成功。
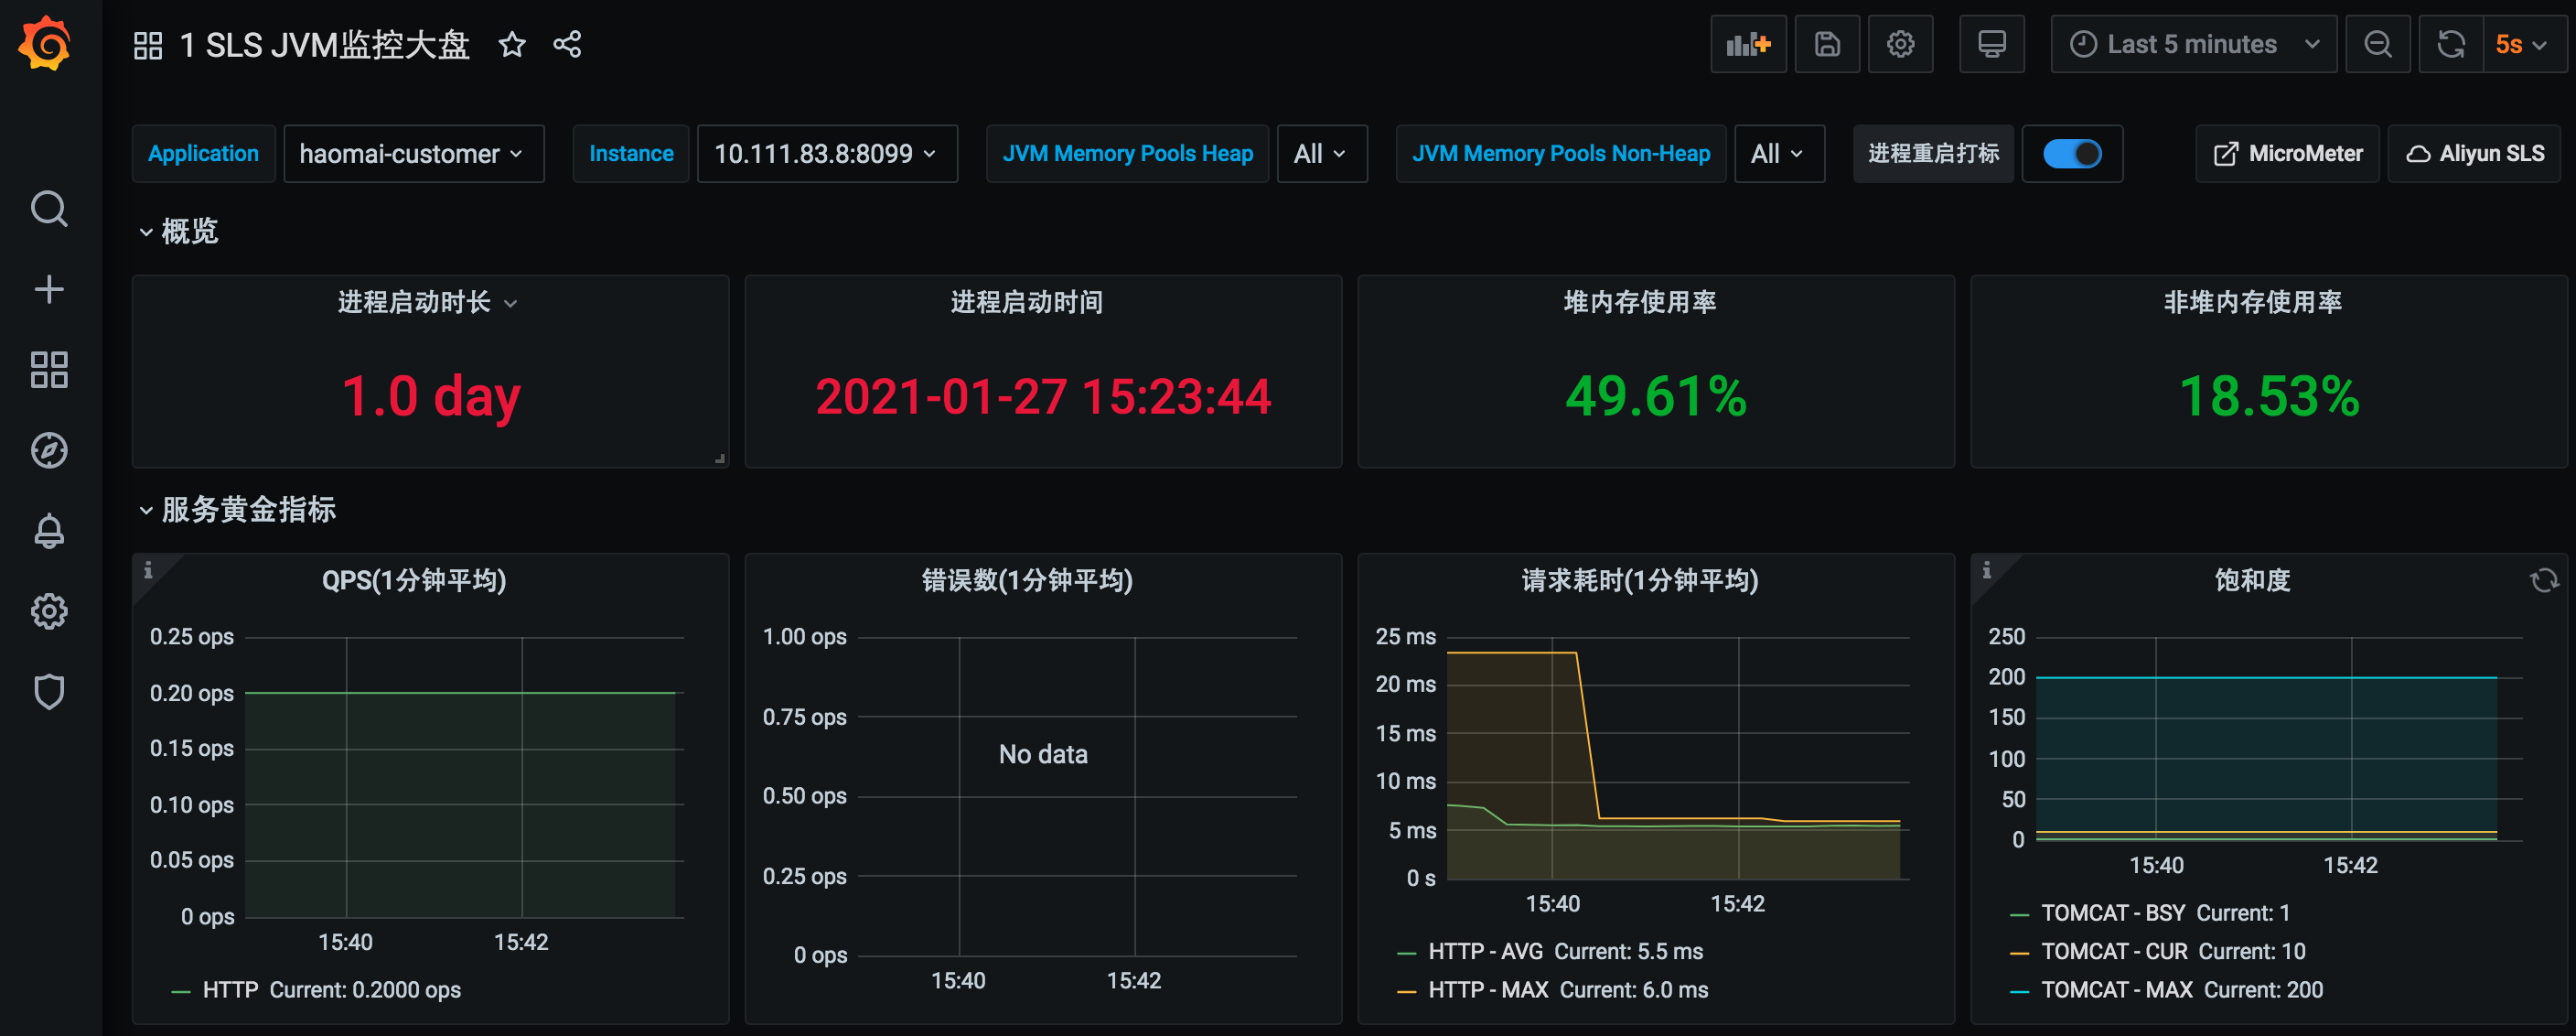
数据展示
先去grafana搜一个帅气的图表,地址如下:
https://grafana.com/grafana/dashboards?search=spring%20boot
选第一个就行了,星星数量多点。
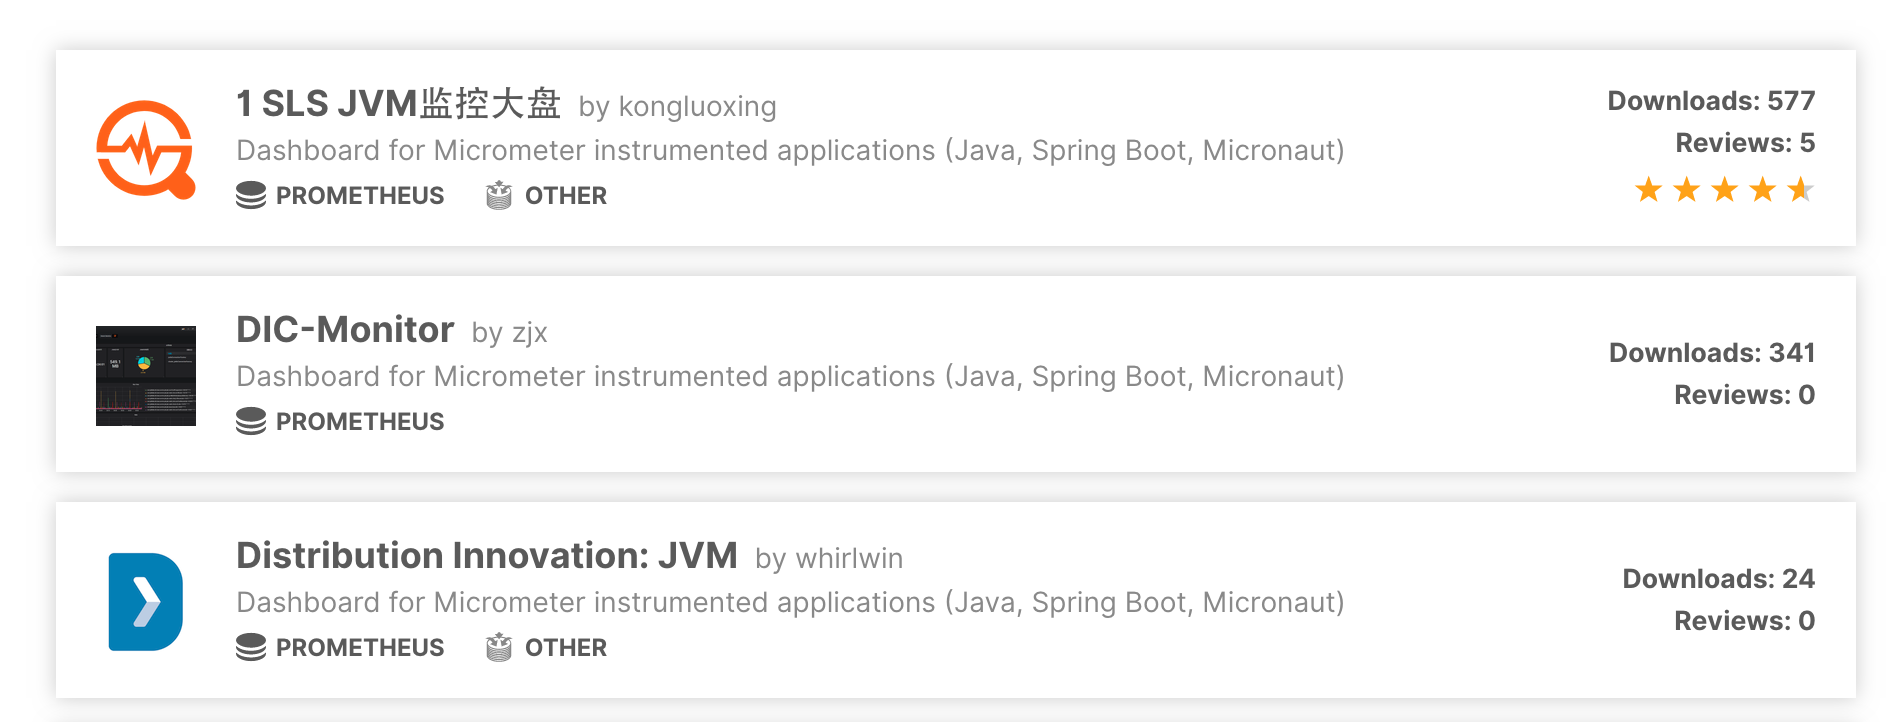
点进去复制图表的编号12856,去grafana中导入即可,选择数据源就可以展示了。
当然像数据库连接之类的也可以去搜专门的图表来展示,或者自定义图表,这个后面再给大家介绍。
同样还有告警也是需要单独做的,可以用grafana自带的告警来做,也可以单独部署Alertmanager来做告警。后续再单独再介绍哈。
关于作者:尹吉欢,简单的技术爱好者,《Spring Cloud微服务-全栈技术与案例解析》, 《Spring Cloud微服务 入门 实战与进阶》作者, 公众号猿天地发起人。
Prometheus为你的SpringBoot应用保驾护航的更多相关文章
- Grafana+Prometheus系统监控之SpringBoot
前言 前一段时间使用SpringBoot创建了一个webhook项目,由于近期项目中也使用了不少SpringBoot相关的项目,趁着周末,配置一下使用prometheus监控微服务Springboot ...
- 基于Docker+Prometheus+Grafana监控SpringBoot健康信息
在微服务体系当中,监控是必不可少的.当系统环境超过指定的阀值以后,需要提醒指定的运维人员或开发人员进行有效的防范,从而降低系统宕机的风险.在CNCF云计算平台中,Prometheus+Grafana是 ...
- Prometheus+Grafana监控SpringBoot
Prometheus+Grafana监控SpringBoot 一.Prometheus监控SpringBoot 1.1 pom.xml添加依赖 1.2 修改application.yml配置文件 1. ...
- SpringCloud使用Prometheus监控(基于Eureka)
本文介绍SpringCloud使用Prometheus,基于Eureka服务发现. 1.Prometheus介绍 在之前写过两篇有关Prometheus使用的文章,如下: <SpringBoot ...
- Prometheus + Node Exporter + Grafana 监控主机运行信息
上一篇文章中讲了如何利用Prometheus和Grafana监控SpringBoot应用的JVM信息,这次就来看看如何监控 服务器运行状态,先列出用到的工具: Prometheus node_ex ...
- SpringCloud使用Sofa-lookout监控(基于Eureka)
本文介绍SpringCloud使用Sofa-lookout,基于Eureka服务发现. 1.前景 本文属于是前几篇文章的后续,其实一开始感觉这个没有什么必要写的,但是最近一个朋友问我关于这个的问题,所 ...
- SpringBoot使用prometheus监控
本文介绍SpringBoot如何使用Prometheus配合Grafana监控. 1.关于Prometheus Prometheus是一个根据应用的metrics来进行监控的开源工具.相信很多工程都在 ...
- Grafana+Prometheus打造springboot监控平台
1. 环境 springboot 1.5.10.RELEASE Grafana 5.4.2 Prometheus 2.6.0 jdk 1.8 2.通过micrometer与springboot应用和p ...
- 使用Prometheus监控SpringBoot应用
通过之前的文章我们使用Prometheus监控了应用服务器node_exporter,数据库mysqld_exporter,今天我们来监控一下你的应用.(本文以SpringBoot 2.1.9.REL ...
随机推荐
- python使用smtplib和email库发送邮件
国内很多服务器提供商都默认禁止了smtp默认的25端口服务,而启用465端口发送邮件 在smtplib库中直接调用SMTP_SSL就是默认使用465端口 示例代码如下: def send_eamil( ...
- Java学习日报7.29
package student;import java.util.*;public class student { Scanner sc=new Scanner(System.in); private ...
- 使用pdf.js aspose各种文档转PDF 版本对应license.xml 去水印破解
在使用pdf.js途中,使用aspose转换的文件一直有水印,在网上找了许多破解办法都是已经失效的,于是乎,就查看了一下jar的源码,找到了版本对应的破解字符(如下):对应版本为 aspose-wor ...
- 高效扩展工具让 VS Code 如虎添翼
Codelf 变量命名神器 Star:10688 https://github.com/unbug/codelf 新建项目,变量,类,方法,接口都需要命名,一个好的命名可以一眼看出这个地方的功能,Co ...
- Linux服务器初始化调优及安全加固
一,开启iptables 仅开放必要的SSH端口和监控端口 示例:SSH tcp 22snmpd udp 161nrpe tcp 5666本人公网IP全端口开放 二,除非特别熟悉selinux配置,否 ...
- vue中添加文字或图片水印
首先引用warterMark.js,内容如下 'use strict' var watermark = (className,str,type) => { let dom = document. ...
- Python 中的行向量、列向量和矩阵
1.一维数组 一维数组既不是行向量,也不是列向量. import numpy as npa=np.array([1,2,3])print(np.shape(a))>>>(3,) 2. ...
- 【MySQL 高级】索引优化分析
MySQL高级 索引优化分析 SQL 的效率问题 出现性能下降,SQL 执行慢,执行时间长,等待时间长等情况,可能的原因有: 查询语句写的不好 索引失效 单值索引:在 user 表中给 name 属性 ...
- 剑指 Offer 16. 数值的整数次方
实现函数double Power(double base, int exponent),求base的exponent次方.不得使用库函数,同时不需要考虑大数问题. 来源:力扣(LeetCode) 链接 ...
- python中列表的insert和append的效率对比
python中insert和append方法都可以向列表中插入数据只不过append默认插入列表的末尾,insert可以指定位置插入元素. 我们来测试一下他俩插入数据的效率: 测试同时对一个列表进行插 ...