
pyhton课堂随笔-基本画图
%matplotlib inline

import matplotlib as mpl

import  matplotlib.pyplot as plt

import numpy as np

import pandas as pd
#首先导入基本的画图包,第一句是必要的
house = pd.read_csv('./housing.csv') # 读取数据,数据文件存放在c根目录下盘可直接这样访问,如果放在文件夹里。可像平常一样加上目录名称
house.describe().loc[['min', 'std', 'max', 'mean'], ['RM', 'MEDV']].round(2) 求均值方差等
可得到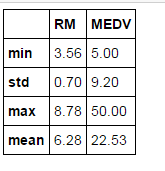
for i in range(4):

print (house.iloc[:, i].corr(house.iloc[:, i+4]).round(2))  #  可得到相关系数
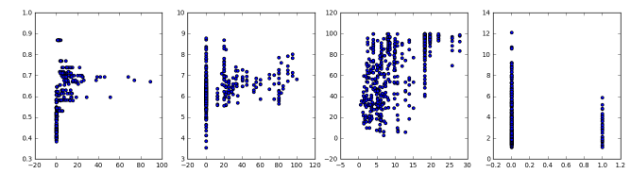
fig, axes = plt.subplots(1, 4, figsize = (16, 4))

for n in range(4):

axes[n].scatter(house.iloc[:, n],house.iloc[:, n+4])  ## 这里开始画图
- 基本概念
- figure:画布
- axes: 坐标轴,或者理解成所画的图形
- 一张画布(figure)可以有很多图(axes)
- 其他
- label: 坐标上的标注
- tickets: 刻度
- legend:图例
- loc = 0: 自动寻找最好的位置
- ncol = 3:分三列
- fontsize
- frameon = True: 边框
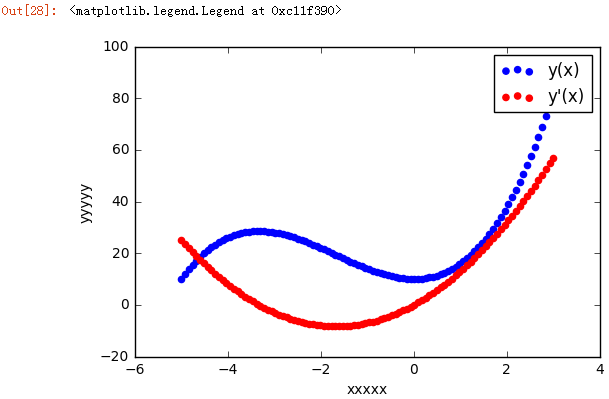
fig, ax = plt.subplots()

ax.plot(x, y1, color = "blue", label = "y(x)")

ax.plot(x, y2, color = "red", label = "y'(x)")

ax.set_xlabel("xxxxx")

ax.set_ylabel("yyyyy")

ax.legend()    # 基本画线图

fig, ax = plt.subplots()

ax.scatter(x, y1, color = "blue", label = "y(x)")

ax.scatter(x, y2, color = "red", label = "y'(x)")

ax.set_xlabel("xxxxx")

ax.set_ylabel("yyyyy")

ax.legend()  #基本画点图
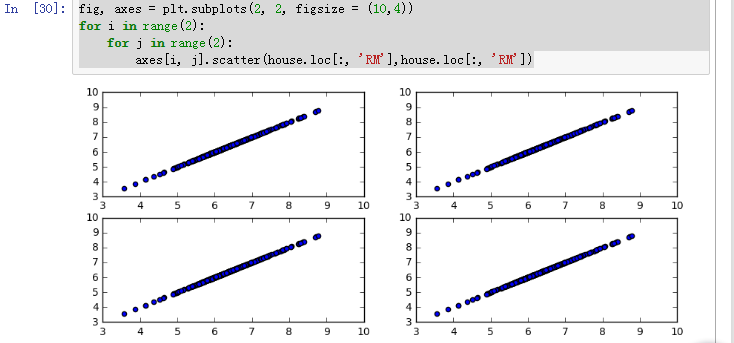
fig, axes = plt.subplots(2, 2, figsize = (10,4))

for i in range(2):

for j in range(2):

axes[i, j].scatter(house.loc[:, 'RM'],house.loc[:, 'RM'])
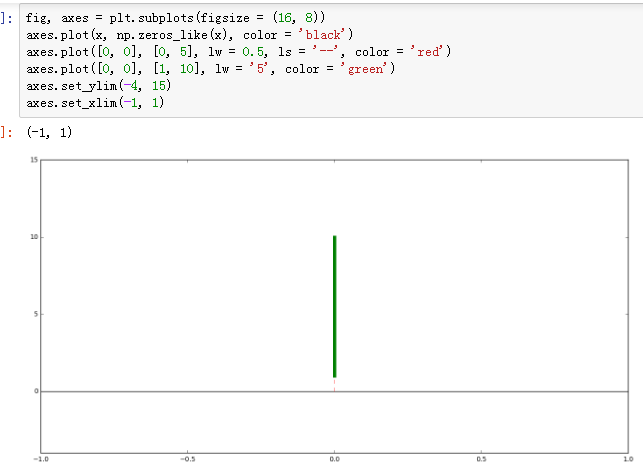
fig, axes = plt.subplots(figsize = (16, 8))

axes.plot(x, np.zeros_like(x), color = 'black')

axes.plot([0, 0], [0, 5], lw = 0.5, ls = '--', color = 'red')

axes.plot([0, 0], [1, 10], lw = '', color = 'green')

axes.set_ylim(4, 15)

axes.set_xlim(-1, 1)
fig, ax = plt.subplots(figsize = (10,4))

ax.plot(x, y1, lw = 1.5, color = 'blue', label = 'Sy(x)s')

ax.plot(x, y2, lw = 1.5, color = 'red', label = 'Sy(x)s')

ax.plot(x, y2, lw = 1.5, color = 'green', label = 'Sy''(x)s')

ax.plot(x, np.zeros_like(x), lw = 0.5, color = 'black')

ax.plot([-3.33, -3.33], [0, (-3,33)**3 + 5*(-3.33)*2 + 10], ls = '--', lw = 0.5, color = 'black')

ax.plot([0, 0], [0, 10], lw = 0.5, ls = '--', color = 'black')

ax.plot([0], [10], lw = 0.5, marker = 'o', color = 'blue')

ax.plot([-3.33], [(-3.33)**3 + 5*(-3.33)**2 + 10], lw = 0.5, marker = 'o', color = 'blue')
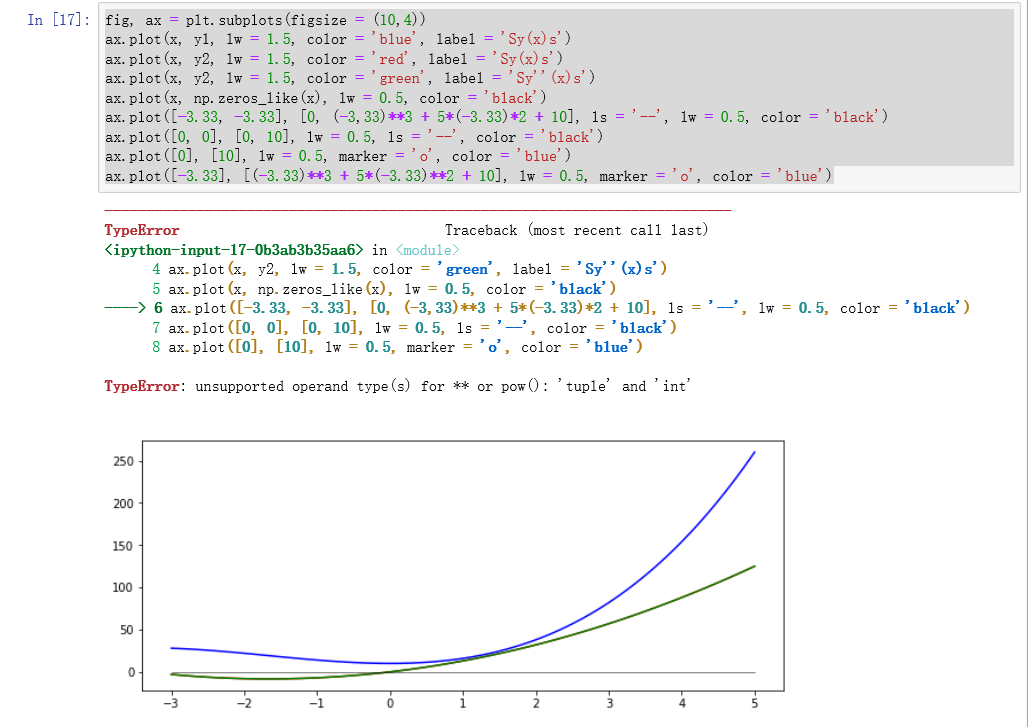
fig = plt.figure(figsize = (8, 2.5), facecolor = "#f1f1f1")

left, bottom, width, height = 0.1, 0.1, 0.8, 0.8

ax = fig.add_axes((left, bottom, width, height), facecolor = "#e1e1e1")

x = np.linspace(-2, 2, 1000)

y1 = np.cos(40*x)

y2 = np.exp(-x*2)

ax.plot(x, y1*y2)

ax.plot(x, y2, 'g')

ax.plot(x, -y2, 'g')

ax.set_xlabel("x")

ax.set_ylabel("y")

fig.savefig("graph.png", dpi = 100, facecolor = "#f1f1f1")

fig.savefig("graph.pdf", dpi = 300, facecolor = "#f1f1f1")

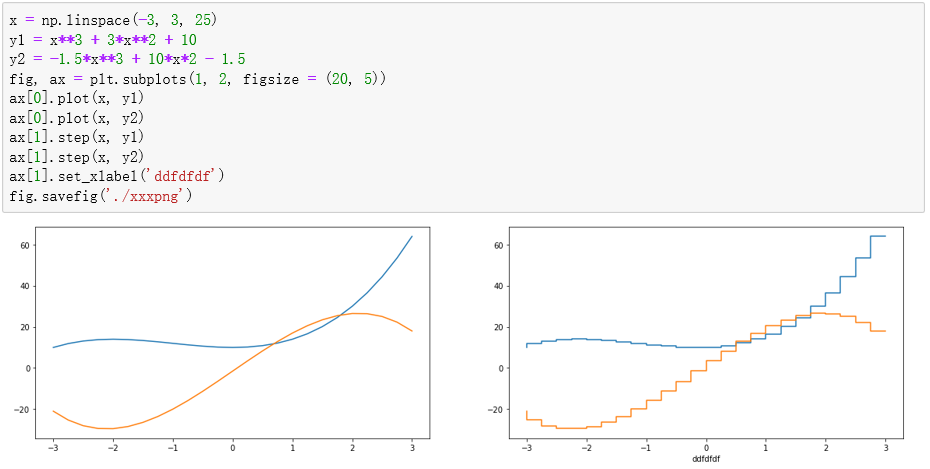
x = np.linspace(-3, 3, 25)

y1 = x**3 + 3*x**2 + 10

y2 = -1.5*x**3 + 10*x*2 - 1.5

fig, ax = plt.subplots(1, 2, figsize = (20, 5))

ax[0].plot(x, y1)

ax[0].plot(x, y2)

ax[1].step(x, y1)

ax[1].step(x, y2)

ax[1].set_xlabel('ddfdfdf')

fig.savefig('./xxxpng')
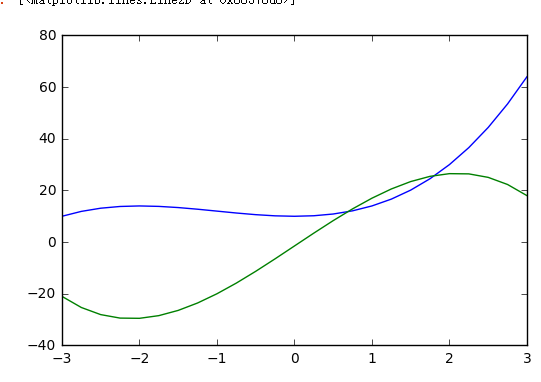
fignum = 0

x = np.linspace(-3, 3, 25)

y1 = x**3 + 3*x**2 + 10

y2 = -1.5*x**3 + 10*x*2 - 1.5

fig, ax = plt.subplots()

ax.plot(x, y1)

ax.plot(x, y2)

def hide_label(fig, ax):

global fignum

ax.set_xtickets([])

ax.set_yticks([])

ax.xaxis.set
fig, ax = plt.subplots(figsize = (10,4))

width = 6/50.0

ax.bar(x - width/2, y1, width = width, color = "blue")

ax.bar(x - width/2, y2, width = width, color = "green")
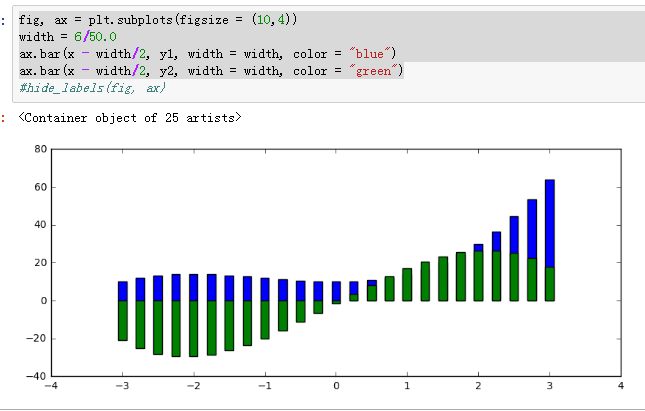
fig, ax = plt.subplots(figsize = (10,4))

ax.fill_between(x, y1, y2)

ax.plot(x, y1, color = 'green', lw = 5)
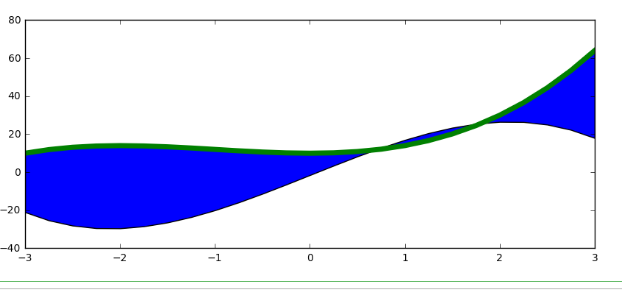
fig, ax = plt.subplots(figsize = (10,4))

ax.hist(y2, bins = 30)

ax.hist(y1, bins = 30)
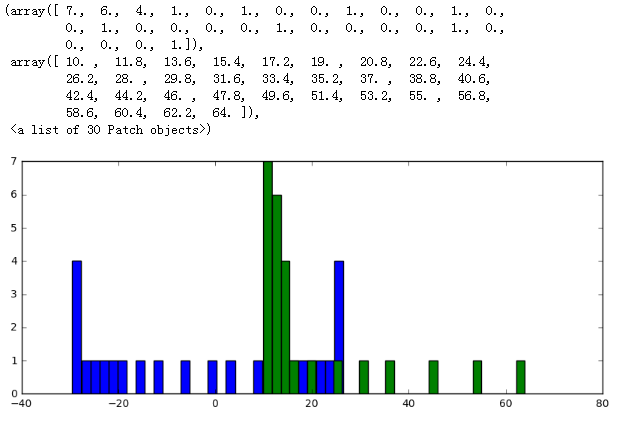
fig, ax = plt.subplots(figsize = (10,4))

ax.errorbar(x, y2, yerr = y1, fmt = 'o-')

ax.plot(x, y1, color = 'red')

ax.plot(x, y2, color = 'black', lw = 5)
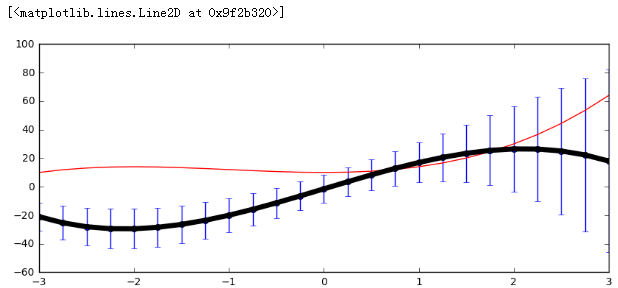
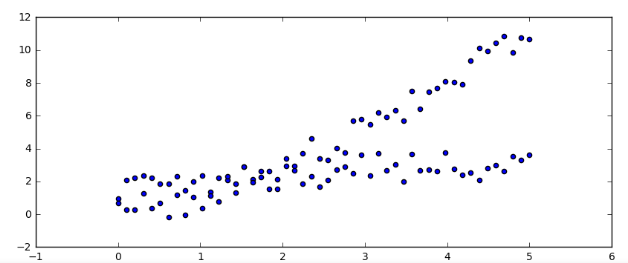
fig, ax = plt.subplots(figsize = (10,4))

x = np.linspace(0, 5, 50)

ax.scatter(x, -1 + x + 0.25*x**2 + 2*np.random.rand(len(x)))

ax.scatter(x, np.sqrt(x) + 2*np.random.rand(len(x)))

s.plot(kind = 'bar')
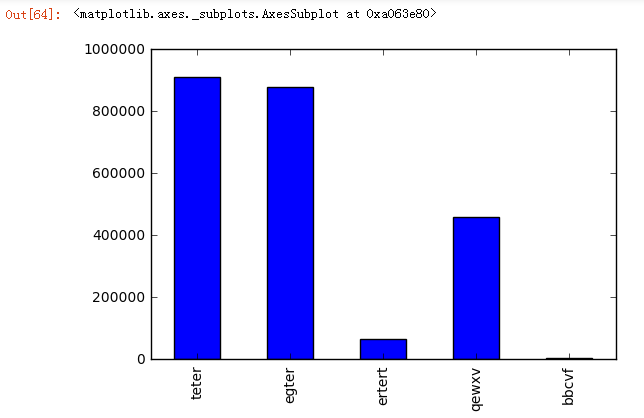
s.plot(kind = 'pie') # 画饼状图
import matplotlib.pyplot as  plt

%matplotlib inline

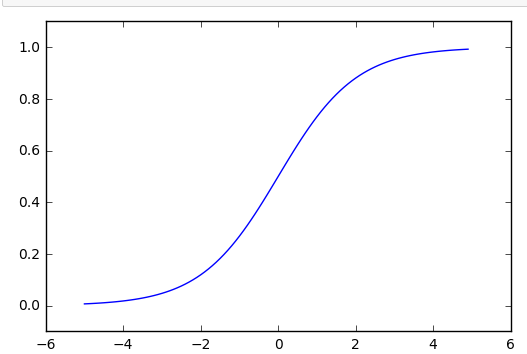
def sigmoid(x):

    return 1/(1+np.exp(-x))

x = np.arange(-5.0, 5.0 ,0.1)

y = sigmoid(x)

plt.plot(x ,y)

plt.ylim(-0.1, 1.1)

plt.show()
a = np.array([[1, 2, 3], [4, 5, 6]])

b = np.array([[1 ,2], [3, 4], [5, 6]])

np.dot(a, b)
#X--------Y

W2 = np.array([[1, 2], [3, 4] ,[5, 6]])

W1 = np.array([[1, 2, 3], [4, 5, 6]])

W3 = np.array([[1, 2], [3, 4]])

b1 = np.array([1, 2, 3])

b2 = np.array([1, 2])

b3 = np.array([1, 2])

X = np.array([1.0, 2.0])

A1 = np.dot(X ,W1) + b1

A2 = np.dot(A1, W2) + b2

Y = np.dot(A2, W3) + b3
#and门

def and_gate(x1, x2):

    if (20*x1 + 20*x2 -30) > 0:

        return 1

    else:

        return 0

x1, x2 = 1, 1

and_gate(x1, x2)
pyhton课堂随笔-基本画图的更多相关文章
- Matlab随笔之画图函数总结
原文:Matlab随笔之画图函数总结 MATLAB函数画图 MATLAB不但擅长於矩阵相关的数值运算,也适合用在各种科学目视表示(Scientific visualization).本节将介绍MATL ...
- 课堂随笔 set (集合)
1.什么是集合:set (集合)为无序不重复的序列. 2.如何创建一个集合:(1)set() 这样就创建了一个空的集合(2)s1={11,22,33}这样也创建了一个集合.(3)s2=set([ ...
- jQuery选择器课堂随笔
$(function(){ //并集选择器 /* $("h2,ul").css("background","pink");* ...
- HTMl课堂随笔
html: 1.超文本标记语言(Hyper Text Markup Lan) 2.不是一种编程语言,而是一种标记语言(Markup Language) 3.标记语言是一套标记标签(Markup Tag ...
- 课堂随笔03--for循环及两个循环中断关键字
for (int i = 1; i <= 8;i++) {} for循环可嵌套,执行指定次数,可用作计数. 用两个for循环嵌套,可以方便控制行列的输出. break:中断循环 continu ...
- 课堂随笔02--c#中string作为引用类型的特殊性
using System; namespace Test { class Test1 { static void Main(string[] args) { string str1 = "1 ...
- 课堂随笔04--关于string类的一些基本操作
//定义一个空字符串 string strA = string.Empty; strA = "abcdesabcskkkkk"; //获取字符串的长度 int i = strA.L ...
- 使用 LVS 实现负载均衡原理及安装配置详解(课堂随笔)
一.负载均衡LVS基本介绍 LB集群的架构和原理很简单,就是当用户的请求过来时,会直接分发到Director Server上,然后它把用户的请求根据设置好的调度算法,智能均衡地分发到后端真正服务器(r ...
- linux基础—课堂随笔09_数组
数组:(6.14 第一节) 取分区利用率,大于百分之八十则发出警报 取分区第一列 取分区使用率: 脚本: 检查脚本语法: ——end 数组切片: 1.跳过前两个取后面 2.跳过前两个取三个 生成10个 ...
随机推荐
- ubuntu16.04下g++安装及使用
1)首先在虚拟机中安装Ubuntu16.04,网络模式设置为NAT模式,安装完成后在虚拟机中测试是否能够上网. 2)进入Ubuntu,按Ctrl+alt+T,调出终端,输入sudo su,输入密码切换 ...
- Asp.Net Core WebApi 和Asp.Net WebApi上传文件
public class UpLoadController : ControllerBase { private readonly IHostingEnvironment _hostingEnviro ...
- RSA 汇总
最近工作中遇到了RSA,这个,以前只是粗略的看了一下,结果,实际使用的时候,各种眼花缭乱啊.现在整理一下RSA有哪些相关知识. 1. RSA算法本身.算法本身的内容实际上是在pkcs#1的标准里面说明 ...
- liunx驱动----构造和运行模块
以hello world模块为例 #include <linux/init.h> #include <linux/module.h> //在执行 insmod hlello 的 ...
- go 语言
go语言(或 Golang)是Google在 2007 年开发的一种开源编程语言,于2009年11月开源,2012年发布go稳定版 go是非常年轻的一门语言,它的主要目标是“兼具Python 等动态语 ...
- 微信小程序数组对象
xml:<block wx:for="{{post_key}}" wx:for-item="{{item}}"></block> dat ...
- Liunx中三种网络模式配置及Xshell连接
Liunx网络配置 NAT模式下的网络配置: 首先打开网络配置文件:vi /etc/sysconfig/network-scripts/ifcfg-ens33 修改网卡信息,配置动态Ip过程中,只 ...
- sqflite插件简单使用 key======================
https://blog.csdn.net/weixin_34183910/article/details/86029912 https://blog.csdn.net/u013255127/arti ...
- postgresql开启网络连接
默认情况下,postgresql是只允许localhost连接的,如果需要使用远程连接,需要修改两个配置文件. postgresql.conf 和 pg_hba.conf 在postgresql.co ...
- 剑指offer(66)机器人的运动范围
题目描述 地上有一个m行和n列的方格.一个机器人从坐标0,0的格子开始移动,每一次只能向左,右,上,下四个方向移动一格,但是不能进入行坐标和列坐标的数位之和大于k的格子. 例如,当k为18时,机器人能 ...