《DSP using MATLAB》示例Example4.14
代码:
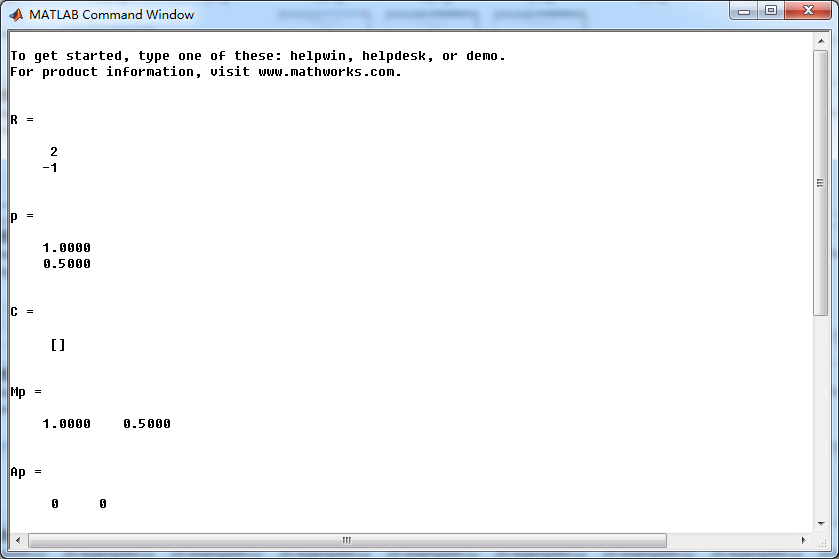
b = [1]; a = [1, -1.5, 0.5]; % [R, p, C] = residuez(b,a) Mp = (abs(p))'
Ap = (angle(p))'/pi % check
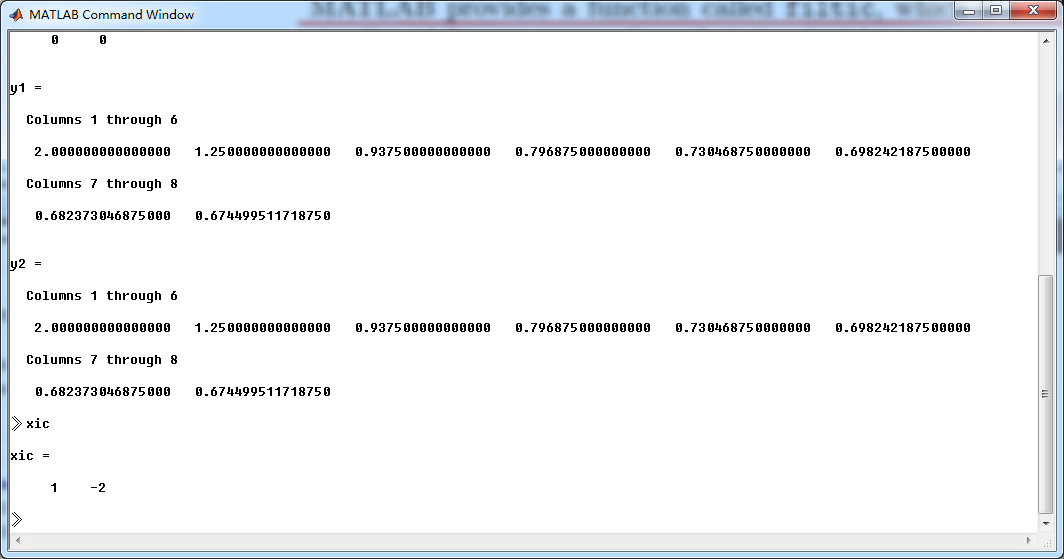
n = [0:7]; x = (1/4).^n; xic = [1, -2];
format long;
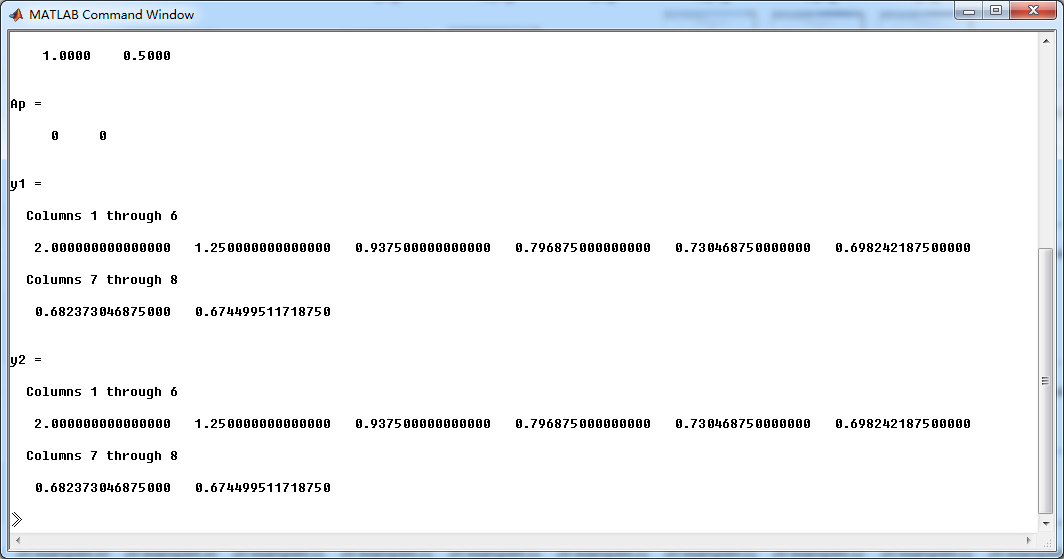
y1 = filter(b,a,x,xic)
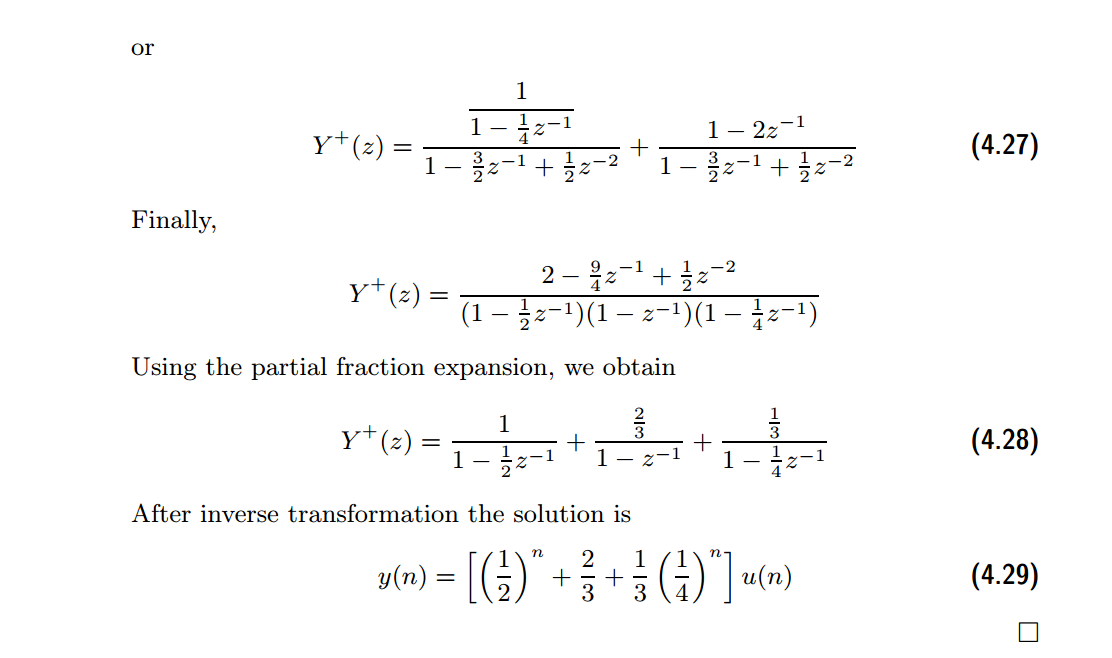
y2 = (1/3)*(1/4).^n + (1/2).^n + (2/3)*ones(1,8) Y = [4, 10]; xic = filtic(b,a,Y); %% ----------------------------------------------
%% START a determine H(z) and sketch
%% ----------------------------------------------
figure('NumberTitle', 'off', 'Name', 'Example4.14 H(z) its pole-zero plot')
set(gcf,'Color','white');
zplane(b,a);
title('pole-zero plot'); grid on; %% ----------------------------------------------
%% END
%% ---------------------------------------------- %% --------------------------------------------------------------
%% START b |H| <H
%% 1st form of freqz
%% --------------------------------------------------------------
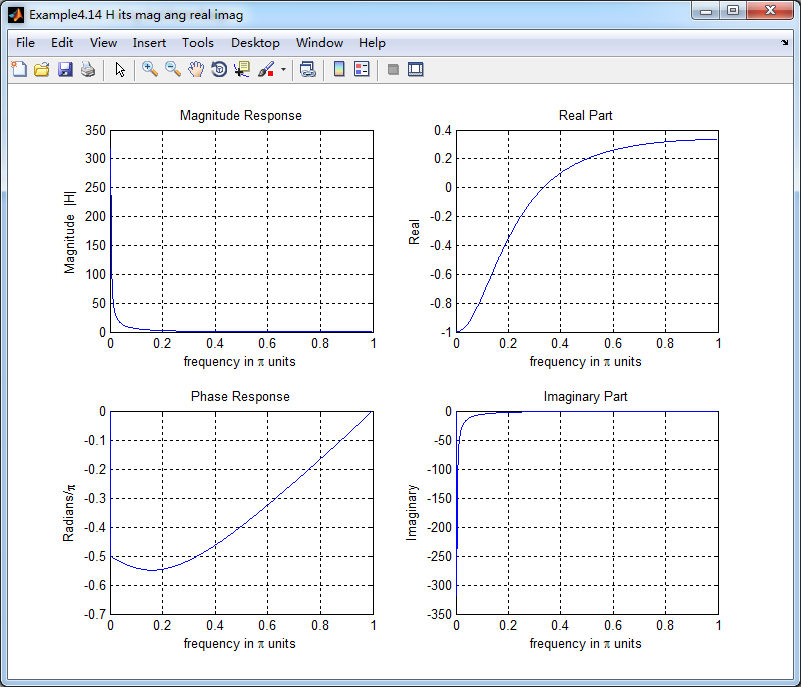
[H,w] = freqz(b,a,500); % 1st form of freqz magH = abs(H); angH = angle(H); realH = real(H); imagH = imag(H); %% ================================================
%% START H's mag ang real imag
%% ================================================
figure('NumberTitle', 'off', 'Name', 'Example4.14 H its mag ang real imag');
set(gcf,'Color','white');
subplot(2,2,1); plot(w/pi,magH); grid on; %axis([0,1,0,1.5]);
title('Magnitude Response');
xlabel('frequency in \pi units'); ylabel('Magnitude |H|');
subplot(2,2,3); plot(w/pi, angH/pi); grid on; % axis([-1,1,-1,1]);
title('Phase Response');
xlabel('frequency in \pi units'); ylabel('Radians/\pi'); subplot('2,2,2'); plot(w/pi, realH); grid on;
title('Real Part');
xlabel('frequency in \pi units'); ylabel('Real');
subplot('2,2,4'); plot(w/pi, imagH); grid on;
title('Imaginary Part');
xlabel('frequency in \pi units'); ylabel('Imaginary');
%% ==================================================
%% END H's mag ang real imag
%% ================================================== %% ---------------------------------------------------------------
%% END b |H| <H
%% --------------------------------------------------------------- %% --------------------------------------------------------------
%% START b |H| <H
%% 3rd form of freqz
%% --------------------------------------------------------------
w = [0:1:500]*pi/500; H = freqz(b,a,w);
%[H,w] = freqz(b,a,200,'whole'); % 3rd form of freqz magH = abs(H); angH = angle(H); realH = real(H); imagH = imag(H); %% ================================================
%% START H's mag ang real imag
%% ================================================
figure('NumberTitle', 'off', 'Name', 'Example4.14 using 3rd form freqz ');
set(gcf,'Color','white');
subplot(2,2,1); plot(w/pi,magH); grid on; %axis([0,1,0,1.5]);
title('Magnitude Response');
xlabel('frequency in \pi units'); ylabel('Magnitude |H|');
subplot(2,2,3); plot(w/pi, angH/pi); grid on; % axis([-1,1,-1,1]);
title('Phase Response');
xlabel('frequency in \pi units'); ylabel('Radians/\pi'); subplot('2,2,2'); plot(w/pi, realH); grid on;
title('Real Part');
xlabel('frequency in \pi units'); ylabel('Real');
subplot('2,2,4'); plot(w/pi, imagH); grid on;
title('Imaginary Part');
xlabel('frequency in \pi units'); ylabel('Imaginary');
%% ==================================================
%% END H's mag ang real imag
%% ================================================== %% ---------------------------------------------------------------
%% END b |H| <H
%% ---------------------------------------------------------------
结果:

《DSP using MATLAB》示例Example4.14的更多相关文章
- DSP using MATLAB 示例Example3.21
代码: % Discrete-time Signal x1(n) % Ts = 0.0002; n = -25:1:25; nTs = n*Ts; Fs = 1/Ts; x = exp(-1000*a ...
- DSP using MATLAB 示例 Example3.19
代码: % Analog Signal Dt = 0.00005; t = -0.005:Dt:0.005; xa = exp(-1000*abs(t)); % Discrete-time Signa ...
- DSP using MATLAB示例Example3.18
代码: % Analog Signal Dt = 0.00005; t = -0.005:Dt:0.005; xa = exp(-1000*abs(t)); % Continuous-time Fou ...
- DSP using MATLAB 示例Example3.23
代码: % Discrete-time Signal x1(n) : Ts = 0.0002 Ts = 0.0002; n = -25:1:25; nTs = n*Ts; x1 = exp(-1000 ...
- DSP using MATLAB 示例Example3.22
代码: % Discrete-time Signal x2(n) Ts = 0.001; n = -5:1:5; nTs = n*Ts; Fs = 1/Ts; x = exp(-1000*abs(nT ...
- DSP using MATLAB 示例Example3.17
- DSP using MATLAB示例Example3.16
代码: b = [0.0181, 0.0543, 0.0543, 0.0181]; % filter coefficient array b a = [1.0000, -1.7600, 1.1829, ...
- DSP using MATLAB 示例 Example3.15
上代码: subplot(1,1,1); b = 1; a = [1, -0.8]; n = [0:100]; x = cos(0.05*pi*n); y = filter(b,a,x); figur ...
- DSP using MATLAB 示例 Example3.13
上代码: w = [0:1:500]*pi/500; % freqency between 0 and +pi, [0,pi] axis divided into 501 points. H = ex ...
随机推荐
- sprinvMVC路径拦截
关于这种路径的拦截: http://localhost:8080/moodleCourse-tool/scorm/23681/mod_scorm/content/1/index_SCORM.html ...
- Eval绑定日期时,修改日期显示的格式
我们使用DataList绑定数据的时候,需要将日期的格式做一个修改,比如绑定出来的日期格式是:“2015/8/12 0:0:0”,我们需要修改为“2015-8-12”,代码如下: <%#Eval ...
- struts2文件上传和下载
1. struts系统中的拦截器介绍 过滤器:javaweb中的服务器组件,主要针对的请求和响应进行拦截. 拦截器:主要针对方法的调用,进行拦截器,当使用代理对象调用某个方法时候 对方法的调用进行拦截 ...
- python基础——模块
python基础——模块 在计算机程序的开发过程中,随着程序代码越写越多,在一个文件里代码就会越来越长,越来越不容易维护. 为了编写可维护的代码,我们把很多函数分组,分别放到不同的文件里,这样,每个文 ...
- core
http://blog.csdn.net/xiaoxiaoniaoer1/article/details/7740820 1.core文件的生成开关和大小限制--------------------- ...
- java 接口与继承
一.继承条件下的构造方法调用 运行 TestInherits.java 示例,观察输出,注意总结父类与子类之间构造方法的调用关系修改Parent构造方法的代码,显式调用GrandParent的另一个构 ...
- lsof -ntP -i:端口取出 动行程序的PID 然后xargs kill -9 这个进程
[root@ok ok]# lsof -ntP -i: [root@ok ok]# netstat -lnutp|grep tcp /dnsmasq tcp /sshd tcp ::: :::* LI ...
- Feature hashing相关 - 2
Bloom filter 思路 用多个不同hash 来记录,比如遇到一个 love 有4个hash function 映射到4个bit位置,如果所有位置都是1 那么认为之前已经遇到love这个 ...
- linux中创建gpio节点
转自:http://blog.chinaunix.net/uid-29165999-id-4296162.html #define GPIO_MAJOR 230 // major device NO. ...
- 【JAVA基本数据类型包装类】
一.概述 JAVA中一共有8种数据类型,分别是byte short int long boolean float double char,与此相对应的,有8个类与它们分别对应: byte Byte ...