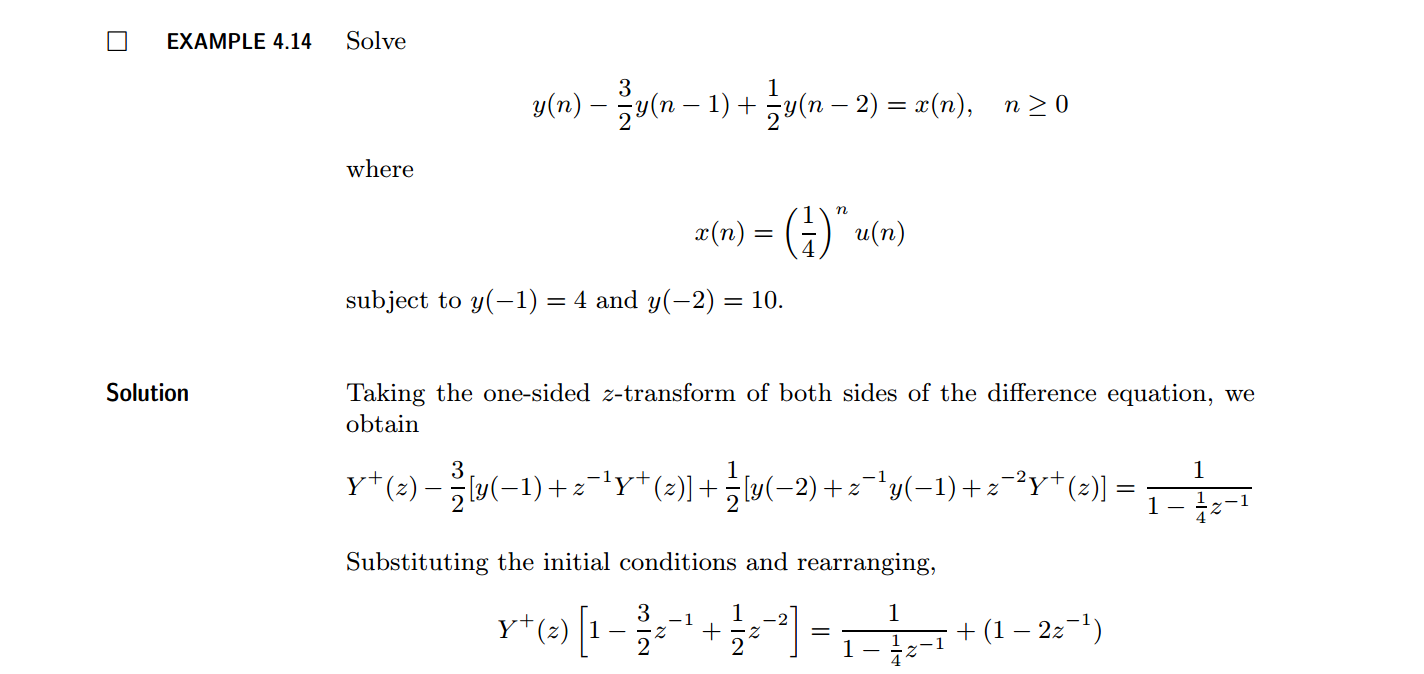
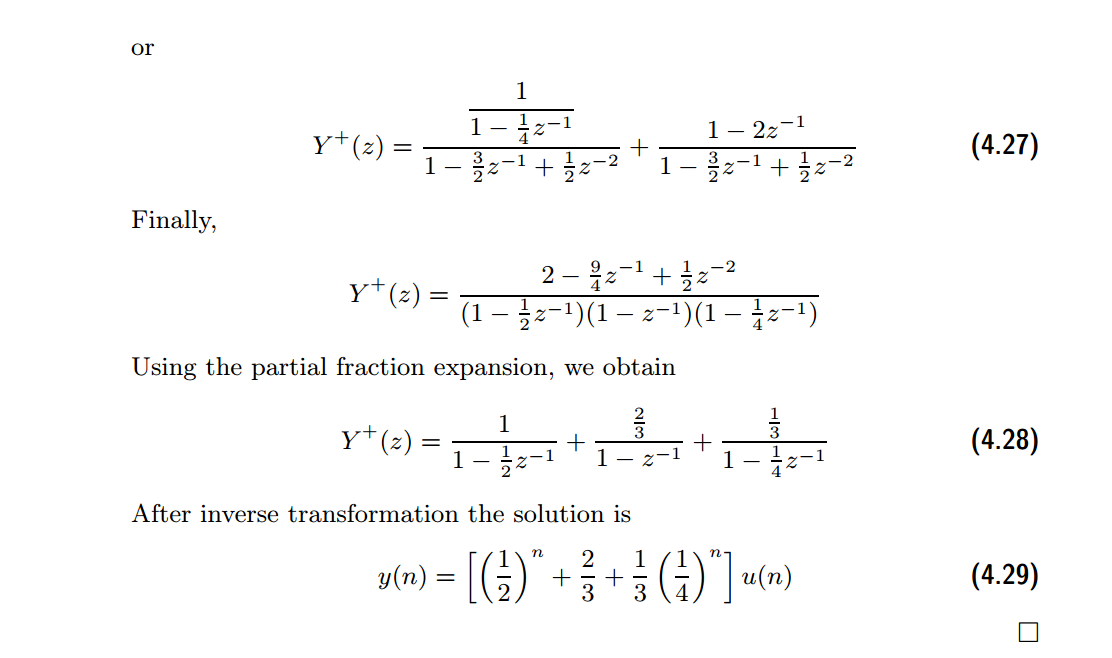
《DSP using MATLAB》示例Example4.14
代码:
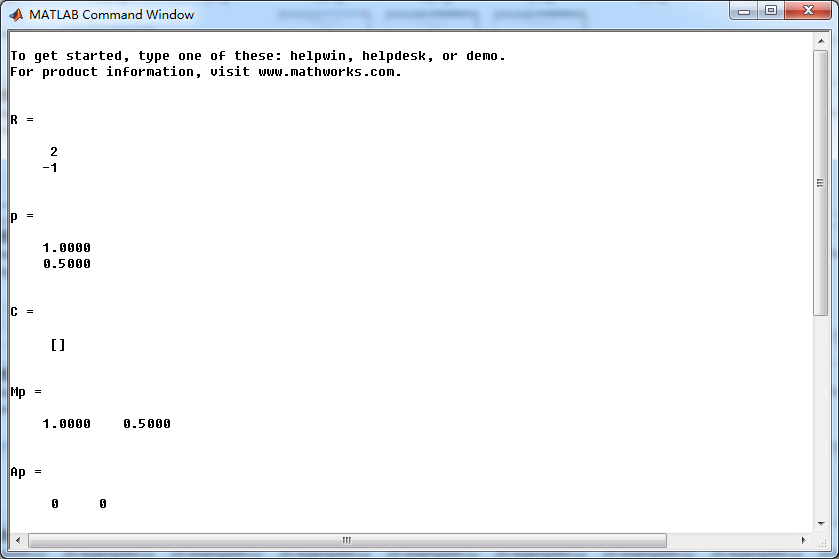
b = [1]; a = [1, -1.5, 0.5]; % [R, p, C] = residuez(b,a) Mp = (abs(p))'
Ap = (angle(p))'/pi % check
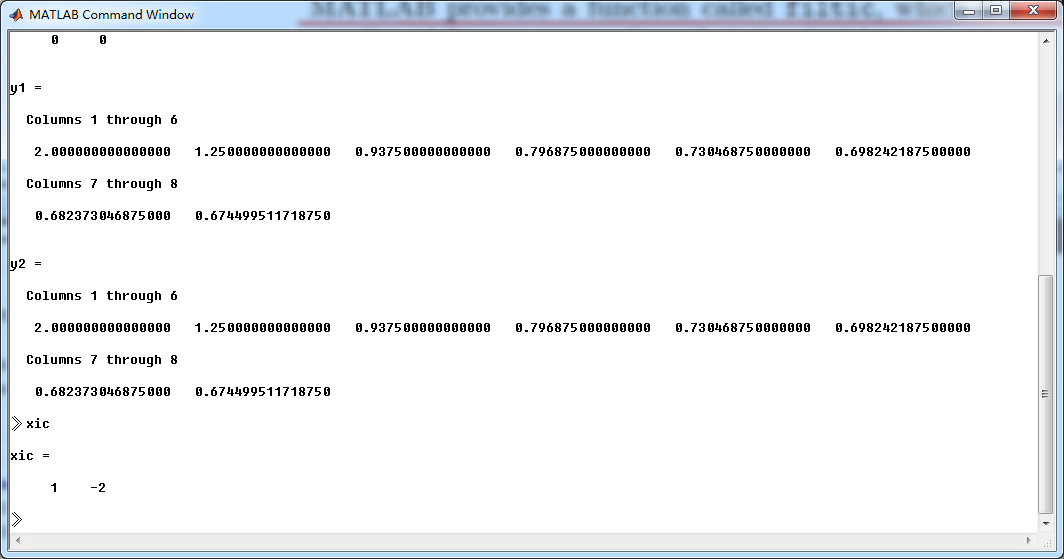
n = [0:7]; x = (1/4).^n; xic = [1, -2];
format long;
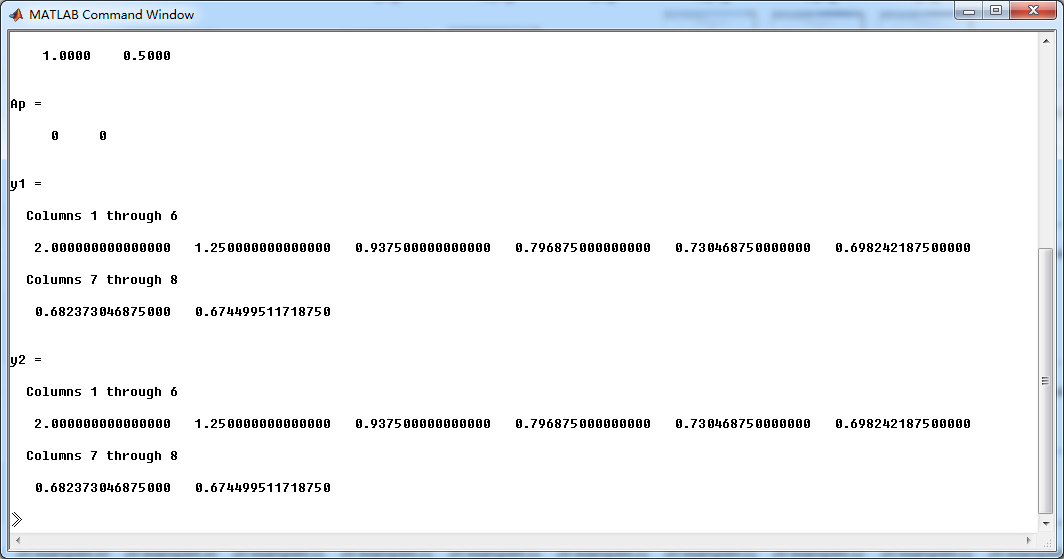
y1 = filter(b,a,x,xic)
y2 = (1/3)*(1/4).^n + (1/2).^n + (2/3)*ones(1,8) Y = [4, 10]; xic = filtic(b,a,Y); %% ----------------------------------------------
%% START a determine H(z) and sketch
%% ----------------------------------------------
figure('NumberTitle', 'off', 'Name', 'Example4.14 H(z) its pole-zero plot')
set(gcf,'Color','white');
zplane(b,a);
title('pole-zero plot'); grid on; %% ----------------------------------------------
%% END
%% ---------------------------------------------- %% --------------------------------------------------------------
%% START b |H| <H
%% 1st form of freqz
%% --------------------------------------------------------------
[H,w] = freqz(b,a,500); % 1st form of freqz magH = abs(H); angH = angle(H); realH = real(H); imagH = imag(H); %% ================================================
%% START H's mag ang real imag
%% ================================================
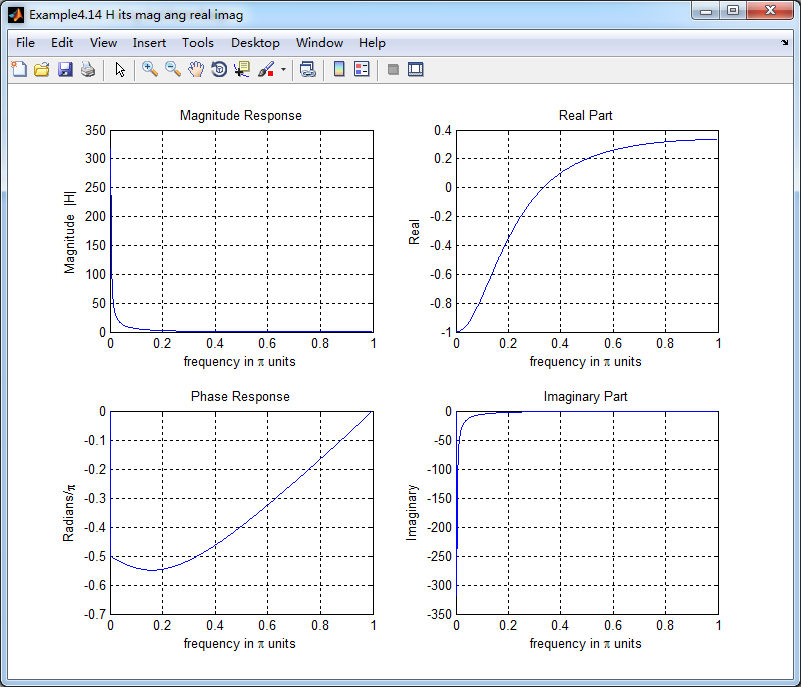
figure('NumberTitle', 'off', 'Name', 'Example4.14 H its mag ang real imag');
set(gcf,'Color','white');
subplot(2,2,1); plot(w/pi,magH); grid on; %axis([0,1,0,1.5]);
title('Magnitude Response');
xlabel('frequency in \pi units'); ylabel('Magnitude |H|');
subplot(2,2,3); plot(w/pi, angH/pi); grid on; % axis([-1,1,-1,1]);
title('Phase Response');
xlabel('frequency in \pi units'); ylabel('Radians/\pi'); subplot('2,2,2'); plot(w/pi, realH); grid on;
title('Real Part');
xlabel('frequency in \pi units'); ylabel('Real');
subplot('2,2,4'); plot(w/pi, imagH); grid on;
title('Imaginary Part');
xlabel('frequency in \pi units'); ylabel('Imaginary');
%% ==================================================
%% END H's mag ang real imag
%% ================================================== %% ---------------------------------------------------------------
%% END b |H| <H
%% --------------------------------------------------------------- %% --------------------------------------------------------------
%% START b |H| <H
%% 3rd form of freqz
%% --------------------------------------------------------------
w = [0:1:500]*pi/500; H = freqz(b,a,w);
%[H,w] = freqz(b,a,200,'whole'); % 3rd form of freqz magH = abs(H); angH = angle(H); realH = real(H); imagH = imag(H); %% ================================================
%% START H's mag ang real imag
%% ================================================
figure('NumberTitle', 'off', 'Name', 'Example4.14 using 3rd form freqz ');
set(gcf,'Color','white');
subplot(2,2,1); plot(w/pi,magH); grid on; %axis([0,1,0,1.5]);
title('Magnitude Response');
xlabel('frequency in \pi units'); ylabel('Magnitude |H|');
subplot(2,2,3); plot(w/pi, angH/pi); grid on; % axis([-1,1,-1,1]);
title('Phase Response');
xlabel('frequency in \pi units'); ylabel('Radians/\pi'); subplot('2,2,2'); plot(w/pi, realH); grid on;
title('Real Part');
xlabel('frequency in \pi units'); ylabel('Real');
subplot('2,2,4'); plot(w/pi, imagH); grid on;
title('Imaginary Part');
xlabel('frequency in \pi units'); ylabel('Imaginary');
%% ==================================================
%% END H's mag ang real imag
%% ================================================== %% ---------------------------------------------------------------
%% END b |H| <H
%% ---------------------------------------------------------------
结果:

《DSP using MATLAB》示例Example4.14的更多相关文章
- DSP using MATLAB 示例Example3.21
代码: % Discrete-time Signal x1(n) % Ts = 0.0002; n = -25:1:25; nTs = n*Ts; Fs = 1/Ts; x = exp(-1000*a ...
- DSP using MATLAB 示例 Example3.19
代码: % Analog Signal Dt = 0.00005; t = -0.005:Dt:0.005; xa = exp(-1000*abs(t)); % Discrete-time Signa ...
- DSP using MATLAB示例Example3.18
代码: % Analog Signal Dt = 0.00005; t = -0.005:Dt:0.005; xa = exp(-1000*abs(t)); % Continuous-time Fou ...
- DSP using MATLAB 示例Example3.23
代码: % Discrete-time Signal x1(n) : Ts = 0.0002 Ts = 0.0002; n = -25:1:25; nTs = n*Ts; x1 = exp(-1000 ...
- DSP using MATLAB 示例Example3.22
代码: % Discrete-time Signal x2(n) Ts = 0.001; n = -5:1:5; nTs = n*Ts; Fs = 1/Ts; x = exp(-1000*abs(nT ...
- DSP using MATLAB 示例Example3.17
- DSP using MATLAB示例Example3.16
代码: b = [0.0181, 0.0543, 0.0543, 0.0181]; % filter coefficient array b a = [1.0000, -1.7600, 1.1829, ...
- DSP using MATLAB 示例 Example3.15
上代码: subplot(1,1,1); b = 1; a = [1, -0.8]; n = [0:100]; x = cos(0.05*pi*n); y = filter(b,a,x); figur ...
- DSP using MATLAB 示例 Example3.13
上代码: w = [0:1:500]*pi/500; % freqency between 0 and +pi, [0,pi] axis divided into 501 points. H = ex ...
随机推荐
- 【C语言】二维指针做形参
转自:http://hi.baidu.com/gpmzccqceabimqq/item/f499f057aa1520404eff208b 关键: 传入时强制类型转换 + 使用时自己手工寻址 今天写程序 ...
- mysql设置密码
mysql如何设置密码 有很多方法: 1.用root 进入mysql后 mysql>set password =password('你的密码'); mysql>flush privileg ...
- objective-c可变字典
1 #pragma mark *****************************字典******************************** 2 // 字典:通过ke ...
- NodeVisitor的使用-遍历Geode节点并在它与父节点之间添加一个LOD节点
#include <osg\NodeVisitor>#include <osg\MatrixTransform>#include <osg\PagedLOD>#in ...
- mongodb3.2配置文件yaml格式 详解
mongodb3.x版本后就是要yaml语法格式的配置文件,下面是yaml配置文件格式如下:官方yaml配置文件选项参考:https://docs.mongodb.org/manual/ ... #c ...
- chaper3_exerise_Uva1568_Molar_Mass_分子量
#include<iostream> #include<iomanip> #include<string> #include<cctype> using ...
- NYOJ题目872开会
aaarticlea/png;base64,iVBORw0KGgoAAAANSUhEUgAAAsoAAAKwCAIAAAAOTc6wAAAgAElEQVR4nO3dO3LcSpOG4dkEfS6Edi
- Android -- android.os.Parcelable[] cannot be cast to ...
我本想直接把Bunde.getParcelableArray(...)得到的Parcelable[]强制转换为自定义类数组,但是失败了,网上找了两种解决办法: Parcelable[] data =b ...
- CLR via C#学习笔记----知识总概括
第1章 CLR的执行模型 托管模块的各个组成部分:PE32或PE32+头,CLR头,元数据,IL(中间语言)代码. 高级语言通常只公开了CLR的所有功能的一个子集.然而,IL汇编语言允许开发人员访问C ...
- 手机的ROM,RAM是各自存放什么?所谓“运行内存”和“机身内存”究竟有什么区别?
手机的内存分为运行内存(RAM)和非运行内存(也叫机身内存.储存空间.ROM) 1.手机的内存,分为存储内存和运行内存,相当于电脑的硬盘和内存条.2.存储内存分为机身内存和存储卡.3.rom是存储内存 ...