
使用 shinydashboard
除了 shiny 扩展包提供的函数之外,RStudio 也开发了一个 shinydashboard 扩展包
(http://rstudio.github.io/shinydashboard/),它呈现数据的方式就是专门用于概览或监测数据。
接下来的例子旨在说明创建一个简易仪表板有多简单,这个仪表板可以按每周和每月
的时间刻度显示 CRAN 上下载量最多的最受欢迎的 R 扩展包。
数据源由 cranlogs(http://cranlogs.r-pkg.org) 提供。首先运行以下代码安装所需的扩
展包:
install_ _packages(c("shinydashboard", "cranlogs"))
然后,快速查看一下 CRAN 下载数据的数据源:
library(cranlogs)
cran_ _top_ _downloads()
## No encoding supplied: defaulting to UTF-8.
## rank package count from to
## 1 1 Rcpp 9682 2016-08-18 2016-08-18
## 2 2 digest 8937 2016-08-18 2016-08-18
## 3 3 ggplot2 8269 2016-08-18 2016-08-18
## 4 4 plyr 7816 2016-08-18 2016-08-18
## 5 5 stringi 7471 2016-08-18 2016-08-18
## 6 6 stringr 7242 2016-08-18 2016-08-18
## 7 7 jsonlite 7100 2016-08-18 2016-08-18
## 8 8 magrittr 6824 2016-08-18 2016-08-18
## 9 9 scales 6397 2016-08-18 2016-08-18
## 10 10 curl 6383 2016-08-18 2016-08-18
cran_ _top_ _downloads("last-week")
## No encoding supplied: defaulting to UTF-8.
## rank package count from to
## 1 1 Rcpp 50505 2016-08-12 2016-08-18
## 2 2 digest 46086 2016-08-12 2016-08-18
## 3 3 ggplot2 39808 2016-08-12 2016-08-18
## 4 4 plyr 38593 2016-08-12 2016-08-18
## 5 5 jsonlite 36984 2016-08-12 2016-08-18
## 6 6 stringi 36271 2016-08-12 2016-08-18
## 7 7 stringr 34800 2016-08-12 2016-08-18
## 8 8 curl 33739 2016-08-12 2016-08-18
## 9 9 DBI 33595 2016-08-12 2016-08-18
## 10 10 magrittr 32880 2016-08-12 2016-08-18
熟悉了仪表板中显示的数据格式之后,就可以考虑构建仪表板了,这与构建典型
的 shiny 应用程序完全相同。为了充分利用 shinydashboard 扩展包,最好提前浏览
http://rstudio.github.io/shinydashboard/structure.html,对它提供的优质组件有一个了解。
与创建 shiny 应用程序类似,我们从用户界面开始。这次,使用 dashboardPage、
dashboardSidebar 和 dashboardBody 这 3 个函数。在仪表板中,我们想要显示扩展
包的下载动态,以及每月和每周下载量最多的最受欢迎的扩展包。
我们把月度和周度的菜单放到侧栏中,这样用户可以选择需要查看的数据。在每一个
标签页,把绘图和表格放在一起。在这个例子中,我们用 formattable 为下载列添加颜
色条,使数据更具可比性且更加直观。
library(shiny)
library(shinydashboard)
library(formattable)
library(cranlogs)
ui <- dashboardPage(
dashboardHeader(title = "CRAN Downloads"),
dashboardSidebar(sidebarMenu(
menuItem("Last week",
tabName = "last_week", icon = icon("list")),
menuItem("Last month",
tabName = "last_month", icon = icon("list"))
)),
dashboardBody(tabItems(
tabItem(tabName = "last_week",
fluidRow(tabBox(title = "Total downloads",
tabPanel("Total", formattableOutput("last_week_table"))),
tabBox(title = "Top downloads",
tabPanel("Top", formattableOutput("last_week_top_table"))))),
tabItem(tabName = "last_month",
fluidRow(tabBox(title = "Total downloads",
tabPanel("Total", plotOutput("last_month_barplot"))),
tabBox(title = "Top downloads",
tabPanel("Top", formattableOutput("last_month_top_table")))))
))
)
注意到,plotOutput( ) 是 shiny 包中的函数,而 formattableOutput( ) 函数则
是由 formattable 包提供的。事实上,开发人员可以创建各种类型的 HTML 小工具,只要扩
展包恰当地定义了 render* 函数和 *Output 函数来生成正确的 HTML 代码,我们就可
以把这些小工具嵌入 shiny 应用程序中。
接下来,我们定义服务器逻辑。因为输出结果完全依赖于数据源,在调用函数
formattable( )和 plot( )之前要先下载数据。
server <- function(input, output) {
output$last_week_table <- renderFormattable({
data <- cran_ _downloads(when = "last-week")
formattable(data, list(count = color_ _bar("lightblue")))
})
output$last_week_top_table <- renderFormattable({
data <- cran_ _top_ _downloads("last-week")
formattable(data, list(count = color_ _bar("lightblue"),
package = formatter("span",
style = "font-family: monospace;")))
})
output$last_month_barplot <- renderPlot({
data <- subset(cran_ _downloads(when = "last-month"),
count > 0)
with(data, barplot(count, names.arg = date),
main = "Last month downloads")
})
output$last_month_top_table <- renderFormattable({
data <- cran_ _top_ _downloads("last-month")
formattable(data, list(count = color_ _bar("lightblue"),
package = formatter("span",
style = "font-family: monospace;")))
})
}
事实上,如果数据持续更新,我们就可以创建一个动态的仪表板,其中的表格和图表
会定期更新。使用 reactiveTimer 和 reactive 是实现这项功能的关键。要了解更多信息,请
查阅相关帮助文档。
用户界面和服务器逻辑都准备好之后,就可以运行应用程序了:
runApp(shinyApp(ui, server))
默认情况下,shiny 应用程序会显示第一次访问时的第一页。图 15-19 是 Last week 标
签页面的屏幕截图,其中包括两个 formattable 数据框的选项卡。
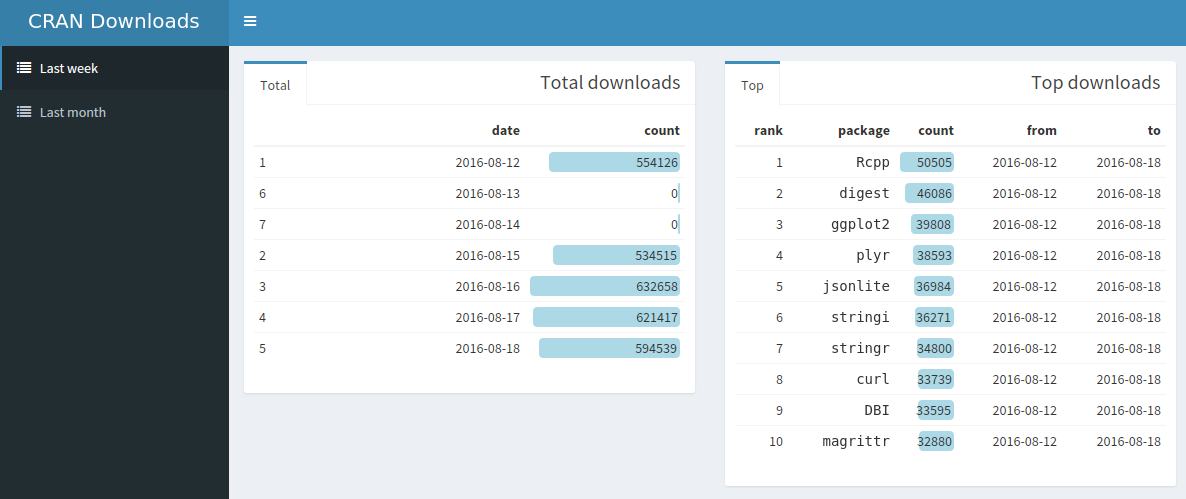
图 15-19
图 15-20 则是 Last month 标签页面的屏幕截图,其中包括一个直方图和一个 formattable
数据框。
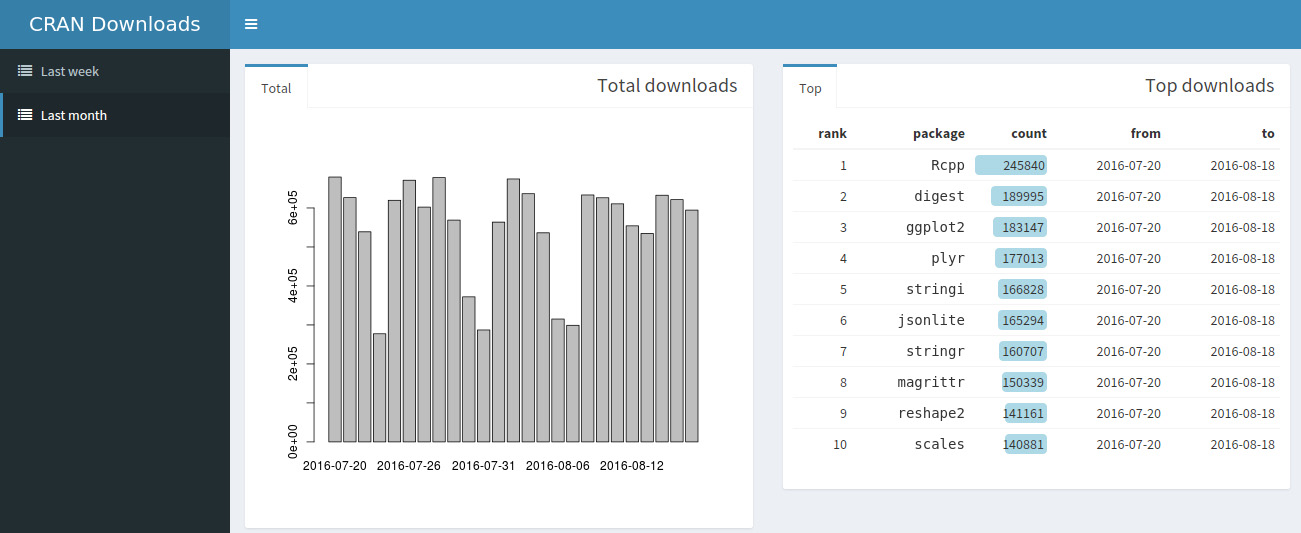
图 15-20
使用 shinydashboard的更多相关文章
- shinydashboard包---为shiny提供BI框架
1.安装 install.packages("shinydashboard") 2.基础知识 仪表盘有三个部分:标题.侧边栏,身体.下面是最最小的仪表面板页面的UI: ## ui. ...
- Building [Security] Dashboards w/R & Shiny + shinydashboard(转)
Jay & I cover dashboards in Chapter 10 of Data-Driven Security (the book) but have barely mentio ...
- R shinydashboard——3.外观
目录 1.皮肤 2.注销面板 3.CSS 4. 标题延长 5.侧边栏宽度 6.图标 7.状态和颜色 1.皮肤 shinydashboard有很多颜色主题和外观的设置.默认为蓝色,可指定黑丝.紫色.绿色 ...
- R shinydashboard ——2. 结构
目录 1.Shiny和HTML 2.结构 3. 标题Header 4. 侧边栏Siderbar 5.主体/正文Body box tabBox infoBox valueBox Layouts 1.Sh ...
- R shinydashboard ——1. 基本用法
shiny和shinydashboard使用虽然简单,但控件众多,需及时总结归纳. install.packages("shinydashboard") shinydashboar ...
- R语言包翻译——翻译
Shiny-cheatsheet ...
- R语言包翻译
Shiny-cheatsheet 作者:周彦通 1.安装 install.packages("shinydashboard") 2.基础知识 仪表盘有三个部分:标题.侧边栏,身体 ...
- R 包
[下面列出每个步骤最有用的一些R包] .数据导入 以下R包主要用于数据导入和保存数据: feather:一种快速,轻量级的文件格式:在R和python上都可使用 readr:实现表格数据的快速导入 r ...
- R语言中常用包(二)
数据导入 以下R包主要用于数据导入和保存数据 feather:一种快速,轻量级的文件格式.在R和python上都可使用readr:实现表格数据的快速导入.中文介绍可参考这里readxl:读取Micro ...
随机推荐
- HTML标签img--改变图片尺寸
转自:https://blog.csdn.net/u012377333/article/details/50508484 1.统一大小? 我的网页上面有许多的图片,有的大,有的小,我想如果图片大的实现 ...
- idea的svn插件中compare with the same repository version和compare with latest repository version的区别?
Idea的svn插件中compare with the same repository version和compare with latest repository version的区别? 1.com ...
- Java的Object.hashCode()的返回值到底是不是对象内存地址?
关于这个问题,查阅了网上的资料,发现证明过程太繁琐,这里我用了反证法. java.lang.Object.hashCode()的返回值到底是不是对象内存地址? hashCode契约 说到这个问题,大家 ...
- [NGINX] - 配置文件优化 - NGINX.CONF
Nginx 本文主要针对公司的Nginx负载均衡配置进行解释,配置文件在最下方.因为公司没有使用PHP,所以NGINX里面并没有太多facgi模块相关优化 NGINX.CONF user 语 ...
- Oracle安装部署之 6节点11g cluster环境搭建
**********************集群规划*************************************** --配置主机,共需要8台主机,其中6台做grid集群,1台作为存储服 ...
- CVP沙龙
关于职场: 35岁之后,还去招聘网站投简历? 35岁可能是个分水岭 95后比一些80后还强, 有些80后玻璃心 35岁有的可能已经是VP了 应该深入积累而不是蜻蜓点水 只有第一年成长了,之后是重复劳动 ...
- AOP切点表达式
Aspectj切入点语法定义 在使用spring框架配置AOP的时候,不管是通过XML配置文件还是注解的方式都需要定义pointcut"切入点" 例如定义切入点表达式 execu ...
- (2.11)Mysql之SQL基础——存储过程与变量
(2.11)Mysql之SQL基础——存储过程 关键字:mysql存储过程 查看存储过程: []SELECT * FROM information_schema.ROUTINES WHERE ROUT ...
- mysql 表的增删改查 修改表结构
四.修改表结构 语法: . 修改表名 ALTER TABLE 表名 RENAME 新表名; . 增加字段 ALTER TABLE 表名 ADD 字段名 数据类型 [完整性约束条件…], ADD 字段名 ...
- 003-and design-dva.js 知识导图-02-Reducer,Effect,Subscription,Router,dva配置,工具
一.Reducer reducer 是一个函数,接受 state 和 action,返回老的或新的 state .即:(state, action) => state 增删改 以 todos 为 ...