.NetCore下使用Prometheus实现系统监控和警报 (五)进阶自定义收集指标 之 Counter
Prometheus下面定了四种类型的收集方式,下面我们主要来来说下Counter的使用
Nuget导入Prometheus.AspNetCore包
下面先来看下我的Prometheus配置,这里我没有分组了

这里我有三个服务,分别是认证服务40000 用户服务 40001 以及体检服务 40002
配置好了重新用配置启动,已启动kill掉在启动
这里我们访问 http://192.168.0.212:9090/targets,可以看到配置的服务状态都是Up,其实Prometheus中自带了服务发现

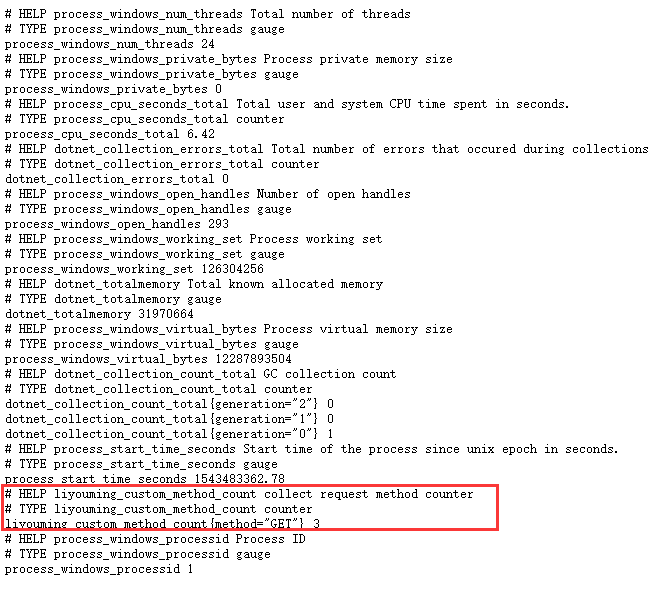
Prometheus中默认了很多的信息收集指标,这里我们首先来看我们客户端中都有什么,这个也是说明文档,包括了 说明 Help 类型:Type 以及具体的指标,接下来我以 dotnet_collection_errors_total 来作为例子说明,这里dotnet开始的是这个中间件默认收集的以及window进程、线程相关收集信息
# HELP dotnet_collection_errors_total Total number of errors that occured during collections

# TYPE dotnet_collection_errors_total counter

dotnet_collection_errors_total

# HELP dotnet_collection_count_total GC collection count

# TYPE dotnet_collection_count_total counter

dotnet_collection_count_total{generation=""}

dotnet_collection_count_total{generation=""}

dotnet_collection_count_total{generation=""}

# HELP dotnet_totalmemory Total known allocated memory

# TYPE dotnet_totalmemory gauge

dotnet_totalmemory

# HELP process_windows_working_set Process working set

# TYPE process_windows_working_set gauge

process_windows_working_set

# HELP process_windows_processid Process ID

# TYPE process_windows_processid gauge

process_windows_processid

# HELP process_windows_num_threads Total number of threads

# TYPE process_windows_num_threads gauge

process_windows_num_threads

# HELP process_cpu_seconds_total Total user and system CPU time spent in seconds.

# TYPE process_cpu_seconds_total counter

process_cpu_seconds_total 647.22

# HELP process_windows_private_bytes Process private memory size

# TYPE process_windows_private_bytes gauge

process_windows_private_bytes

# HELP process_start_time_seconds Start time of the process since unix epoch in seconds.

# TYPE process_start_time_seconds gauge

process_start_time_seconds 1543398602.14

# HELP process_windows_open_handles Number of open handles

# TYPE process_windows_open_handles gauge

process_windows_open_handles

# HELP process_windows_virtual_bytes Process virtual memory size

# TYPE process_windows_virtual_bytes gauge

process_windows_virtual_bytes
# HELP dotnet_collection_errors_total Total number of errors that occured during collections

# TYPE dotnet_collection_errors_total counter

dotnet_collection_errors_total
Help:主要是收集发生错误的数量 说明简介
Type:这里类型就是计数器类型 Counter
指标的名称:dotnet_collection_errors_total 0 这个 0就是计数器 在遇到错误的时候会累加,接下来举一个简单的例子,我们来收集 Get请求的数量 或者 Post请求的数量,这里我们需要在服务中添加一个Counter配置的中间件
具体代码如下: 在Configure中添加
var counter = Metrics.CreateCounter("liyouming_custom_method_count", "collect request method counter", new CounterConfiguration

            {

                LabelNames = new[] { "method" }

            });

app.Use((context, next) =>

            {

                counter.WithLabels(context.Request.Method).Inc();
                   return next();

            });

app.UseMetricServer();
这里我定义了一个Counter的收集器,收集请求信息计数,筛选是method类型, liyouming_custom_method_count 就是制定指标名称,第二个参数是说明,LabelNames是收集信息标签名称,这里需要注意的是 LableNames中的标签名称个数与收集的信息个数需要对应
先来运行项目并访问metrics 可以看到下面的信息,可以看到图中红色部分,我们自定义的信息就添加好了
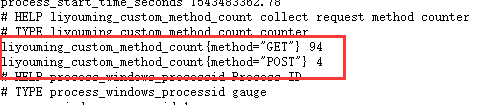
接下来我们多刷新N次这个页面,我们来看下计数

下面我们在来一次post请求一个接口,可以看到Lable分析指标的类型分类计数,说道这里应该明白label是用来干什么的了吧,其实就是分析指标(就是统计分析中统计类型)
下一篇中会结合Grafana的具体使用来使用Prometheus
.NetCore下使用Prometheus实现系统监控和警报 (五)进阶自定义收集指标 之 Counter的更多相关文章
- .NetCore下使用Prometheus实现系统监控和警报 (一)介绍【译】
[译]原文https://prometheus.io/docs/introduction/overview 什么是Prometheus? Prometheus是一个开源系统监控和警报工具包,最初起源于 ...
- .NetCore下使用Prometheus实现系统监控和警报 (六)进阶Grafana集成自定义收集指标
Prometheus中包含了很多收集指标,那么我们怎来在Grafana中来使用呢? 接下来我们还是以之前自定义的来演示如图:我们在Prometheus中已经可以看到这个之前我们自定义的类型了 关于Gr ...
- .NetCore下使用Prometheus实现系统监控和警报 (二)Linux安装
Prometheus对Windows有相关的支持 下载地址:https://prometheus.io/download/ wget https://github.com/prometheus/pr ...
- .NetCore下使用Prometheus实现系统监控和警报 (四)客户端代码处理
在代码中使用就比较简单了 Nuget包获取下 prometheus-net prometheus-net.AspNetCore 然后添加中间件就行了 app.UseMetricServer(); 默认 ...
- .NetCore下使用Prometheus实现系统监控和警报 (三)集成Grafana
有了前面InfluxDB的经验,这里就很好处理了,数据类型选择Prometheus选地址等,填好保存 同样通过导入数据处理,我们在https://grafana.com/dashboards上选择Da ...
- go-zero docker-compose 搭建课件服务(七):prometheus+grafana服务监控
0.转载 go-zero docker-compose 搭建课件服务(七):prometheus+grafana服务监控 0.1源码地址 https://github.com/liuyuede123/ ...
- Kubernetes1.16下部署Prometheus+node-exporter+Grafana+AlertManager 监控系统
Prometheus 持久化安装 我们prometheus采用nfs挂载方式来存储数据,同时使用configMap管理配置文件.并且我们将所有的prometheus存储在kube-system #建议 ...
- Prometheus 系统监控方案 一
最近一直在折腾时序类型的数据库,经过一段时间项目应用,觉得十分不错.而Prometheus又是刚刚推出不久的开源方案,中文资料较少,所以打算写一系列应用的实践过程分享一下. Prometheus 是什 ...
- Prometheus 系统监控方案 二 安装与配置
下载Prometheus 下载最新安装包,本文说的都是在Linux x64下面内容,其它平台没尝试过,请选择合适的下载. Prometheus 主程序,主要是负责存储.抓取.聚合.查询方面. Aler ...
随机推荐
- $使用dom4j可解析 返回&#x等字样的 html转义字符【转】
如果以GET或POST请求某个系统返回,带有 $#x 那很有可能是axis服务器返回的. <?xml version="1.0" encoding="UTF-8&q ...
- POJ - 2828 Buy Tickets(线段树单点更新)
http://poj.org/problem?id=2828 题意 排队买票,依次给出当前人要插队的位置,每个人有个编号,然后问你最后整个的序列是什么? 分析 最后一个人的要插入的位置是确定的,所以逆 ...
- 转--python 基础
核心库 1.NumPy 当我们用python来处理科学计算任务时,不可避免的要用到来自SciPy Stack的帮助.SciPy Stack是一个专为python中科学计算而设计的软件包,注意不要将它 ...
- Linux - find 查找
# linux文件无创建时间 # Access 使用时间 # Modify 内容修改时间 # Change 状态改变时间(权限.属主) # 时间默认以24小时为单位,当前时间到向前24小时为0天,向前 ...
- mysql案例-sysbench安装测试
一 地址 githup地址https://github.com/akopytov/sysbench二 版本 sysbench 1.0.15 curl -s https://packagecloud.i ...
- winform程序生成条形码并且并且保存到本地文件中。
今天公司让做一个输入数字.字母生成条形码并且可以以图片格式保存到本地.当看到这个需求时候感觉很搞笑,明明可以用文本框搞定的东西非得做个程序.哎,寄人篱下,不多说了,这就是养兵千日用兵一时. 我在网上找 ...
- D3开发中的资料整理
D3开发台阶比较高,需要对html,css,js非常熟练,还要对SVG非常熟悉,SVG不会就不要开发D3了,下面给大家推荐一本资料,为大家未来的开发提供便利. 这个框架产品不支持ie8,是这个产品的特 ...
- [ VB ] If 运算符 [ C# ] 条件运算符 (?:)
//保留了原文 ()为大概的意思 VB で使用していた IIf 関数の代わりに VB2008 からは If 演算子 を使用可能となった. また. C# では.条件演算子 (?:) で同等の記述が可 ...
- eclipse设置代码模板和格式
该设置可以在保存文件时自动根据模板调整代码格式. 首先准备华为代码格式化文件: FEFO-Formatter.xml FEFO-codetemplates.xml 设置格式Preferences-Ja ...
- jenkins findbugs流编码问题:DM_DEFAULT_ENCODING
报错信息: MessageParserUtil.java:122, DM_DEFAULT_ENCODING, Priority: High Dm: Found reliance on default ...