.NetCore下使用Prometheus实现系统监控和警报 (五)进阶自定义收集指标 之 Counter
Prometheus下面定了四种类型的收集方式,下面我们主要来来说下Counter的使用
Nuget导入Prometheus.AspNetCore包
下面先来看下我的Prometheus配置,这里我没有分组了

这里我有三个服务,分别是认证服务40000 用户服务 40001 以及体检服务 40002
配置好了重新用配置启动,已启动kill掉在启动
这里我们访问 http://192.168.0.212:9090/targets,可以看到配置的服务状态都是Up,其实Prometheus中自带了服务发现

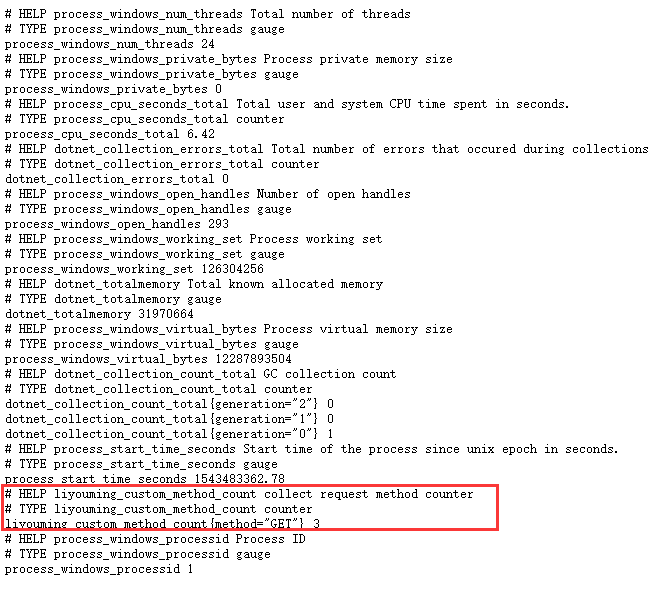
Prometheus中默认了很多的信息收集指标,这里我们首先来看我们客户端中都有什么,这个也是说明文档,包括了 说明 Help 类型:Type 以及具体的指标,接下来我以 dotnet_collection_errors_total 来作为例子说明,这里dotnet开始的是这个中间件默认收集的以及window进程、线程相关收集信息
# HELP dotnet_collection_errors_total Total number of errors that occured during collections

# TYPE dotnet_collection_errors_total counter

dotnet_collection_errors_total

# HELP dotnet_collection_count_total GC collection count

# TYPE dotnet_collection_count_total counter

dotnet_collection_count_total{generation=""}

dotnet_collection_count_total{generation=""}

dotnet_collection_count_total{generation=""}

# HELP dotnet_totalmemory Total known allocated memory

# TYPE dotnet_totalmemory gauge

dotnet_totalmemory

# HELP process_windows_working_set Process working set

# TYPE process_windows_working_set gauge

process_windows_working_set

# HELP process_windows_processid Process ID

# TYPE process_windows_processid gauge

process_windows_processid

# HELP process_windows_num_threads Total number of threads

# TYPE process_windows_num_threads gauge

process_windows_num_threads

# HELP process_cpu_seconds_total Total user and system CPU time spent in seconds.

# TYPE process_cpu_seconds_total counter

process_cpu_seconds_total 647.22

# HELP process_windows_private_bytes Process private memory size

# TYPE process_windows_private_bytes gauge

process_windows_private_bytes

# HELP process_start_time_seconds Start time of the process since unix epoch in seconds.

# TYPE process_start_time_seconds gauge

process_start_time_seconds 1543398602.14

# HELP process_windows_open_handles Number of open handles

# TYPE process_windows_open_handles gauge

process_windows_open_handles

# HELP process_windows_virtual_bytes Process virtual memory size

# TYPE process_windows_virtual_bytes gauge

process_windows_virtual_bytes
# HELP dotnet_collection_errors_total Total number of errors that occured during collections

# TYPE dotnet_collection_errors_total counter

dotnet_collection_errors_total
Help:主要是收集发生错误的数量 说明简介
Type:这里类型就是计数器类型 Counter
指标的名称:dotnet_collection_errors_total 0 这个 0就是计数器 在遇到错误的时候会累加,接下来举一个简单的例子,我们来收集 Get请求的数量 或者 Post请求的数量,这里我们需要在服务中添加一个Counter配置的中间件
具体代码如下: 在Configure中添加
var counter = Metrics.CreateCounter("liyouming_custom_method_count", "collect request method counter", new CounterConfiguration

            {

                LabelNames = new[] { "method" }

            });

app.Use((context, next) =>

            {

                counter.WithLabels(context.Request.Method).Inc();
                   return next();

            });

app.UseMetricServer();
这里我定义了一个Counter的收集器,收集请求信息计数,筛选是method类型, liyouming_custom_method_count 就是制定指标名称,第二个参数是说明,LabelNames是收集信息标签名称,这里需要注意的是 LableNames中的标签名称个数与收集的信息个数需要对应
先来运行项目并访问metrics 可以看到下面的信息,可以看到图中红色部分,我们自定义的信息就添加好了
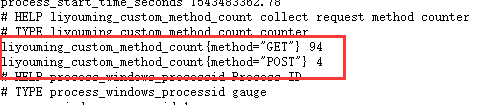
接下来我们多刷新N次这个页面,我们来看下计数

下面我们在来一次post请求一个接口,可以看到Lable分析指标的类型分类计数,说道这里应该明白label是用来干什么的了吧,其实就是分析指标(就是统计分析中统计类型)
下一篇中会结合Grafana的具体使用来使用Prometheus
.NetCore下使用Prometheus实现系统监控和警报 (五)进阶自定义收集指标 之 Counter的更多相关文章
- .NetCore下使用Prometheus实现系统监控和警报 (一)介绍【译】
[译]原文https://prometheus.io/docs/introduction/overview 什么是Prometheus? Prometheus是一个开源系统监控和警报工具包,最初起源于 ...
- .NetCore下使用Prometheus实现系统监控和警报 (六)进阶Grafana集成自定义收集指标
Prometheus中包含了很多收集指标,那么我们怎来在Grafana中来使用呢? 接下来我们还是以之前自定义的来演示如图:我们在Prometheus中已经可以看到这个之前我们自定义的类型了 关于Gr ...
- .NetCore下使用Prometheus实现系统监控和警报 (二)Linux安装
Prometheus对Windows有相关的支持 下载地址:https://prometheus.io/download/ wget https://github.com/prometheus/pr ...
- .NetCore下使用Prometheus实现系统监控和警报 (四)客户端代码处理
在代码中使用就比较简单了 Nuget包获取下 prometheus-net prometheus-net.AspNetCore 然后添加中间件就行了 app.UseMetricServer(); 默认 ...
- .NetCore下使用Prometheus实现系统监控和警报 (三)集成Grafana
有了前面InfluxDB的经验,这里就很好处理了,数据类型选择Prometheus选地址等,填好保存 同样通过导入数据处理,我们在https://grafana.com/dashboards上选择Da ...
- go-zero docker-compose 搭建课件服务(七):prometheus+grafana服务监控
0.转载 go-zero docker-compose 搭建课件服务(七):prometheus+grafana服务监控 0.1源码地址 https://github.com/liuyuede123/ ...
- Kubernetes1.16下部署Prometheus+node-exporter+Grafana+AlertManager 监控系统
Prometheus 持久化安装 我们prometheus采用nfs挂载方式来存储数据,同时使用configMap管理配置文件.并且我们将所有的prometheus存储在kube-system #建议 ...
- Prometheus 系统监控方案 一
最近一直在折腾时序类型的数据库,经过一段时间项目应用,觉得十分不错.而Prometheus又是刚刚推出不久的开源方案,中文资料较少,所以打算写一系列应用的实践过程分享一下. Prometheus 是什 ...
- Prometheus 系统监控方案 二 安装与配置
下载Prometheus 下载最新安装包,本文说的都是在Linux x64下面内容,其它平台没尝试过,请选择合适的下载. Prometheus 主程序,主要是负责存储.抓取.聚合.查询方面. Aler ...
随机推荐
- java元注解 @Documented注解使用
@Documented 注解表明这个注解应该被 javadoc工具记录. 默认情况下,javadoc是不包括注解的. 但如果声明注解时指定了 @Documented,则它会被 javadoc 之类的工 ...
- linux的基本操作与常见命令
linux的基本操作与常见命令: jdk的安装: 步骤:(特别注意:虚拟机安装的一般是32位的操作系统,jdk也必须使用32位的) 查看虚拟机版本:sudo uname --m i686 //表示是3 ...
- 动态生成js数据Response.Expires=1440竟然无效?
项目当中有一些数据,比如多语言翻译,要求做语言包,起初当然是做成i18n.js文件,但是每个阶段版本更新都会增加一些key,那么发布的时候只能给<script>的src增加?2018091 ...
- 常用的Date对象和Math对象方法
Date对象方法: 当前用户本地时间 let time = new Date(); 获取整数年 console.log(time.getFullYear()); 获取当前月(月份要加1) consol ...
- A+B (带有,的数字)
题目描述 给定两个整数A和B,其表示形式是:从个位开始,每三位数用逗号","隔开. 现在请计算A+B的结果,并以正常形式输出. 输入描述: 输入包含多组数据数据,每组数据占一行,由 ...
- __weak 修饰符
在 HAL 库中,很多回调函数前面使用__weak 修饰符,这里我们有必要给大家讲解__weak 修饰符的作用. weak 顾名思义是“弱”的意思,所以如果函数名称前面加上__weak 修饰符,我们一 ...
- 离线安装IDEA插件
1.idea插件官网http://plugins.jetbrains.com/idea 搜索并下载对应的插件的zip包 2.打开软件进行离线安装 IDEA-->Setting-->Plug ...
- 【通信】Jave代码中生成url http请求
/** * 向指定 URL 发送POST方法的请求 * * @param url * 发送请求的 URL * @param param * 请求参数,请求参数应该是 name1=value1& ...
- 腾讯云YUM安装失效
修改路由后,YUM安装失效,提示不能解析YUM源 yum clear chche yum makecache
- 01 响应式页面-@media介绍,
我们为什么要写自适应的页面(响应式页面) 众所周知,电脑.平板.手机的屏幕是差距很大的,假如在电脑上写好了一个页面,在电脑上看起来不错,但是如果放到手机上的话,那可能就会乱的一塌糊涂,这时候怎么解决呢 ...