
pipe 导致的 CLOSE_WAIT :: Utop's Blog
历时一周总算把导致服务大量 CLOSE_WAIT 的原因给找到了。打印任务调用栈果然的必备手段啊!
问题描述
Python 服务 A,用于接收心跳包确认其他服务是否存活。其他服务每 5 分钟向 A 发送一次心跳包;总计 < 100 个其他服务。
- 05-11 19:30 ,首次出现 Python 服务大量
CLOSE_WAIT,至 13 日发现,总计 10k 左右CLOSE_WAIT的 TCP 连接。05-13 15:30 通过运维平台重新部署… - 05-14 16:30 ,再次出现。19:30 手动重启。
- 其间给 Python 服务 A 添加了打印调用栈的模块 pdbx,通过运维平台重新部署
- 05-17 19:00 ,再次出现。等待打印调用栈,不小心杀掉了服务…
- 05-19 14:30 ,重现。
- 05-20 08:30 ,查找原因,解决问题。
由于不是本人负责的服务,于 16 日凭兴趣开始有限介入,协助排查。现将排查流程一一记述,给自己和大家未来排查问题提供一个借鉴。
问题探究
CLOSE_WAIT 现象梳理
16 日拿到的信息只有前两次问题记录。
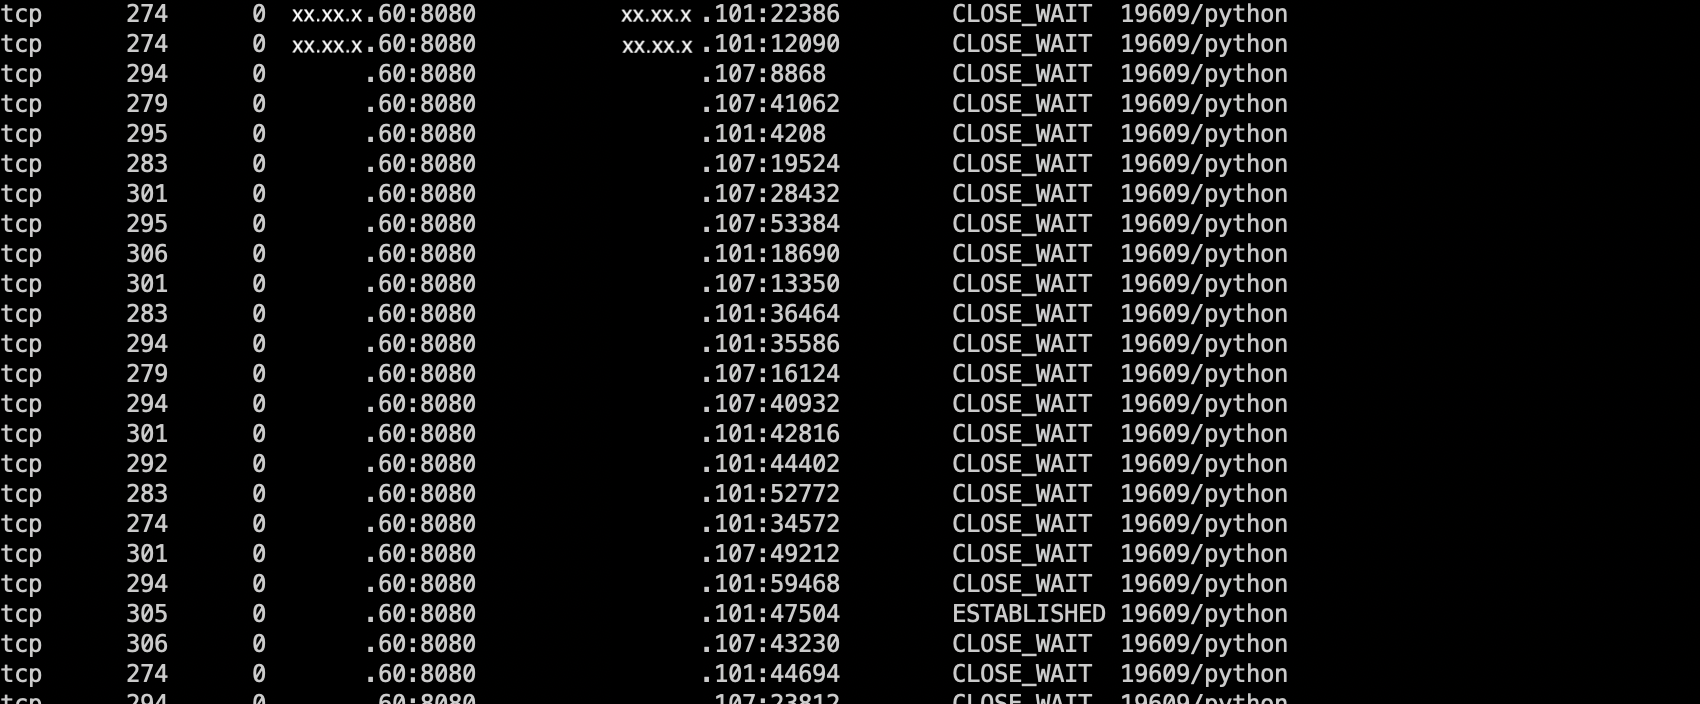
大量 CLOSE_WAIT 状态的 TCP 连接,Recv-Q 数据大小平均在 300 Bytes 左右。对比实际的 HTTP 包大小,恰好是一次 HTTP Request 请求大小。同时参考 Nginx 打印的日志,确定是一次 HTTP 请求的数据包大小,同时都以 Timeout 为结束。
OK,简单地建立起了第一个印象,TCP 断开连接的 FIN 包由 Nginx 请求超时后发起(proxy_read_timeout 300s) 。A 服务所在的 Linux 机器接收到 FIN 包,并由内核线程直接将套接字状态置位为 CLOSE_WAIT 。
A 服务没意识到 FIN 包?当然,接收了 FIN 包之后,再回应 ACK 包,这“四次挥手”的第二个数据包并不会被 A 服务所认知,而是由内核的 [ksoftirqd] 内核线程直接处理。看下内核处理 FIN 包的代码 (from net/ipv4/tcp_input.c)。
/*

 * 处理 FIN 包

 *

 * 如果当前套接字是 ESTABLISHED 状态,则接收 FIN 包,进入 CLOSE-WAIT

 * 状态

 * ...

 */

void tcp_fin(struct sock *sk)

{

	struct tcp_sock *tp = tcp_sk(sk);

	inet_csk_schedule_ack(sk);

	sk->sk_shutdown |= RCV_SHUTDOWN;

	sock_set_flag(sk, SOCK_DONE);

	switch (sk->sk_state) {

	case TCP_SYN_RECV:

	case TCP_ESTABLISHED:

        /* 当前为 ESTABLISHED 状态,进入 CLOSE_WAIT */

		tcp_set_state(sk, TCP_CLOSE_WAIT);

		inet_csk(sk)->icsk_ack.pingpong = 1;

		break;

    // ... more omitted

    }

    // ... more omitted

}
更多关于网络相关的内核实现请参考 理解 Linux Kernel (8) - 网络
再结合 Recv-Q 恰好等于一次完整 HTTP 请求的条件,可以认识到 Python 线程根本没有 recv 请求数据。更别提意识到远端发出来 FIN 包。
到此为止,由前两次的问题得到的线索,只能认为 Python 服务 A 的所有工作线程都在哪段代码阻塞了。而我所能认知的唯一条件就是事务死锁(当然,我犯了比较大的错误)。事实上看代码根本就没有任何死锁代码。暂时无果。
打印线程调用栈 (一次失败的尝试)
集成了调用栈打印工具 pdbx (强烈安利,我们老大写的,很好用的工具)之后,按理说 18 日解决问题是非常容易的。
结果按照文档的描述,使用 kill -30 <PID> ,Python 服务进程莫名挂掉。功亏一篑啊。后来查看源码发现 pdbx 重定义了 USR1 信号的处理函数。T_T Linux x86 平台下,对应的信号值为 10.
额外地穿插一点信号相关的内容。signal 是一种异步处理机制,一般由执行流在退出内核态回到用户态之前 Check 当前任务的信号队列(为什么会主动 check 呢?当然是内核代码提前写好的流程),并主动针对获得的信号调用对应的信号处理函数。
可怕的是,之前竟然一直没有意识到信号值在不同的 CPU 架构下是不同的。USR1 在 x86 平台下是 10,在 平台下是 30 。而 BSD 又与 Linux 的编号方案不同。
Linux supports the standard signals listed below. Several signal numbers are architecture-dependent, as indicated in the “Value” column. (Where three values are given, the first one is usually valid for alpha and sparc, the middle one for x86, arm, and most other architectures, and the last one for mips. (Values for parisc are not shown; see the Linux kernel source for signal numbering on that architecture.) A dash (-) denotes that a signal is absent on the corresponding architecture.
Linux 支持的标准信号如下。一些信号值是平台相关的(Value 列,第一个值用于 alpha 和 sparc 平台,中间的值用于 x86、arm 和大量其他架构,最后一个值用于 mips 平台)> Signal Value Action Comment
> ----------------------------------------------------------------------
> SIGHUP 1 Term Hangup detected on controlling terminal or death of controlling process
> SIGINT 2 Term Interrupt from keyboard
> SIGQUIT 3 Core Quit from keyboard
> SIGKILL 9 Term Kill signal
> SIGUSR1 30,10,16 Term User-defined signal 1
> SIGUSR2 31,12,17 Term User-defined signal 2
> ``` 总结下,最靠谱的写法就是直接用信号的字符描述啦。`kill -s USR1 <PID>` --- ### 打印线程调用栈 19 日下午再次重现,等到 20 日周一上班,总是成功地拿到了线程的调用栈。“CP Server Thread-10” tid=139694658537216
at self.__bootstrap_inner()(threading.py:785)
at self.run()(threading.py:812)
at conn.communicate()(wsgiserver2.py:1532)
… more omitted
at instances = list(db.select(‘instance’, vars, where=‘app_name=$app_name and host=$host and port=$port’))(xxx.py:233)
at return self.query(qout, processed=True)(db.py:720)
at self._db_execute(db_cursor, sql_query)(db.py:680)
at print(‘%s (%s): %s’ % (round(b-a, 2), self.ctx.dbq_count, str(sql_query)), file=debug)(db.py:623)
at out.write(x)(webapi.py:512)
“CP Server Thread-9” tid=139694666929920
at self.__bootstrap_inner()(threading.py:785)
at self.run()(threading.py:812)
at conn.communicate()(wsgiserver2.py:1532)
… more omitted
at apps = list(db.select(‘application’, vars, where=‘name=$name’))(xxx.py:149)
at return self.query(qout, processed=True)(db.py:720)
at self._db_execute(db_cursor, sql_query)(db.py:680)
at print(‘%s (%s): %s’ % (round(b-a, 2), self.ctx.dbq_count, str(sql_query)), file=debug)(db.py:623)
at out.write(x)(webapi.py:512)
“MainThread” tid=139695478638400
at app.run()(xxx.py:326)
at return wsgi.runwsgi(self.wsgifunc(*middleware))(application.py:341)
at return httpserver.runsimple(func, server_addr)(wsgi.py:59)
at server.start()(httpserver.py:177)
at self.tick()(wsgiserver2.py:1956)
at s, addr = self.socket.accept()(wsgiserver2.py:2008)
at sock, addr = self._sock.accept()(socket.py:202)
at pystack()(pdbx.py:181)
at for filename, lineno, _, line in traceback.extract_stack(stack):(pdbx.py:169)
… omit CP Server Thread-1 / Thread-2 / Thread-6 / Thread-7 / Thread-8
… same as other thread
“CP Server Thread-4” tid=139695180908288
at self.__bootstrap_inner()(threading.py:785)
at self.run()(threading.py:812)
at conn.communicate()(wsgiserver2.py:1532)
… more omitted
at instanc 大专栏 pipe 导致的 CLOSE_WAIT :: Utop's Bloges = list(db.select(‘instance’, vars, where=‘app_name=$app_name and host=$host and port=$port’))(xxx.py:233)
at return self.query(qout, processed=True)(db.py:720)
at self._db_execute(db_cursor, sql_query)(db.py:680)
at print(‘%s (%s): %s’ % (round(b-a, 2), self.ctx.dbq_count, str(sql_query)), file=debug)(db.py:623)
at out.write(x)(webapi.py:512)
“APScheduler” tid=139695219828480
at self.bootstrap_inner()(threading.py:785)
at self.run()(threading.py:812)
at self.target(*self.args, **self.kwargs)(threading.py:765)
at self._event.wait(wait_seconds)(blocking.py:28)
at self.__cond.wait(timeout, balancing)(threading.py:622)
at waiter.acquire()(threading.py:339)
“CP Server Thread-3” tid=139695189300992
at self.__bootstrap_inner()(threading.py:785)
at self.run()(threading.py:812)
at conn.communicate()(wsgiserver2.py:1532)
… more omitted
at instances = list(db.select(‘instance’, vars, where=‘app_name=$app_name and host=$host and port=$port’))(xxx.py:233)
at return self.query(qout, processed=True)(db.py:720)
at self._db_execute(db_cursor, sql_query)(db.py:680)
at print(‘%s (%s): %s’ % (round(b-a, 2), self.ctx.dbq_count, str(sql_query)), file=debug)(db.py:623)
at out.write(x)(webapi.py:512)
“CP Server Thread-5” tid=139695172515584
at self.__bootstrap_inner()(threading.py:785)
at self.run()(threading.py:812)
at conn.communicate()(wsgiserver2.py:1532)
… more omitted
at instances = list(db.select(‘instance’, vars, where=‘app_name=$app_name and host=$host and port=$port’))(xxx.py:233)
at return self.query(qout, processed=True)(db.py:720)
at self._db_execute(db_cursor, sql_query)(db.py:680)
at print(‘%s (%s): %s’ % (round(b-a, 2), self.ctx.dbq_count, str(sql_query)), file=debug)(db.py:623)
at out.write(x)(webapi.py:512)
OK,总计 10 个工作线程,全都阻塞在 `out.write(x)` ,多次打印调用栈结果相同。基本可以断定是 `write` 方法出了问题了。不过直到这个时候,都还是深陷在死锁原因中无法自拔(还是接触得太少了)。

虚度半个多钟... 后看代码了解到,其准备将 SQL 执行结果打印到标准错误。

```python

def _debugwrite(x):

    try:

        out = ctx.environ['wsgi.errors']

    except:

        out = sys.stderr

    out.write(x)

debug.write = _debugwrite
果断去查看 Python 服务的文件描述符 lsof -p <PID> / ls -al /proc/<PID>/fd 。总算见着可信的证据了。
> lsof -p <PID>

python  139756 sysop    0r  FIFO     0,9       0t0 5210639 pipe

python  139756 sysop    1w   REG   253,1      5187 1188500 /home/www/wwwroot/logs/eswitch-console.9999.log

python  139756 sysop    2w  FIFO     0,9       0t0 5210641 pipe

python  139756 sysop    3u  IPv4 5210787       0t0     TCP 10.1.5.60:65442->10.1.6.104:mysql (ESTABLISHED)

python  139756 sysop    4r  FIFO     0,9       0t0 5210774 pipe

python  139756 sysop    5w  FIFO     0,9       0t0 5210774 pipe

python  139756 sysop    6r  FIFO     0,9       0t0 5210778 pipe

python  139756 sysop    7w  FIFO     0,9       0t0 5210778 pipe

python  139756 sysop    8u  IPv4 5210788       0t0     TCP *:distinct (LISTEN)

python  139756 sysop    9u  IPv4 5226722       0t0     TCP localhost:distinct->localhost:26032 (CLOSE_WAIT)

python  139756 sysop   10u  IPv4 5226858       0t0     TCP localhost:distinct->localhost:26052 (CLOSE_WAIT)

... more omitted
> ls -al /proc/<PID>/fd

lr-x------ 1 sysop sysop 64 May 20 13:47 0 -> pipe:[5210639]

l-wx------ 1 sysop sysop 64 May 20 13:47 1 -> /home/path/to/logs/xxx.log

l-wx------ 1 sysop sysop 64 May 20 13:47 2 -> pipe:[5210641]

lrwx------ 1 sysop sysop 64 May 20 13:47 3 -> socket:[5210787]

lr-x------ 1 sysop sysop 64 May 20 13:47 4 -> pipe:[5210774]

l-wx------ 1 sysop sysop 64 May 20 13:47 5 -> pipe:[5210774]

lr-x------ 1 sysop sysop 64 May 20 13:47 6 -> pipe:[5210778]

l-wx------ 1 sysop sysop 64 May 20 13:47 7 -> pipe:[5210778]

... more omitted
标准错误(fd = 2)指向了一个匿名管道(inode = 5210641)。但是找遍整个系统都没有这个匿名管道的读取方,只有写入方
> sudo lsof | grep 5210641

bash      139747          sysop    2w     FIFO                0,9       0t0    5210641 pipe

python    139756          sysop    2w     FIFO                0,9       0t0    5210641 pipe

python    139756 139764   sysop    2w     FIFO                0,9       0t0    5210641 pipe
OK,合理的解释出现了。管道的缓冲区大小有限(经过测试是 64KB),Python 服务在不断地向标准错误打印日志,从而导致匿名管道(inode = 5210641)的缓冲区数据不断积累,最终达到满的状态。这个过程大概需要一天多的心跳包才能积累得到。而系统调用 write 发现标准错误对应的文件已满,为等待 IO 就绪而陷入睡眠状态。同时,Main 线程在不断地 Accept 新的套接字的建立,而没有更多工作线程来处理新的请求,Nginx 因为连接超时直接发出来 FIN 包。最后,积累了几千/上万请求的 Python 服务也没法主动 close 已有的套接字(即 FIN,ACK 包因为没法发送而在本机不断积累 CLOSE_WAIT 状态的连接)
重定向标准错误的原因
至于为何会将标准错误重定向到一个匿名管道呢?百思不得其解,不过最后还是从应用负责人那儿得到了提示。新的发布方式采用了全新的启动命令:
ssh -fn xx.xx.x.60 'cd /home/path/to/xxx ; python -u xxx.py 8080 >> /home/path/to/logs/xxx.log'
一看就能和前面的原因衔接,使用 ssh 直接调用命名,不会建立一个终端,由 ssh 远程命令启动的任务,其标准输入/输出/错误默认将会通过管道重定向的 ssh server 端,并通过网络传回发起的 ssh client 端。
以发起 ssh -fn ... 的机器为 xx.192,目标机器为 xx.60
  xx.192                       |           xx.60

  -----------------------------+-------------------------------

                               |

    ssh client                 |          ssh serve           python serve

  +------------+               |        +------------+       +-------------+

  | 0 | stdin  |               |        | y | pipe[a]| <---> | 0 | pipe[a] |

  | 1 | stdout |               |        | z | pipe[b]| <-+   | 1 | xxx.log |

  | 2 | stderr |               |        |   |        |   +-> | 2 | pipe[b] |

  | ...        |               |        | ...        |       | ...         |

  | x | sock   | <--------------------> | w | sock   |       | ...         |

  +------------+               |        +------------+       +-------------+
Python 服务通过管道与 ssh serve 进行进程间交互,最终会将标准错误打印到 192 机器的标准输出/错误上(一般是终端,也就是我们将在终端上看到 Python 服务的错误日志)。而问题在于 ssh serve 任务被杀掉了,从而 pipe[b] 只能不断地向匿名管道写入数据,而没有任务读取数据,一天多时间也就将缓冲区写满了。
总结
到此为止,问题总算得到了圆满的解释,历时 5 天。最重要的就是通过调用栈定位代码阻塞的原因,否则就真是瞎找。对于匿名管道问题的发现、write 系统调用导致的线程睡眠,都是建立在调用栈信息之上的定向探究的过程。
  __                    __

 / _| __ _ _ __   __ _ / _| ___ _ __   __ _

| |_ / _` | '_  / _` | |_ / _  '_  / _` |

|  _| (_| | | | | (_| |  _|  __/ | | | (_| |

|_|  __,_|_| |_|__, |_|  ___|_| |_|__, |

                 |___/                |___/
pipe 导致的 CLOSE_WAIT :: Utop's Blog的更多相关文章
- CLOSE_WAIT状态的原因与解决方法(转载留自己看)
这个问题之前没有怎么留意过,是最近在面试过程中遇到的一个问题,面了两家公司,两家公司竟然都面到到了这个问题,不得不使我开始关注这个问题.说起CLOSE_WAIT状态,如果不知道的话,还是先瞧一下TCP ...
- TCP连接问题之CLOSE_WAIT和TIME_WAIT过多
参考博文 https://dengqsintyt.iteye.com/blog/2086485 Timeout waiting for connection异常排查:https://blog.csdn ...
- d3d导致cairo不正常
最近要把cairo集成到项目中,却发现cairo不能工作了 折腾了两天才找到了原因:cairo的一个trick导致浮点数计算错误: http://blog.163.com/lvan100@yeah/b ...
- CLOSE_WAIT问题-TCP
环境简述 要说清楚问题,先要简单说下生产环境的网络拓扑(毕竟是个网络问题对吧) 看,挺简单的对吧,一个OpenResty做SLB承受客户端请求,反响代理到几台应用服务器.由于业务要求,必须要同步调用第 ...
- close_wait状态和time_wait状态(TCP连接)
1.CLOSE_WAIT的简单解决方案 不久前,我的Socket Client程序遇到了一个非常尴尬的错误.它本来应该在一个socket长连接上持续不断地向服务器发送数据,如果socket连接断开,那 ...
- 又见CLOSE_WAIT
原文: http://mp.weixin.qq.com/s?__biz=MzI4MjA4ODU0Ng==&mid=402163560&idx=1&sn=5269044286ce ...
- Atitit.http httpclient实践java c# .net php attilax总结
Atitit.http httpclient实践java c# .net php attilax总结 1. Navtree>> net .http1 2. Httpclient理论1 2. ...
- [nginx]第一篇
世界太大,我无法安心学习,决定看一个简单的. nginx-1.11.9的代码是nginx-0.5.38的两倍,决定看前者的. 阅读工具:UnderStand 3.1. 入口在nginx.c的195行. ...
- 原 Linux:ping不通baidu.com
如果某台Linux服务器ping不通域名, 如下提示: [root@localhost ~]# ping www.baidu.com ping: unknown host www.baidu.com ...
随机推荐
- MySQL和Java数据类型对照表
Java MySQL数据类型对照 类型名称 显示长度 数据库类型 JAVA类型 JDBC类型索引(int) 描述 VARCHAR L+N VARCHAR java.lang.S ...
- 实例说明 PeekMessage与GetMessage的区别
PeekMessage与GetMessage的对比相同点:PeekMessage函数与GetMessage函数都用于查看应用程序消息队列,有消息时将队列中 的消息派发出去. 不同点:无论应用程序消息队 ...
- 面向对象 part3 构造函数 原型函数
6.2创建对象 方法:对象字面量 object构造函数 缺点:都是创建单个对象.同一个接口创建多个对象,会产生大量重复代码 6.2.1工厂模式 用函数封装以特定的接口创建对象 function cr ...
- JavaSE--【JAVA】unicode为12288字符
转载:http://blog.csdn.net/zfpigpig/article/details/8186470 今天做一个导入数据功能时发现一个问题,就是一个unicode为12288的字符显示为空 ...
- sol - 0x63
[例题]巡逻 注意到K只能是1或2,也就是说只能建0/1/2条新道路 我们分类讨论 当修建0条新道路的时候, 执行遍历会恰好遍历到每条边2次,答案为2*(n-1) 当修建1条新道路的时候, 我们设新道 ...
- 项目部署篇之——下载安装Xftp6,Xshell6
俗话说工欲善其事必先利其器,想要在服务器上部署环境就得先安装操作工具. 我用的是xshell6,和xftp6.下面是下载连接,都是免费版的,不需要破解 xftp6链接:https://pan.baid ...
- Ubuntu16装Flash
第一种方法: 1)下载flash的tar.gz压缩包.(以·tar.gz为后缀的文件是一种压缩文件,在Linux和macOS下常见,Linux和macOS都可以直接解压使用这种压缩文件) https: ...
- Python基础学习四
Python基础学习四 1.内置函数 help()函数:用于查看内置函数的用途. help(abs) isinstance()函数:用于判断变量类型. isinstance(x,(int,float) ...
- 01 语言基础+高级:1-7 异常与多线程_day06 【线程、同步】
day06 [线程.同步] 主要内容 线程 同步 线程状态 一.学习目标 1. 能够描述Java中多线程运行原理 2. 能够使用继承类的方式创建多线程 3. 能够使用实现接口的方式创建多线程 4. 能 ...
- vue动态绑定class,tab栏