
utmp
How to monitor user login history on CentOS with utmpdump
Last updated on September 22, 2014 Authored by Gabriel Cánepa
Leave a comment
Keeping, maintaining and analyzing logs (i.e., accounts of events that have happened during a certain period of time or are currently happening) are among the most basic and essential tasks of a Linux system administrator. In case of user management, examining user logon and logout logs (both failed and successful) can alert us about any potential security breaches or unauthorized use of our system. For example, remote logins from unknown IP addresses or accounts being used outside working hours or during vacation leave should raise a red flag.
On a CentOS system, user login history is stored in the following binary files:
- /var/run/utmp (which logs currently open sessions) is used by who and w tools to show who is currently logged on and what they are doing, and also by uptime to display system up time.
- /var/log/wtmp (which stores the history of connections to the system) is used by last tool to show the listing of last logged-in users.
- /var/log/btmp (which logs failed login attempts) is used by lastb utility to show the listing of last failed login attempts.
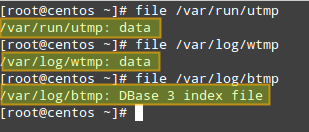


In this post I'll show you how to use utmpdump, a simple program from the sysvinit-tools package that can be used to dump these binary log files in text format for inspection. This tool is available by default on stock CentOS 6 and 7. The information gleaned from utmpdump is more comprehensive than the output of the tools mentioned earlier, and that's what makes it a nice utility for the job. Besides, utmpdump can be used to modify utmp or wtmp, which can be useful if you want to fix any corrupted entries in the binary logs.
How to Use Utmpdump and Interpret its Output
As we mentioned earlier, these log files, as opposed to other logs most of us are familiar with (e.g., /var/log/messages, /var/log/cron, /var/log/maillog), are saved in binary file format, and thus we cannot use pagers such as less or more to view their contents. That is where utmpdump saves the day.
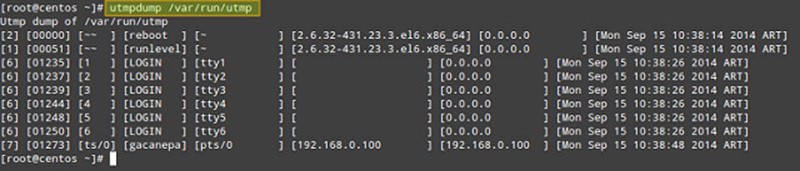
In order to display the contents of /var/run/utmp, run the following command:
# utmpdump /var/run/utmp
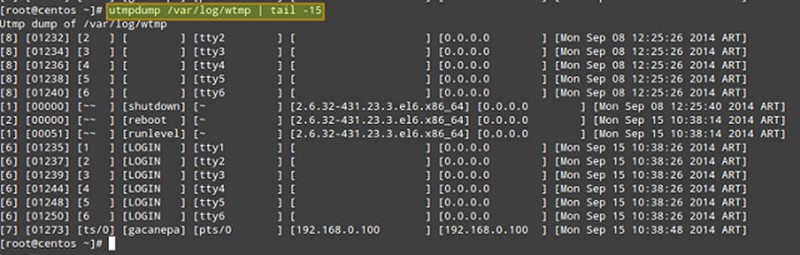
To do the same with /var/log/wtmp:
# utmpdump /var/log/wtmp
and finally with /var/log/btmp:
# utmpdump /var/log/btmp

As you can see, the output formats of three cases are identical, except for the fact that the records in the utmp and btmp are arranged chronologically, while in the wtmp, the order is reversed.
Each log line is formatted in multiple columns described as follows. The first field shows a session identifier, while the second holds PID. The third field can hold one of the following values: ~~ (indicating a runlevel change or a system reboot), bw (meaning a bootwait process), a digit (indicates a TTY number), or a character and a digit (meaning a pseudo-terminal). The fourth field can be either empty or hold the user name, reboot, or runlevel. The fifth field holds the main TTY or PTY (pseudo-terminal), if that information is available. The sixth field holds the name of the remote host (if the login is performed from the local host, this field is blank, except for run-level messages, which will return the kernel version). The seventh field holds the IP address of the remote system (if the login is performed from the local host, this field will show 0.0.0.0). If DNS resolution is not provided, the sixth and seventh fields will show identical information (the IP address of the remote system). The last (eighth) field indicates the date and time when the record was created.
Usage Examples of Utmpdump
Here are a few simple use cases of utmpdump.
1. Check how many times (and at what times) a particular user (e.g., gacanepa) logged on to the system between August 18 and September 17.
# utmpdump /var/log/wtmp | grep gacanepa
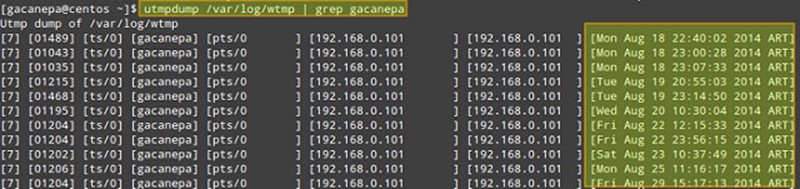
If you need to review login information from prior dates, you can check the wtmp-YYYYMMDD (or wtmp.[1...N]) and btmp-YYYYMMDD (or btmp.[1...N]) files in /var/log, which are the old archives of wtmp and btmp files, generated by logrotate.
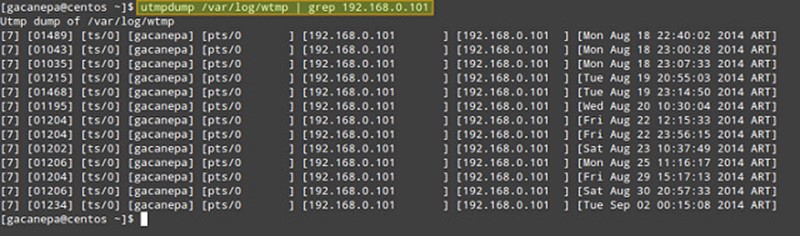
2. Count the number of logins from IP address 192.168.0.101.
# utmpdump /var/log/wtmp | grep 192.168.0.101
3. Display failed login attempts.
# utmpdump /var/log/btmp
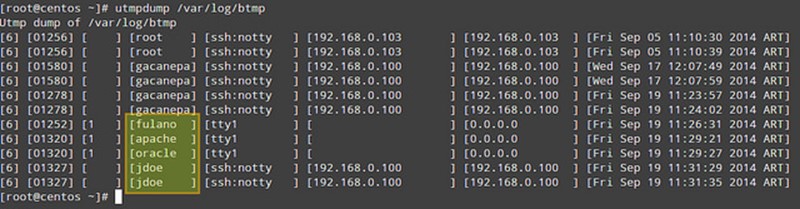
In the output of /var/log/btmp, every log line corresponds to a failed login attempt (e.g., using incorrect password or a non-existing user ID). Logon using non-existing user IDs are highlighted in the above impage, which can alert you that someone is attempting to break into your system by guessing commonly-used account names. This is particularly serious in the cases when the tty1 was used, since it means that someone had access to a terminal on your machine (time to check who has keys to your datacenter, maybe?).
4. Display login and logout information per user session.
# utmpdump /var/log/wtmp

In /var/log/wtmp, a new login event is characterized by '7' in the first field, a terminal number (or pseudo-terminal id) in the third field, and username in the fourth. The corresponding logout event will be represented by '8' in the first field, the same PID as the login in the second field, and a blank terminal number field. For example, take a close look at PID 1463 in the above image.
- On [Fri Sep 19 11:57:40 2014 ART] the login prompt appeared in tty1.
- On [Fri Sep 19 12:04:21 2014 ART], user root logged on.
- On [Fri Sep 19 12:07:24 2014 ART], root logged out.
On a side note, the word LOGIN in the fourth field means that a login prompt is present in the terminal specified in the fifth field.
So far I covered somewhat trivial examples. You can combine utmpdump with other text sculpting tools such as awk, sed, grep or cut to produce filtered and enhanced output.
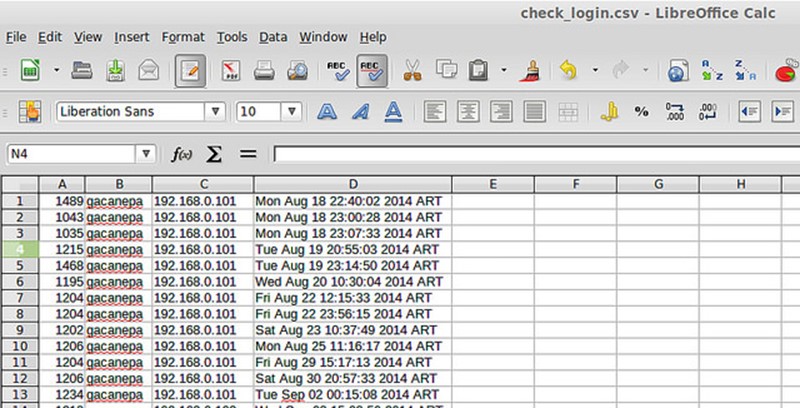
For example, you can use the following command to list all login events of a particular user (e.g., gacanepa) and send the output to a .csv file that can be viewed with a pager or a workbook application, such as LibreOffice's Calc or Microsoft Excel. Let's display PID, username, IP address and timestamp only:
# utmpdump /var/log/wtmp | grep -E "\[7].*gacanepa" | awk -v OFS="," 'BEGIN {FS="] "}; {print $2,$4,$7,$8}' | sed -e 's/\[//g' -e 's/\]//g'

As represented with three blocks in the image, the filtering logic is composed of three pipelined steps. The first step is used to look for login events ([7]) triggered by user gacanepa. The second and third steps are used to select desired fields, remove square brackets in the output of utmpdump, and set the output field separator to a comma.
Of course, you need to redirect the output of the above command to a file if you want to open it later (append "> [name_of_file].csv" to the command).
In more complex examples, if you want to know what users (as listed in /etc/passwd) have not logged on during the period of time, you could extract user names from /etc/passwd, and then run grep the utmpdump output of /var/log/wtmp against user list. As you see, possibility is limitless.
Before concluding, let's briefly show yet another use case of utmpdump: modify utmp or wtmp. As these are binary log files, you cannot edit them as is. Instead, you can export their content to text format, modify the text output, and then import the modified content back to the binary logs. That is:
# utmpdump /var/log/utmp > tmp_output
<modify tmp_output using a text editor>
# utmpdump -r tmp_output > /var/log/utmp
This can be useful when you want to remove or fix any bogus entry in the binary logs.
To sum up, utmpdump complements standard utilities such as who, w, uptime, last, lastb by dumping detailed login events stored in utmp, wtmp and btmp log files, as well as in their rotated old archives, and that certainly makes it a great utility.
Feel free to enhance this post with your comments.
utmp的更多相关文章
- Linux 日志文件utmp、wtmp、lastlog、messages
1.有关当前登录用户的信息记录在文件utmp中:==who命令 2.登录进入和退出纪录在文件wtmp中:==w命令 3.最后一次登录文件可以用lastlog命令察看: 4.messag ...
- utmp, wtmp, and lastlog 日志清除工具
utmp, wtmp, and lastlog 日志清除工具 http://blog.itpub.net/83980/viewspace-801664/
- /var/run/utmp文件操作函数
相关函数:getutent, getutid, getutline, setutent, endutent, pututline, utmpname utmp 结构定义如下:struct utmp{ ...
- Linux日志文件utmp、wtmp、lastlog、messages
1.有关当前登录用户的信息记录在文件utmp中:==who命令 2.登录进入和退出纪录在文件wtmp中:==w命令 3.最后一次登录文件可以用lastlog命令察看: 4.messag ...
- 登陆记录utmp wtmp
/var/log/wtmp文件的作用 /var/log/wtmp也是一个二进制文件,记录每个用户的登录次数和持续时间等信息. 查看方法: 可以用last命令输出当中内容: debian ...
- linux c 操作utmp 和 wtmp 文件接口
/var/run/utmp 保存当前在本系统中的用户信息 /var/log/wtmp 保存登陆过本系统的用户信息 他们保存的信息是基于结构体 struct utmp 的(/usr/include/bi ...
- struct utmp
utmp结构体定义如下: structutmp { short int ut_type; // 登录类型 pid_t ut_pid; // login进程的pid char ut_line[UT_LI ...
- [转帖]Linux日志文件utmp、wtmp、lastlog、messages
Linux日志文件utmp.wtmp.lastlog.messages https://www.cnblogs.com/zhuiluoyu/p/6874255.html 1.有关当前登录用户的信息记录 ...
- utmp, wtmp - 登 录 记 录(login records)
SYNOPSIS[总览] #include DESCRIPTION[描述] utmp 文 件 用 于 记 录 当 前 系 统 用 户 是 哪 些 人. 但 是 实 际 的 人 数 可 能 比 这 个 ...
随机推荐
- Pycharm(二)创建项目
首次打开就是这样,可以创建新项目,打开一个项目,也可以从版本控制打开项目 我们就新建项目吧,Create New Project 创建项目就是这样了 Location:项目路径. Interprete ...
- vue-router配置之通用路径
目的:浏览器地址栏输入了未匹配的地址时,前端控制跳转到首页index页面: 项目入口js:(一般根据项目结构不同,这个js一般取名为:app.js或者main.js) import Router fr ...
- 宿主环境(host environment)
在此前的内容中,我讨论的都是JavaScript语言及其规范,而并非该语言的应用环境.在大多数人看来,JavaScript应用环境都是Web浏览器,这也的确是该语言最早的设计目标.然而从很早开始,Ja ...
- C++设计模式之访问者模式
简述 访问者模式(Visitor Pattern)表示一个作用于某对象结构中的各元素的操作,它使你可以在不改变各元素类的前提下定义作用于这些元素的新操作. 代码实现: // Visitor.cpp : ...
- L1-037 A除以B
真的是简单题哈 —— 给定两个绝对值不超过100的整数A和B,要求你按照“A/B=商”的格式输出结果. 输入格式: 输入在第一行给出两个整数A和B(−100≤A,B≤100),数字间以空格分隔. 输出 ...
- centos7 vsftp的安装
首先下载vsftp yum install -y vsftpd 安装好了之后 编辑默认的文件 vi /etc/vsftpd/vsftpd.conf 更改下面的: anonymous_enable=NO ...
- WLAN 802.11 a/b/g PHY Specification and EDVT Measurement V
Receive Minimum Input Level (Sensitivity) 测试方法: Receiver Adjacent Channel Rejection (ACR) -For IEEE8 ...
- ZooKeeper 之 zkCli.sh客户端的命令使用
zkCli.sh的使用 ZooKeeper服务器简历客户端 ./zkCli.sh -timeout 0 -r -server ip:port ./zkCli.sh -timeout 5000 -ser ...
- Android 源码阅读之SMS,MMS
主界面: com.android.mms.ui.ConversationList.java [extends ListActivity] 点击新建信息:onListItemClick -〉 posi ...
- SWIFT中获取当前经伟度
很多的APP中都会用到用户的当前位置信息,本文将实现这个小功能 import UIKit import CoreLocation //添加引用 class ViewController: UIView ...