memcached command
http://lzone.de/cheat-sheet/memcached
memcached Cheat Sheet
Telnet Interface
How To Connect
Use "ps -ef" to find out which IP and port was passed when memcached was started and use the same with telnet/netcat/... to connect to memcache. Example with netcat:
nc 10.0.0.2 11211
Supported Commands
The supported commands (the official ones and some unofficial) are documented in the doc/protocol.txt document.
Sadly the syntax description isn't really clear and a simple help command listing the existing commands would be much better. Here is an overview of the commands you can find in the source (as of 16.12.2008):
| Command | Description | Example |
|---|---|---|
| get | Reads a value | get mykey |
| set | Set a key unconditionally | set mykey 0 60 5
# Meaning: Ensure to use \r\n als line breaks when using printf "set mykey 0 60 4\r\ndata\r\n" |\ nc localhost 11211 |
| add | Add a new key | add newkey 0 60 5 |
| replace | Overwrite existing key | replace key 0 60 5 |
| append | Append data to existing key | append key 0 60 15 |
| prepend | Prepend data to existing key | prepend key 0 60 15 |
| incr | Increments numerical key value by given number |
incr mykey 2 |
| decr | Decrements numerical key value by given number |
decr mykey 5 |
| delete | Deletes an existing key | delete mykey |
| flush_all | Invalidate specific items immediately | flush_all |
| Invalidate all items in n seconds | flush_all 900 | |
| stats | Prints general statistics | stats |
| Prints memory statistics | stats slabs | |
| Prints memory statistics | stats malloc | |
| Print higher level allocation statistics | stats items | |
| stats detail | ||
| stats sizes | ||
| Dump keys is a slab class | stats cachedump | |
| Resets statistics | stats reset | |
| version | Prints server version. | version |
| verbosity | Increases log level | verbosity |
| quit | Terminate telnet session | quit |
Traffic Statistics
You can query the current traffic statistics using the command
stats
You will get a listing which serves the number of connections, bytes in/out and much more.
Example Output:
STAT pid 14868
STAT uptime 175931
STAT time 1220540125
STAT version 1.2.2
STAT pointer_size 32
STAT rusage_user 620.299700
STAT rusage_system 1545.703017
STAT curr_items 228
STAT total_items 779
STAT bytes 15525
STAT curr_connections 92
STAT total_connections 1740
STAT connection_structures 165
STAT cmd_get 7411
STAT cmd_set 28445156
STAT get_hits 5183
STAT get_misses 2228
STAT evictions 0
STAT bytes_read 2112768087
STAT bytes_written 1000038245
STAT limit_maxbytes 52428800
STAT threads 1
END
Memory Statistics
You can query the current memory statistics using
stats slabs
Example Output:
STAT 1:chunk_size 80
STAT 1:chunks_per_page 13107
STAT 1:total_pages 1
STAT 1:total_chunks 13107
STAT 1:used_chunks 13106
STAT 1:free_chunks 1
STAT 1:free_chunks_end 12886
STAT 2:chunk_size 100
STAT 2:chunks_per_page 10485
STAT 2:total_pages 1
STAT 2:total_chunks 10485
STAT 2:used_chunks 10484
STAT 2:free_chunks 1
STAT 2:free_chunks_end 10477
[...]
STAT active_slabs 3
STAT total_malloced 3145436
END
If you are unsure if you have enough memory for your memcached instance always look out for the "evictions" counters given by the "stats" command. If you have enough memory for the instance the "evictions" counter should be 0 or at least not increasing.
Which Keys Are Used?
There is no builtin function to directly determine the current set of keys. However you can use the
stats items
command to determine how many keys do exist.
stats items
STAT items:1:number 220
STAT items:1:age 83095
STAT items:2:number 7
STAT items:2:age 1405
[...]
END
This at least helps to see if any keys are used. To dump the key names from a PHP script that already does the memcache access you can use the PHP code from 100days.de.
Troubleshooting
1MB Data Limit
Note that prio to memcached 1.4 you cannot store objects larger than 1MB due to the default maximum slab size.
Never Set a Timeout > 30 Days!
If you try to "set" or "add" a key with a timeout bigger than the allowed maximum you might not get what you expect because memcached then treats the value as a Unix timestamp. Also if the timestamp is in the past it will do nothing at all. Your command will silently fail.
So if you want to use the maximum lifetime specify 2592000. Example:
set my_key 0 2592000 1
1
Disappearing Keys on Overflow
Despite the documentation saying something about wrapping around 64bit overflowing a value using "incr" causes the value to disappear. It needs to be created using "add"/"set" again.
Replication
memcached itself does not support replication. If you really need it you need to use 3rd party solutions:
- repcached: Multi-master async replication (memcached 1.2 patch set)
- Couchbase memcached interface: Use CouchBase as memcached drop-in
- yrmcds: memcached compatible Master-Slave key value store
- twemproxy (aka nutcracker): proxy with memcached support
Monitoring
When using memcached or memcachedb everything is fine as long as it is running. But from an operating perspective memcached is a black box. There is no real logging you can only use the -v/-vv/-vvv switches when not running in daemon mode to see what your instance does. And it becomes even more complex if you run multiple or distributed memcache instances available on different hosts and ports.
So the question is: How to monitor your distributed memcache setup?
There are not many tools out there, but some useful are. We'll have a look at the following tools. Note that some can monitor multiple memcached instances, while others can only monitor a single instance at a time.
| Name | Multi-Instances | Complexity/Features |
|---|---|---|
| telnet | no | Simple CLI via telnet |
| memcached-top | no | CLI |
| stats-proxy | yes | Simple Web GUI |
| memcache.php | yes | Simple Web GUI |
| PhpMemcacheAdmin | yes | Complex Web GUI |
| Memcache Manager | yes | Complex Web GUI |
memcached-top
You can use memcache-top for live-monitoring a single memcached instance. It will give you the I/O throughput, the number of evictions, the current hit ratio and if run with "--commands" it will also provide the number of GET/SET operations per interval.
memcache-top v0.6       (default port: 11211, color: on, refresh: 3 seconds)

INSTANCE                USAGE   HIT %   CONN    TIME    EVICT/s GETS/s  SETS/s  READ/s  WRITE/s
10.50.11.5:11211        88.9%   69.7%   1661    0.9ms   0.3     47      9       13.9K   9.8K
10.50.11.5:11212        88.8%   69.9%   2121    0.7ms   1.3     168     10      17.6K   68.9K
10.50.11.5:11213        88.9%   69.4%   1527    0.7ms   1.7     48      16      14.4K   13.6K
[...]

AVERAGE:                84.7%   72.9%   1704    1.0ms   1.3     69      11      13.5K   30.3K

TOTAL:          19.9GB/ 23.4GB          20.0K   11.7ms  15.3    826     132     162.6K  363.6K
(ctrl-c to quit.)
(Example output)
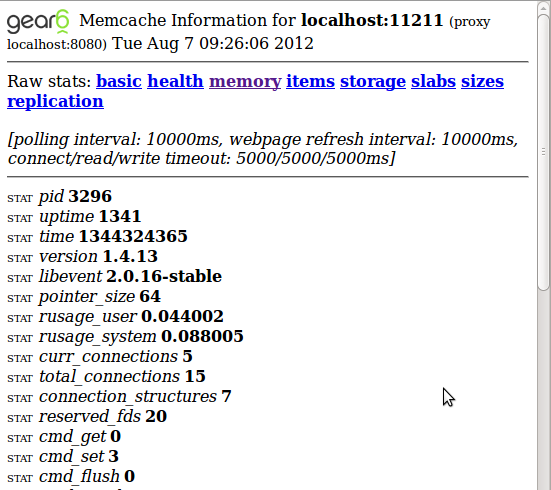
statsproxy
Using the statsproxy tool you get a browser-based statistics tool for multiple memcached instances. The basic idea of statsproxy is to provide the unmodified memcached statistics via HTTP. It also provide a synthetic health check for service monitoring tools like Nagios. To compile statsproxy on Debian:
# Ensure you have bison
sudo apt-get install bison

# Download tarball
tar zxvf statsproxy-1.0.tgz
cd statsproxy-1.0
make
Now you can run the "statsproxy" binary, but it will inform you that it needs a configuration file. I suggest to redirect the output to a new file e.g. "statsproxy.conf" and remove the information text on top and bottom and then to modify the configuration section as needed.
./statsproxy > statsproxy.conf 2>&1
Ensure to add as many "proxy-mapping" sections as you have memcached instances. In each "proxy-mapping" section ensure that "backend" points to your memcached instance and "frontend" to a port on your webserver where you want to access the information for this backend. Once finished run:
./statsproxy -F statsproxy.conf
Below you find a screenshot of what stats-proxy looks like:
memcache.php
Using this PHP script you can quickly add memcached statistics to a webserver of your choice. Most useful is the global memory usage graph which helps to identify problematic instances in a distributed environment. Here is how it should look (screenshot from the project homepage): 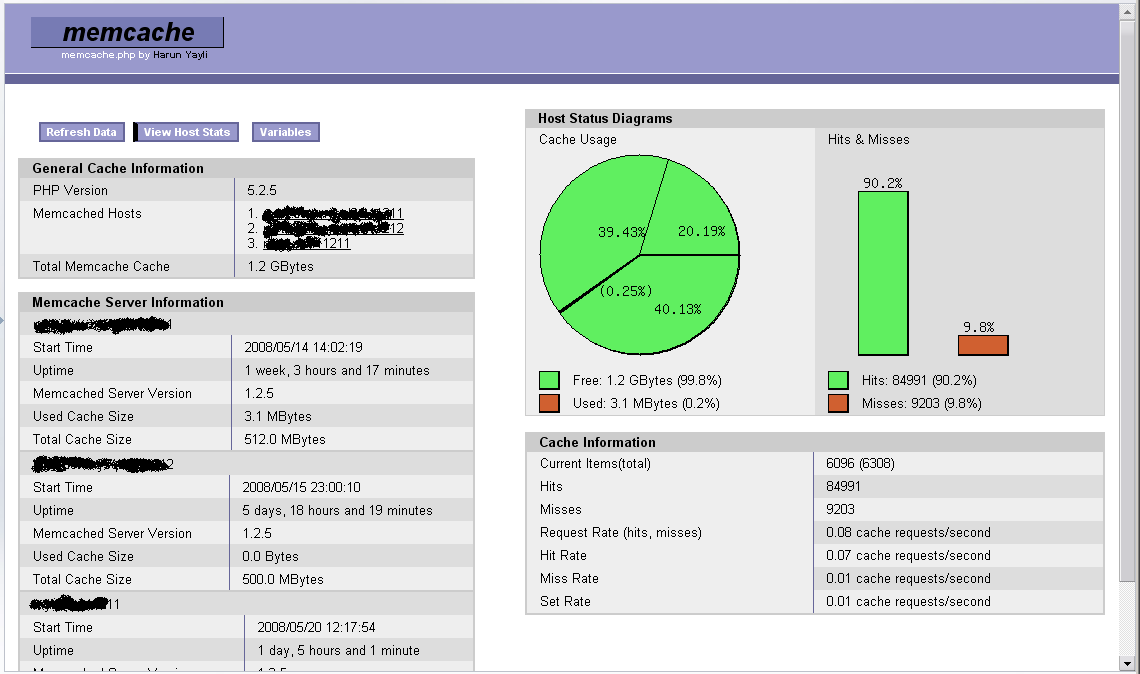 When using this script ensure access is protected and not to trigger the "flush_all" menu option by default. Also on large memcached instances refrain from dumping the keys as it might cause some load on your server.
Memcached Bindings
- Tomcat: memcached-session-manager
- libketama: https://github.com/RJ/ketama (supports C, PHP, Java, Python)
- libmemcached: http://libmemcached.org (used by PHP and others)
- python-memcached https://pypi.python.org/pypi/python-memcached (implemented in Python)
- pylibmc https://pypi.python.org/pypi/pylibmc/1.4.1 (implemented in C)
Dumping Memcache Keys
You spent already 50GB on the memcache cluster, but you still see many evictions and the cache hit ratio doesn't look good since a few days. The developers swear that they didn't change the caching recently, they checked the code twice and have found no problem. What now? How to get some insight into the black box of memcached? One way would be to add logging to the application to see and count what is being read and written and then to guess from this about the cache efficiency. For to debug what's happening we need to set how the cache keys are used by the application. An Easier Way Memcache itself provides a means to peek into its content. The memcache protocol provides commands to peek into the data that is organized by slabs (categories of data of a given size range). There are some significant limitations though:
- You can only dump keys per slab class (keys with roughly the same content size)
- You can only dump one page per slab class (1MB of data)
- This is an unofficial feature that might be removed anytime.
The second limitation is propably the hardest because 1MB of several gigabytes is almost nothing. Still it can be useful to watch how you use a subset of your keys. But this might depend on your use case. If you don't care about the technical details just skip to the tools section to learn about what tools allow you to easily dump everything. Alternatively follow the following guide and try the commands using telnet against your memcached setup. How it WorksFirst you need to know how memcache organizes its memory. If you start memcache with option "-vv" you see the slab classes it creates. For example
$ memcached -vv
slab class   1: chunk size        96 perslab   10922
slab class   2: chunk size       120 perslab    8738
slab class   3: chunk size       152 perslab    6898
slab class   4: chunk size       192 perslab    5461
[...]
In the configuration printed above memcache will keep fit 6898 pieces of data between 121 and 152 byte in a single slab of 1MB size (6898*152). All slabs are sized as 1MB per default. Use the following command to print all currently existing slabs:
stats slabs
If you've added a single key to an empty memcached 1.4.13 with
set mykey 0 60 1
1
STORED
you'll now see the following result for the "stats slabs" command:
stats slabs
STAT 1:chunk_size 96
STAT 1:chunks_per_page 10922
STAT 1:total_pages 1
STAT 1:total_chunks 10922
STAT 1:used_chunks 1
STAT 1:free_chunks 0
STAT 1:free_chunks_end 10921
STAT 1:mem_requested 71
STAT 1:get_hits 0
STAT 1:cmd_set 2
STAT 1:delete_hits 0
STAT 1:incr_hits 0
STAT 1:decr_hits 0
STAT 1:cas_hits 0
STAT 1:cas_badval 0
STAT 1:touch_hits 0
STAT active_slabs 1
STAT total_malloced 1048512
END
The example shows that we have only one active slab type #1. Our key being just one byte large fits into this as the smallest possible chunk size. The slab statistics show that currently on one page of the slab class exists and that only one chunk is used. Most importantly it shows a counter for each write operation (set, incr, decr, cas, touch) and one for gets. Using those you can determine a hit ratio! You can also fetch another set of infos using "stats items" with interesting counters concerning evictions and out of memory counters.
stats items
STAT items:1:number 1
STAT items:1:age 4
STAT items:1:evicted 0
STAT items:1:evicted_nonzero 0
STAT items:1:evicted_time 0
STAT items:1:outofmemory 0
STAT items:1:tailrepairs 0
STAT items:1:reclaimed 0
STAT items:1:expired_unfetched 0
STAT items:1:evicted_unfetched 0
END
What We Can Guess Already... Given the statistics infos per slabs class we can already guess a lot of thing about the application behaviour:
- How is the cache ratio for different content sizes?
- How good is the caching of large HTML chunks?
- How much memory do we spend on different content sizes?
- How much do we spend on simple numeric counters?
- How much do we spend on our session data?
- How much do we spend on large HTML chunks?
- How many large objects can we cache at all?
Of course to answer the questions you need to know about the cache objects of your application. Now: How to Dump Keys? Keys can be dumped per slabs class using the "stats cachedump" command.
stats cachedump <slab class> <number of items to dump>
To dump our single key in class #1 run
stats cachedump 1 1000
ITEM mykey [1 b; 1350677968 s]
END
The "cachedump" returns one item per line. The first number in the braces gives the size in bytes, the second the time until expiry. Given the key name you can now also dump its value using
get mykey
VALUE mykey 0 1
1
END
This is it: iterate over all slabs classes you want, extract the key names and if need dump there contents.
Dumping Tools
There are different dumping tools sometimes just scripts out there that help you with printing memcache keys:
| PHP | simple script | Prints key names. |
| Perl | simple script | Prints keys and values |
| Ruby | simple script | Prints key names. |
| Perl | memdump | Tool in CPAN module Memcached-libmemcached |
| PHP | memcache.php | Memcache Monitoring GUI that also allows dumping keys |
| libmemcached | peep |
Does freeze your memcached process!!! Be careful when using this in production. Still using it you can workaround the 1MB limitation and really dump allkeys. |
Using Consistent Hashing
Papers:
nginx
 upstream somestream {
      consistent_hash $request_uri;
      server 10.0.0.1:11211;
      server 10.0.0.2:11211;
      ...
    }
PHP
Note: the order of setOption() and addServers() is important. When using OPT_LIBKETAMA_COMPATIBLE the hashing is compatible with all other runtimes using libmemcached.
$memcached = new Memcached();
$memcached->setOption(Memcached::OPT_DISTRIBUTION, Memcached::DISTRIBUTION_CONSISTENT);
$memcached->setOption(Memcached::OPT_LIBKETAMA_COMPATIBLE, true);
$memcached->addServers($servers);
Perl
$m = new Memcached('mymemcache');
$m->setOptions(array(
   ...
   Memcached::OPT_LIBKETAMA_COMPATIBLE => true,
   Memcached::OPT_DISTRIBUTION => Memcached::DISTRIBUTION_CONSISTENT,
   ...
));
$m->addServers(...);
Memcache Alternatives
Below is a list of tools competing with memcached in some manner and a probably subjective rating of each.
| Name | Difference | Why [Not] Use It? |
|---|---|---|
| memcached | % | Because it simple and fast |
| memcachedb | Persistence with BDB | Because it is a simple and fast as memcached and allows easy persistence and backup. But not maintained anymore since 2008! |
| BDB | Simple and old | Use when you want an embedded database. Rarely used for web platforms. Has replication. |
| CouchBase | HTTP(S) transport, authentication, buckets, memcached compatible default bucket. Includes moxi proxy that can run on client side or with CouchBase instances. | Sharding, replication and online rebalancing. Often found in small Hadoop setup. Easy drop-in for memcached caching with no consistent hashing. |
| DynamoDB | HTTP transport, Amazon cloud | If you are in AWS anyway and want sharding and persistency |
| Redis | Key difference is the rich data types: Hashes, Lists, Scanning for Keys, Replication | Great bindings. Good documentation. Flexible yet simple data types. Slower than memcached (read more). |
| Riak | Sharded partitioning in a commerical cloud. | Key-value store as a service. Transparent scaling. Automatic sharding. Map reduce support. |
| Sphinx | Search Engine with SQL query caching | Supports sharding and full text search. Useful for static medium data sets (e.g. web site product search) |
| MySQL 5.6 | Full RDBMS with memcached API | Because you can run queries against the DB via memcached protocol. |
There are many more key-value stores. If you wonder what else is out there look at the db-engines.com rankings.
Suggested Reading
memcached command的更多相关文章
- memcached 的简介、安装、命令
一.memcached 概述 Memcache(内存,缓存) : 是一个高性能的分布式的内存对象缓存系统.通过在内存里维护一个巨大的hash表.(key=value) Hash表 key(键) val ...
- memcached server install(WSL)
prepare:0) libevent-dev1) libseccomp-dev2) build-essential3) automake install: https://www.liquidweb ...
- Memcache服务器端+Redis服务器端+PHP Memcache扩展+PHP Memcached扩展+PHP Redis扩展+MemAdmin Memcache管理工具+一些概念(更新中)
Memcache和Redis因为操作简单,是我们常用的服务器数据缓存系统,以下文字仅作备忘记录,部份转载至网络. 一.定义 1.Memcache Memcache是一个高性能的分布式的内存对象缓存系统 ...
- memcached 笔记之windows 7 下面 安装memcached 报错
windows 7 下面 安装memcached 报错 两种情况: 一:服务确实已经安装过 .如需要重新安装,当然是先memcached.exe -d uninstall 二:奇怪的是服务确实没有安装 ...
- 为 Memcached 构建基于 Go 的 Operator 示例
Operator SDK 中的 Go 编程语言支持可以利用 Operator SDK 中的 Go 编程语言支持,为 Memcached 构 建基于 Go 的 Operator 示例.分布式键值存储并管 ...
- gearman学习笔记1
1.简介 gearman是一个分布式开发框架,适合处理一些必须处理但是不影响主流程的操作,比如保存日志.发送邮件.缩略图片等.最早是基于perl语言的,2008年发布的时候改为C++语言开 ...
- Supervisor (进程管理利器) 使用说明 - 运维笔记
一.Supervisor简单介绍supervisor是一个 Client/Server模式的系统,允许用户在类unix操作系统上监视和控制多个进程,或者可以说是多个程序.supervisor与laun ...
- kubernetes node管理
目录 Node的扩缩容 删除node节点 Node的隔离与恢复 通过配置文件实现 通过命令行的方式实现 恢复 更新资源对象的label 给一个node添加一个label 将pod调度到指定的node ...
- OpenShift 4.3环境中创建基于Go的Operator
详细步骤可以参考官方文档 https://docs.openshift.com/container-platform/4.3/operators/operator_sdk/osdk-getting-s ...
随机推荐
- Oracle Enterprise Linux 64-bit 下Oracle11g的监听配置修改及测试步骤
测试环境:Oracle Enterprise Linux 64-bit (5.8版本) + Oracle 11g 64位 相关说明: Oracle11g64位软件的安装位置为/u01/app/orac ...
- XML Publisher Report Issues, Recommendations and Errors
In this Document Purpose Questions and Answers References APPLIES TO: Oracle Process Manufactu ...
- 《java入门第一季》之面向对象多态面试题(多态收尾)
/* 看程序写结果:先判断有没有问题,如果没有,写出结果 */ class A { public void show() { show2(); } public void show2() { Syst ...
- How Many Processes Should Be Set For The Receiving Transaction Manager (RTM)
In this Document Goal Solution References APPLIES TO: Oracle Inventory Management - Version 10 ...
- Dynamics CRM ISV文件夹禁用后的解决方案
众所周知微软在CRM2011的12补丁后取消了对ISV文件夹的支持,那我们自定义开发的一些web应用或者是想部署个服务该怎么办,有的选择了另开一个站点发布.我们以服务为例这样的另开站点的发布方式会导致 ...
- 安卓打开File Explorer里面不显示内容
其实这不算是开发问题,是自己对这个文件的内容不了解罢了.这个文件的内容与手机是直接相关系的.只有打开模拟器才可以查看里面的内容. 打开模拟器,里面的文件一览无余.因为自己遇到了问题,还有些惊慌,但真实 ...
- 数据包接收系列 — IP协议处理流程(一)
本文主要内容:在接收数据包时,IP协议的处理流程. 内核版本:2.6.37 Author:zhangskd @ csdn blog IP报头 IP报头: struct iphdr { #if defi ...
- The 16th tip of DB Query Analyzer
The 16th tip of DB Query Analyzer ---- SQL Schedule will be executed even DBMS h ...
- Android网络请求框架之Retrofit实践
网络访问框架经过了从使用最原始的AsyncTask构建简单的网络访问框架(甚至不能称为框架),后来使用开源的android-async-http库,再到使用google发布的volley库,一直不懈的 ...
- DTN学习,theONE模拟器网络相关资料整理
下面是一个百度空间的: http://hi.baidu.com/jensenliao 博客园的一篇博客:theONE模拟器简介(主要讲述,软件配置,软件结构) http://www.cnblogs.c ...