wepy绘制雷达图
代码如下:
<style lang='less'>

  .radar-canvas2 {

    width: 690rpx;

    height: 420rpx;

  }

</style>

<template>

  <canvas class='radar-canvas2' canvas-id='radar-canvas'></canvas>

</template>

<script>

import wepy from 'wepy'

var windowW = wx.getSystemInfoSync().windowWidth

export default class RadarCanvas extends wepy.component {

  props = {

    source: {

      default: [

        {desc: '综合', value: 0},

        {desc: '思修法基', value: 0},

        {desc: '史纲', value: 0},

        {desc: '马原', value: 0},

        {desc: '毛中特', value: 0}

      ],

      type: Array

    }

  }

  data = {

    ctx: null,

    sideNum: 5,

    angle: 1.26,

    centerPointX: 345,

    centerPointY: 210,

    radius: 120

  }

  methods = {

    drawCanvas: () => {

      let ctx = wx.createCanvasContext('radar-canvas')

      this.sideNum = this.source.length

      this.angle = Math.PI * 2 / this.sideNum

      this.centerPointX = this.rpx(690 / 2)

      this.centerPointY = this.rpx(420 / 2)

      this.radius = this.rpx(120)

      this.$apply()

      this.drawPolygon(ctx)

      this.drawRib(ctx)

      this.addDataPoint(ctx)

      this.linePoint(ctx)

      ctx.draw(false)

    }

  }

  drawPolygon(ctx) {

    ctx.setLineDash([2, 2])

    ctx.setStrokeStyle('#E3E2E2')

    let r = this.rpx(30)

    for (let i = 1; i < 5; i++) {

      ctx.beginPath()

      let currR = r * i // 当前半径

      ctx.setFontSize(this.rpx(20))

      ctx.setFillStyle('#8E8C8B')

      ctx.setTextAlign('right')

      ctx.fillText(25 * (i - 1), this.centerPointX - 5, this.centerPointY - r * (i - 1) + this.rpx(10))

      //  最外面的是实线

      if (i === 4) {

        ctx.setLineDash()

      }

      for (let j = 0; j < this.sideNum; j++) {

        let x = this.centerPointX + currR * Math.cos(this.angle * j + Math.PI / 3.3)

        let y = this.centerPointY + currR * Math.sin(this.angle * j + Math.PI / 3.3)

        ctx.lineTo(x, y)

      }

      ctx.closePath()

      ctx.stroke()

    }

  }

  drawRib(ctx) {

    ctx.setLineDash([2, 2])  // 虚线

    ctx.setStrokeStyle('#E3E2E2')

    ctx.beginPath()

    for (let i = 0; i < this.sideNum; i++) {

      let x = this.centerPointX + this.radius * Math.cos(this.angle * i + Math.PI / 3.3)

      let y = this.centerPointY + this.radius * Math.sin(this.angle * i + Math.PI / 3.3)

      ctx.moveTo(this.centerPointX, this.centerPointY)

      ctx.lineTo(x, y)

      ctx.setFontSize(this.rpx(28))

      ctx.setFillStyle('#8E8C8B')

      switch (i) {

        case 0:

          ctx.setTextAlign('left')

          ctx.fillText(this.source[i].desc, x, y + 20)

          break

        case 1:

          ctx.setTextAlign('right')

          ctx.fillText(this.source[i].desc, x, y + 20)

          break

        case 2:

          ctx.setTextAlign('right')

          ctx.fillText(this.source[i].desc, x - 10, y)

          break

        case 3:

          ctx.setTextAlign('center')

          ctx.fillText(this.source[i].desc, x, y - 10)

          break

        case 4:

          ctx.setTextAlign('left')

          ctx.fillText(this.source[i].desc, x + 10, y)

          break

        default:

          break

      }

    }

    ctx.closePath()

    ctx.stroke()

  }

  addDataPoint(ctx) {

    ctx.setLineDash()

    for (let i = 0; i < this.sideNum; i++) {

      let x = this.centerPointX + this.radius * Math.cos(this.angle * i + Math.PI / 3.3) * this.source[i].value

      let y = this.centerPointY + this.radius * Math.sin(this.angle * i + Math.PI / 3.3) * this.source[i].value

      ctx.beginPath()

      ctx.arc(x, y, this.rpx(4), 0, 2 * Math.PI)

      ctx.setFillStyle('#47D891')

      ctx.fill()

      ctx.closePath()

    }

  }

  linePoint(ctx) {

    ctx.setStrokeStyle('#47D891')

    ctx.beginPath()

    for (var i = 0; i < this.sideNum; i++) {

      var x = this.centerPointX + this.radius * Math.cos(this.angle * i + Math.PI / 3.3) * this.source[i].value

      var y = this.centerPointY + this.radius * Math.sin(this.angle * i + Math.PI / 3.3) * this.source[i].value

      ctx.lineTo(x, y)

    }

    ctx.closePath()

    ctx.setFillStyle('rgba(37,212,129,0.25)')

    ctx.fill()

    ctx.stroke()

  }

  rpx(param) {

    return Number((windowW / 750 * param).toFixed(2))

  }

}

</script>
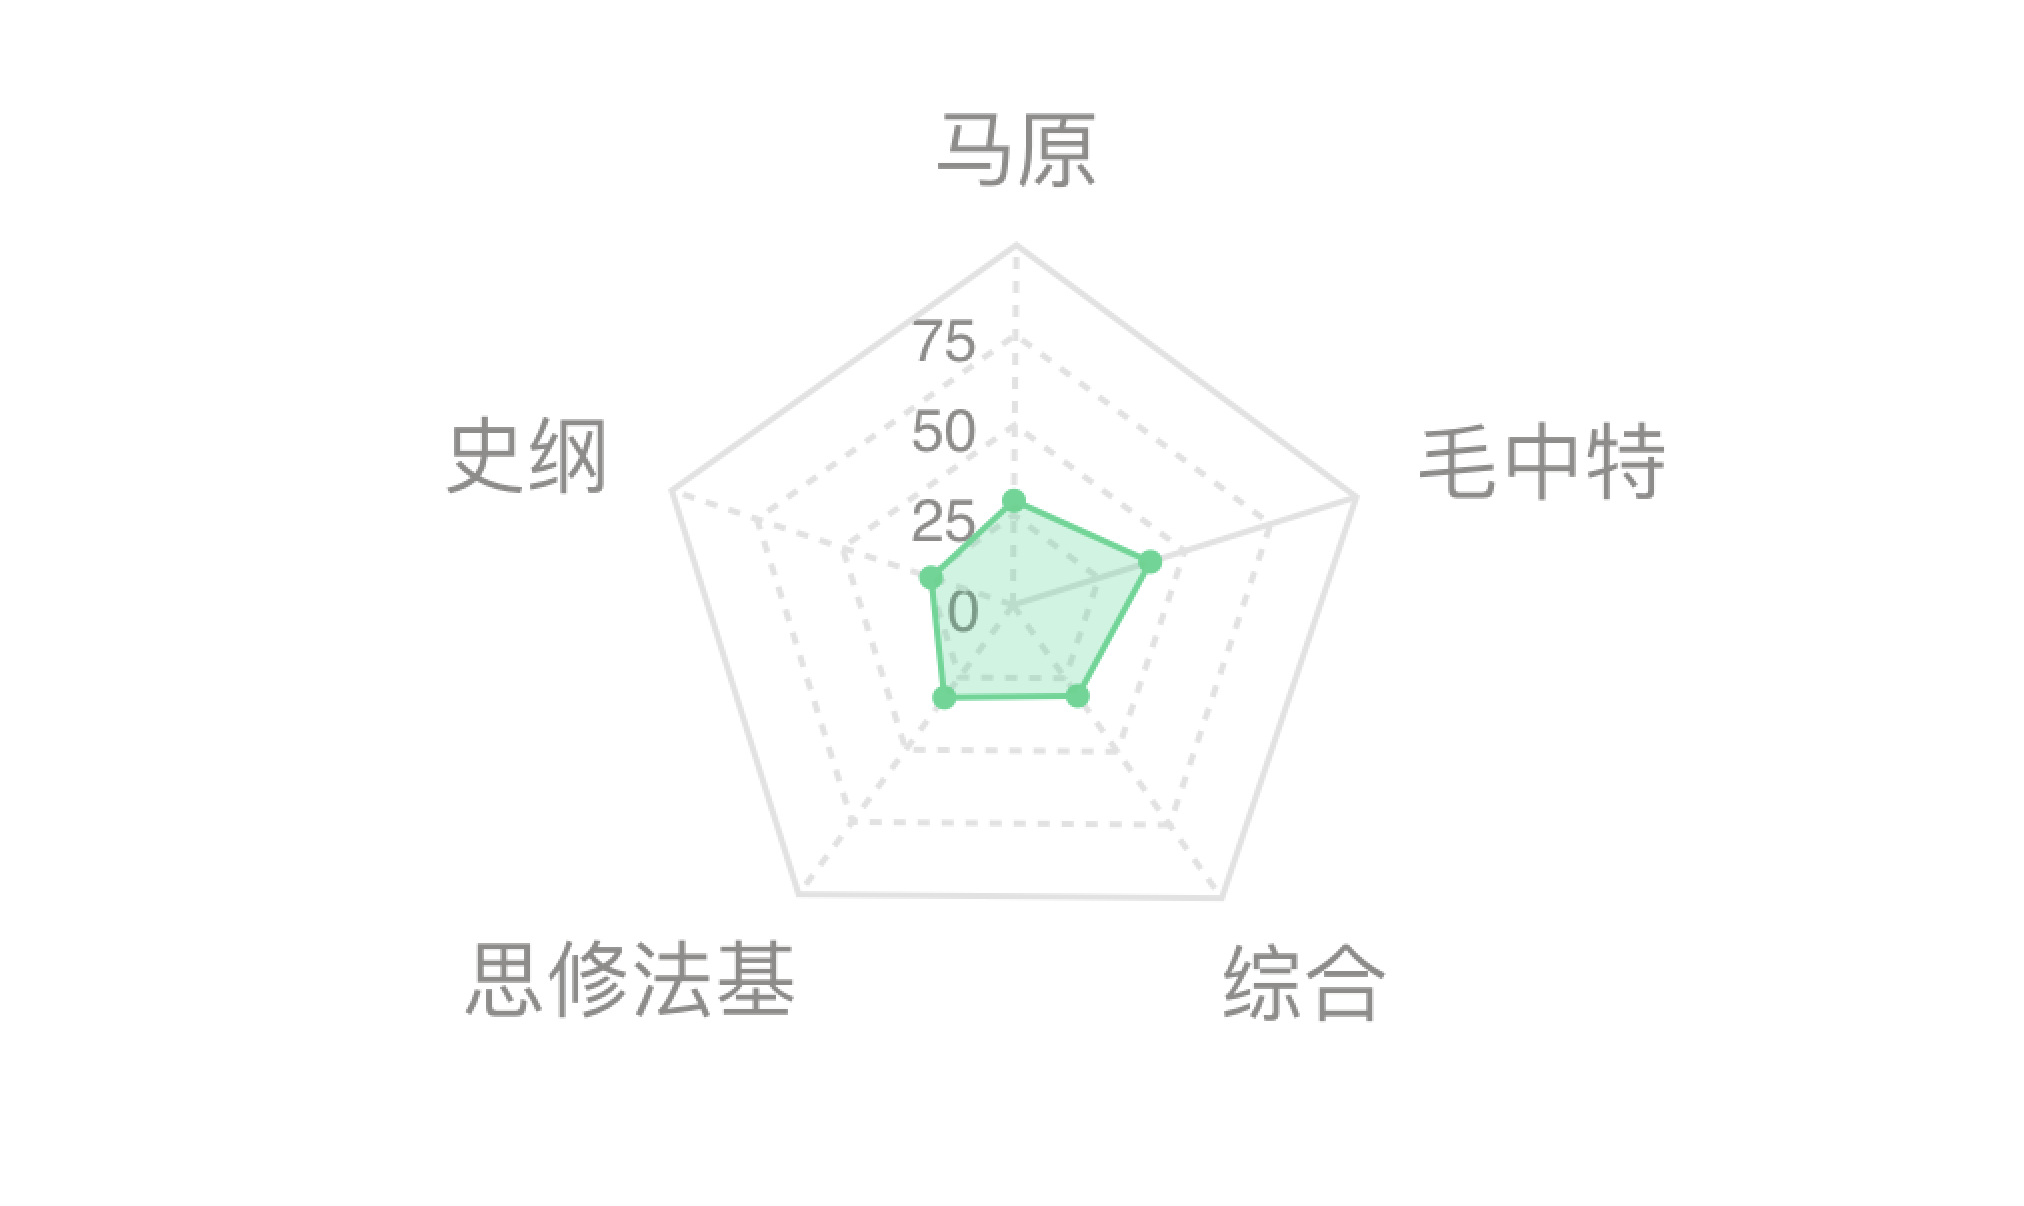
效果图如下:
wepy绘制雷达图的更多相关文章
- 【带着canvas去流浪(6)】绘制雷达图
目录 一. 任务说明 二. 重点提示 三. 示例代码 示例代码托管在:http://www.github.com/dashnowords/blogs 博客园地址:<大史住在大前端>原创博文 ...
- Emgu-WPF 激光雷达研究-绘制雷达图
原文:Emgu-WPF 激光雷达研究-绘制雷达图 硬件:Hokuyo URG04LX 环境:VS2017- win10- 64 Emgu_3.2.0.2682 语言:C# WPF 数据解析参考 ...
- 带着canvas去流浪系列之六 绘制雷达图
[摘要] 用canvas原生API实现百度Echarts基本图表. 示例代码托管在:http://www.github.com/dashnowords/blogs 一. 任务说明 使用原生canvas ...
- 利用matlibplot绘制雷达图
之前在一些数据分析案例中看到用 Go 语言绘制的雷达图,非常的漂亮,就想着用matlibplot.pyplot也照着画一个,遗憾的是matlibplot.pyplot模块中没有直接绘制雷达图的函数,不 ...
- 利用d3.js绘制雷达图
利用d3,js将数据可视化,能够做到数据与代码的分离.方便以后改动数据. 这次利用d3.js绘制了一个五维的雷达图.即将多个对象的五种属性在一张图上对照. 数据写入data.csv.数据类型写入typ ...
- Mesh绘制雷达图(UGUI)
参考资料:http://www.cnblogs.com/jeason1997/p/5130413.html ** 描述:雷达图 刷新 radarDate.SetVerticesDirty(); usi ...
- C# 使用GDI绘制雷达图
最近项目要用C#实现画一个雷达图,搜了搜网上竟然找不到C#画雷达图的解决方案,那么自己实现一个吧 实现效果如下图: 代码如下: public static class RadarDemo { ; ; ...
- Python绘制雷达图(俗称六芒星)
原文链接:https://blog.csdn.net/Just_youHG/article/details/83904618 背景 <Python数据分析与挖掘实战> 案例2–航空公司客户 ...
- R语言绘图:雷达图
使用fmsb包绘制雷达图 library("fmsb") radarfig <- rbind(rep(90, 4), rep(60, 4), c(86.17, 73.96, ...
随机推荐
- poj1039 Pipe【计算几何】
含[求直线交点].[判断直线与线段相交]模板 Pipe Time Limit: 1000MS Memory Limit: 10000K Total Submissions:11940 Ac ...
- Oracle安装部署之RAC安装环境配置脚本
#!/bin/bash#Usage:Log on as the superuser('root'),and then execute the command:#./1preusers.sh group ...
- android showDialog用法
protected Dialog onCreateDialog(int id) { // TODO Auto-generated method stub switch(id){ case 10: re ...
- 整合最优雅SSM框架:SpringMVC + Spring + MyBatis 基础
在写代码之前我们先了解一下这三个框架分别是干什么的? 相信大以前也看过不少这些概念,我这就用大白话来讲,如果之前有了解过可以跳过这一大段,直接看代码! SpringMVC:它用于web层,相当于con ...
- [py][mx]实现按照课程机构排名,按照学习人数排名
原型是 实现效果 因为要按照这两个指标排名, 模型中现在还没有这2个字段(整数),所以需要修改模型. 修改模型,添加2个排序指标的字段 class CourseOrg(models.Model): . ...
- linux问题点滴,给普通用户添加sudo权限
最近又把linux捡起来了,虚拟机中安个元老级centos5.3继续搞.使用sudo临时获取超管权限命令时,提示”xxx is not in the sudoers file. This incide ...
- 2017-2018 ACM-ICPC Southeastern European Regional Programming Contest (SEERC 2017) Solution
A:Concerts 题意:给出一个串T, 一个串S,求串S中有多少个串T,可以重复,但是两个字符间的距离要满足给出的数据要求 思路:先顺序统计第一个T中的字符在S中有多少个,然后对于第二位的以及后面 ...
- ng-深度学习-课程笔记-11: 卷积神经网络(Week1)
1 边缘检测( edage detection ) 下图是垂直边缘检测的例子,实际上就是用一个卷积核进行卷积的过程. 这个例子告诉我们,卷积可以完成垂直方向的边缘检测.同理卷积也可以完成水平方向的边缘 ...
- Redis 资料整理
Redis is an open source, BSD licensed, advanced key-value store. Redis is often referred to as a dat ...
- WdatePicker设置日期范围
设置 结束日期不超过当天日期:设置 开始日期不超过结束日期:设置 开始日期默认显示当月1日的日期,结束日期显示当天日期?<label>开始日期:</label><inpu ...