
matlab中wvtool
参考:https://ww2.mathworks.cn/help/signal/ref/wvtool.html?searchHighlight=wvtool&s_tid=doc_srchtitle
wvtool 工具可以同时查看时域和频域图
wvtool
Open Window Visualization Tool
Syntax
wvtool(WindowVector)
wvtool(WindowVector1,...,WindowVectorN)
 H = wvtool(...)
Description
wvtool( opens the Window Visualization Tool (WVTool) with time and frequency domain plots of the window vector specified in WindowVector)WindowVector. WindowVector must be a real-valued row or column vector. By default, the frequency domain plot is the magnitude squared of the Fourier transform of the window vector in decibels (dB). You can generate window vectors for a number of common window functions using the Signal Processing Toolbox software. See window for a list of supported window functions.
wvtool( opens WVTool with time and frequency domain plots of the window vectors specified in WindowVector1,...,WindowVectorN)WindowVector1, …, WindowVectorN.
H = wvtool(...) returns the figure handle, H.
Note
A related tool, Window Designer, is available for designing and analyzing windows.

Note
If you launch WVTool from Filter Designer, an Add/Replace icon, which controls how new windows are added from Filter Designer, appears on the toolbar.
WVTool Menus
In addition to the usual menus items, wvtool contains these wvtool-specific menu commands:
File menu:
Export — Exports the displayed plot(s) to a graphic file.
Edit menu:
Copy figure — Copies the displayed plot(s) to the clipboard (available only on Windows platforms).
Copy options — Displays the Preferences dialog box (available only on Windows platforms).
Figure, Axes, and Current Object Properties — Displays the Property Editor.
View menu:
Time domain — Check to show the time domain plot.
Frequency domain — Check to show the frequency domain plot.
Legend — Toggles the window name legend on and off. This option is also available with the Legend toolbar button.
Analysis Parameters — Controls the response plot parameters, including number of points, range, x- and y-axis units, sampling frequency, and normalized magnitude.
You can also access the Analysis Parameters by right-clicking the x-axis label of a plot in the Window Viewer panel.
Insert menu:
You use the Insert menu to add labels, titles, arrows, lines, text, and axes to your plots.
Tools menu:
Edit Plot — Turns on plot editing mode
Zoom In — Zooms in along both x- and y-axes.
Zoom X — Zooms in along the x-axis only. Drag the mouse in the x direction to select the zoom area.
Zoom Y — Zooms in along the y-axis only. Drag the mouse in the y direction to select the zoom area.
Full View — Returns to full view.
Examples
Display and Compare Windows
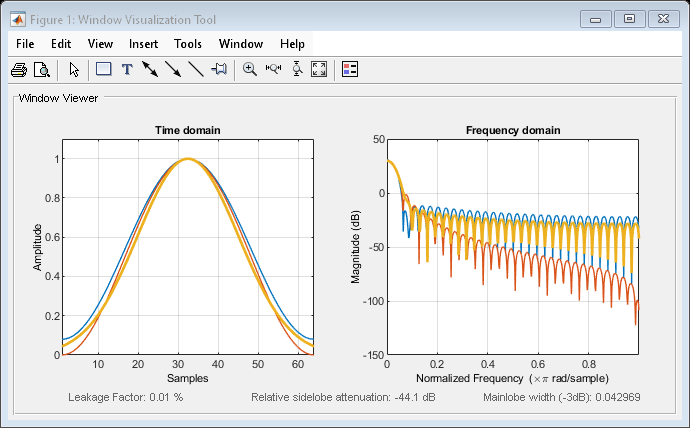
Use wvtool to display and compare 64-point Hamming, Hann, and Gaussian windows.
wvtool(hamming(64),hann(64),gausswin(64))
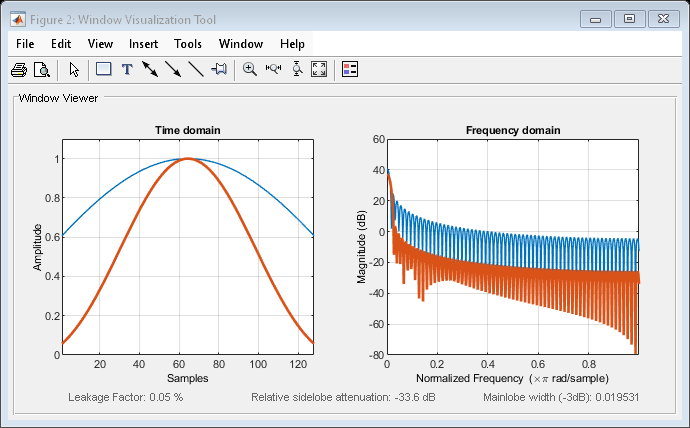
Compare 128-point Kaiser windows with different values of β.
wvtool(kaiser(128,1.5),kaiser(128,4.5))
matlab中wvtool的更多相关文章
- MATLAB中绘制质点轨迹动图并保存成GIF
工作需要在MATLAB中绘制质点轨迹并保存成GIF以便展示. 绘制质点轨迹动图可用comet和comet3命令,使用例子如下: t = 0:.01:2*pi;x = cos(2*t).*(cos(t) ...
- matlab 中 eps 的分析
eps(a)是|a|与大于|a|的最小的浮点数之间的距离,距离越小表示精度越高.默认a=1: 这里直接在matlab中输入:eps == eps(1)(true). 我们知道浮点数其实是离散的,有限的 ...
- matlab中patch函数的用法
http://blog.sina.com.cn/s/blog_707b64550100z1nz.html matlab中patch函数的用法——emily (2011-11-18 17:20:33) ...
- paper 121 :matlab中imresize函数
转自:http://www.cnblogs.com/rong86/p/3558344.html matlab中函数imresize简介: 函数功能:该函数用于对图像做缩放处理. 调用格式: B = i ...
- MATLAB中FFT的使用方法
MATLAB中FFT的使用方法 说明:以下资源来源于<数字信号处理的MATLAB实现>万永革主编 一.调用方法X=FFT(x):X=FFT(x,N):x=IFFT(X);x=IFFT(X, ...
- MATLAB中fft函数的正确使用方法
问题来源:在阅读莱昂斯的<数字信号处理>第三章离散傅里叶变换时,试图验证实数偶对称信号的傅里叶变换实部为偶对称的且虚部为零.验证失败.验证信号为矩形信号,结果显示虚部是不为零且最大幅值等于 ...
- Matlab中的一些小技巧
(转于它处,仅供参考) 1.. Ctrl+C 中断正在执行的操作 如果程序不小心进入死循环,或者计算时间太长,可以在命令窗口中使用Ctrl+c来中断.MATLAB这时可能正疲于应付,响应会有些滞后. ...
- Matlab中给figure添加图例(legend),标题(title)和颜色(color)
在Matlab绘图过程中,尤其是需要将多个图绘制在相同的坐标轴中时,通常需要将不同的曲线设置成为不同的颜色.此外,为了直观,还需要给这张图标增添标题和图例.这篇文章展示了在Matlab的绘图窗口(fi ...
- MATLAB中取整函数(fix, floor, ceil, round)的使用
MATLAB取整函数 1)fix(x) : 截尾取整. >> fix( [3.12 -3.12]) ans = 3 -3(2)floor(x):不超过x 的最大整数.(高斯取整) & ...
随机推荐
- Node中间层浅认知
Node中间层允许前端来做网站路由.页面渲染.SEO优化,对以往从来不接触这些内容的前端选手来说,正是锻炼我们网站架构的好机会.另外,这也是一次深入了解Node的好机会,准备好迎接即将到来的前端工程化 ...
- HDU - 4548-美素数 (欧拉素数筛+打表)
小明对数的研究比较热爱,一谈到数,脑子里就涌现出好多数的问题,今天,小明想考考你对素数的认识. 问题是这样的:一个十进制数,如果是素数,而且它的各位数字和也是素数,则称之为"美素数&quo ...
- Spark应用开发-关联分析
在机器学习中,常用的主题有分类,回归,聚类和关联分析.而关联分析,在实际中的应用场景,有部分是用于商品零售的分析.在Spark中有相应的案例 在关联分析中,有一些概念要熟悉. 频繁项集,关联规则,支持 ...
- 跟着尚硅谷系统学习Docker-【day08】
day08-20200723 p32.docker 安装redis [ docker pull redis] [docker run -p 6397:6397 -v /tmp/mydocker ...
- Oracle SQL Developer中查看解释计划Explain Plan的两种方法
方法一: 比如要查看解释计划的SQL是:select * from hy_emp 那么在输入窗口输入: EXPLAIN PLAN FOR select * from hy_emp 之后执行,输出窗口会 ...
- JS数据类型及常用操作
1.字符串 2.数字类型 3.布尔类型 4.数组类型 5.字典
- 乔悟空-CTF-i春秋-Misc-爆破3
hehe,第一次用这个,开始CTF刷题之旅 2020.09.02 题目地址 学习 题目分析 下边是题目给的php源码,意思就是进行源码审计,分析出能输出flag的条件. 这东西我是真小白,so,积累经 ...
- python3 函数的参数
函数的参数 形参(函数定义时) + 实参(函数调用时) 形参:形式参数 在函数的定义处定义的参数,比如def func(参数1, 参数2, 参数3...) 普通参数(位置参数), 默认参数,普通收集参 ...
- QQDIV失效补救
{"styleId":22,"bgId":3807,"cardId":3807,"renderInfo":{" ...
- VUE3.0发布,自己搞个文档网站
9月19日,尤大神发表了VUE3.0版本的演说,强大且震撼,这两天一直在找网站文档,可能还未被百度收录,未找到文档网站.后来在github上面找到了中文代码. 地址为:https://github.c ...