
spring cloud Hystrix监控面板Hystrix Dashboard和Turbine
我们提到断路器是根据一段时间窗内的请求情况来判断并操作断路器的打开和关闭状态的。而这些请求情况的指标信息都是HystrixCommand和HystrixObservableCommand实例在执行过程中记录的重要度量信息,它们除了Hystrix断路器实现中使用之外,对于系统运维也有非常大的帮助。这些指标信息会以“滚动时间窗”与“桶”结合的方式进行汇总,并在内存中驻留一段时间,以供内部或外部进行查询使用,Hystrix Dashboard就是这些指标内容的消费者之一。
下面我们基于之前的示例来结合Hystrix Dashboard实现Hystrix指标数据的可视化面板,这里我们将用到下之前实现的几个应用,包括:
eureka-server:服务注册中心
eureka-client:服务提供者
eureka-consumer-ribbon-hystrix:使用ribbon和hystrix实现的服务消费者
由于eureka-consumer-ribbon-hystrix项目中的/consumer接口实现使用了@HystrixCommand修饰,所以这个接口的调用情况会被Hystrix记录下来,以用来给断路器和Hystrix Dashboard使用。断路器我们在上一篇中已经介绍过了,下面我们来具体说说Hystrix Dashboard的构建。
动手试一试
在Spring Cloud中构建一个Hystrix Dashboard非常简单,只需要下面四步:
创建一个标准的Spring Boot工程,命名为:hystrix-dashboard。
编辑pom.xml,具体依赖内容如下:
<parent>

    <groupId>org.springframework.cloud</groupId>

    <artifactId>spring-cloud-starter-parent</artifactId>

    <version>Dalston.SR1</version>

    <relativePath />

</parent>

<dependencies>

    <dependency>

        <groupId>org.springframework.cloud</groupId>

        <artifactId>spring-cloud-starter-hystrix</artifactId>

    </dependency>

    <dependency>

        <groupId>org.springframework.cloud</groupId>

        <artifactId>spring-cloud-starter-hystrix-dashboard</artifactId>

    </dependency>

    <dependency>

        <groupId>org.springframework.boot</groupId>

        <artifactId>spring-boot-starter-actuator</artifactId>

    </dependency>

</dependencies>
为应用主类加上
@EnableHystrixDashboard,启用Hystrix Dashboard功能。
@EnableHystrixDashboard

@SpringCloudApplication

public class HystrixDashboardApplication {

    public static void main(String[] args) {

        SpringApplication.run(HystrixDashboardApplication.class, args);

    }

}
根据实际情况修改
application.properties配置文件,比如:选择一个未被占用的端口等,此步非必须。
spring.application.name=hystrix-dashboard

server.port=1301
到这里我们已经完成了基本配置,接下来我们可以启动该应用,并访问:http://localhost:1301/hystrix,我们可以看到如下页面:


这是Hystrix Dashboard的监控首页,该页面中并没有具体的监控信息。从页面的文字内容中我们可以知道,Hystrix Dashboard共支持三种不同的监控方式,依次为:
默认的集群监控:通过URL
http://turbine-hostname:port/turbine.stream开启,实现对默认集群的监控。指定的集群监控:通过URL
http://turbine-hostname:port/turbine.stream?cluster=[clusterName]开启,实现对clusterName集群的监控。单体应用的监控:通过URL
http://hystrix-app:port/hystrix.stream开启,实现对具体某个服务实例的监控。
前两者都对集群的监控,需要整合Turbine才能实现,这部分内容我们将在下一篇中做详细介绍。在本节中,我们主要实现对单个服务实例的监控,所以这里我们先来实现单个服务实例的监控。
既然Hystrix Dashboard监控单实例节点需要通过访问实例的/hystrix.stream接口来实现,自然我们需要为服务实例添加这个端点,而添加该功能的步骤也同样简单,只需要下面两步:
在服务实例
pom.xml中的dependencies节点中新增spring-boot-starter-actuator监控模块以开启监控相关的端点,并确保已经引入断路器的依赖spring-cloud-starter-hystrix:
<dependency>

    <groupId>org.springframework.cloud</groupId>

    <artifactId>spring-cloud-starter-hystrix</artifactId>

</dependency>

<dependency>

    <groupId>org.springframework.boot</groupId>

    <artifactId>spring-boot-starter-actuator</artifactId>

</dependency>
确保在服务实例的主类中已经使用
@EnableCircuitBreaker或@EnableHystrix注解,开启了断路器功能。
到这里已经完成了所有的配置,我们可以在Hystrix Dashboard的首页输入http://localhost:2101/hystrix.stream,已启动对“eureka-consumer-ribbon-hystrix”的监控,点击“Monitor Stream”按钮,此时我们可以看到如下页面:
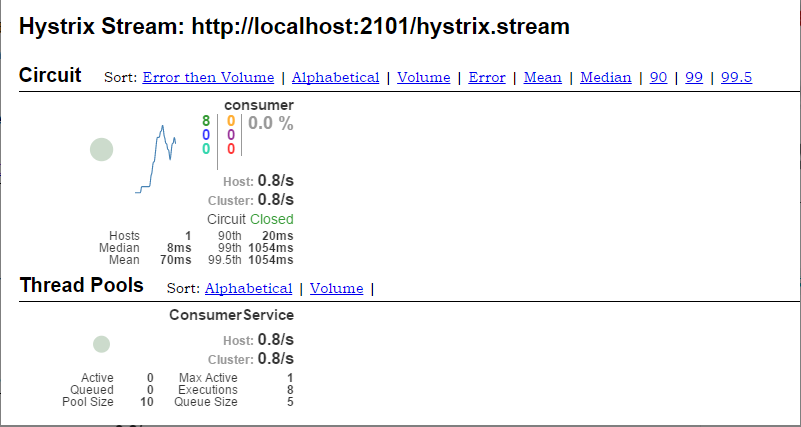

在对该页面介绍前,我们先看看在首页中我们还没有介绍的两外两个参数:
Delay:该参数用来控制服务器上轮询监控信息的延迟时间,默认为2000毫秒,我们可以通过配置该属性来降低客户端的网络和CPU消耗。Title:该参数对应了上图头部标题Hystrix Stream之后的内容,默认会使用具体监控实例的URL,我们可以通过配置该信息来展示更合适的标题。
回到监控页面,我们来详细说说其中各元素的具体含义:
我们可以在监控信息的左上部分找到两个重要的图形信息:一个实心圆和一条曲线。
实心圆:共有两种含义。它通过颜色的变化代表了实例的健康程度,如下图所示,它的健康度从绿色、黄色、橙色、红色递减。该实心圆除了颜色的变化之外,它的大小也会根据实例的请求流量发生变化,流量越大该实心圆就越大。所以通过该实心圆的展示,我们就可以在大量的实例中快速的发现故障实例和高压力实例。

曲线:用来记录2分钟内流量的相对变化,我们可以通过它来观察到流量的上升和下降趋势。
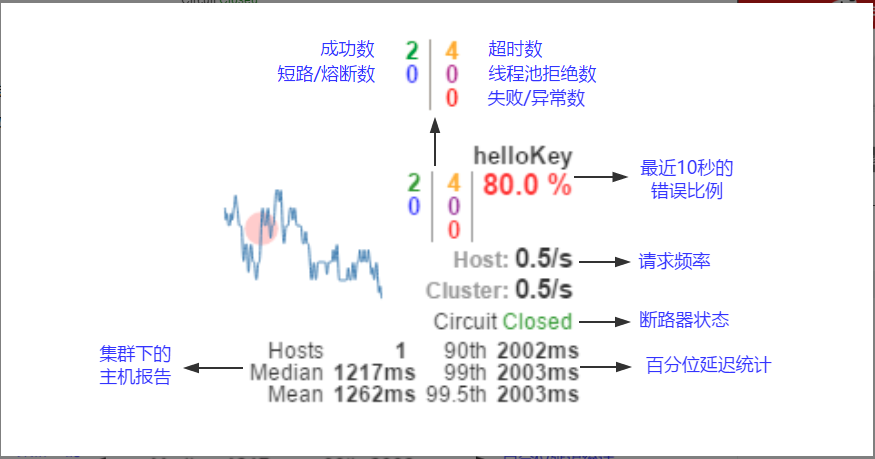
其他一些数量指标如下图所示:

2. 利用Turbine在一个Dashboard上监控多个流
以上例子只能监控一个,要同时监控多个流怎么办? 答案是, 可以单独做一个Turbine服务,专门监控所有断路器状态,从而掌握整个系统中所有微服务的状态。下面我们就来创建一个Turbine服务,来监控我们之前做的Feign服务和Ribbon服务
1). 创建一个maven工程, 在pox.xml添加以下依赖

 1         <dependency>

 2             <groupId>org.springframework.cloud</groupId>

 3             <artifactId>spring-cloud-starter-turbine</artifactId>

 4         </dependency>

 5         <dependency>

 6             <groupId>org.springframework.cloud</groupId>

 7             <artifactId>spring-cloud-netflix-turbine</artifactId>

 8         </dependency>

 9         <dependency>

10             <groupId>org.springframework.boot</groupId>

11             <artifactId>spring-boot-starter-actuator</artifactId>

12         </dependency>

13         <dependency>

14             <groupId>org.springframework.cloud</groupId>

15             <artifactId>spring-cloud-starter-hystrix-dashboard</artifactId>

16         </dependency>
整个个pox.xml文件如下:
 1 <?xml version="1.0" encoding="UTF-8"?>

 2 <project xmlns="http://maven.apache.org/POM/4.0.0"

 3          xmlns:xsi="http://www.w3.org/2001/XMLSchema-instance"

 4          xsi:schemaLocation="http://maven.apache.org/POM/4.0.0 http://maven.apache.org/xsd/maven-4.0.0.xsd">

 5     <modelVersion>4.0.0</modelVersion>

 6     <groupId>cm.chry</groupId>

 7     <artifactId>spring.helloworld.turbine.service</artifactId>

 8     <version>0.0.1-SNAPSHOT</version>

 9     <name>spring.helloworld.turbine.service</name>

10     <description>Turbine service demo</description>

11     <parent>

12         <groupId>org.springframework.boot</groupId>

13         <artifactId>spring-boot-starter-parent</artifactId>

14         <version>1.5.3.RELEASE</version>

15         <relativePath/> <!-- lookup parent from repository -->

16     </parent>

17

18     <properties>

19         <project.build.sourceEncoding>UTF-8</project.build.sourceEncoding>

20         <project.reporting.outputEncoding>UTF-8</project.reporting.outputEncoding>

21         <java.version>1.8</java.version>

22     </properties>

23

24     <dependencies>

25         <dependency>

26             <groupId>org.springframework.cloud</groupId>

27             <artifactId>spring-cloud-starter-eureka</artifactId>

28         </dependency>

29         <dependency>

30             <groupId>org.springframework.boot</groupId>

31             <artifactId>spring-boot-starter-web</artifactId>

32         </dependency>

33         <dependency>

34             <groupId>org.springframework.cloud</groupId>

35             <artifactId>spring-cloud-starter-turbine</artifactId>

36         </dependency>

37         <dependency>

38             <groupId>org.springframework.cloud</groupId>

39             <artifactId>spring-cloud-netflix-turbine</artifactId>

40         </dependency>

41         <dependency>

42             <groupId>org.springframework.boot</groupId>

43             <artifactId>spring-boot-starter-actuator</artifactId>

44         </dependency>

45         <dependency>

46             <groupId>org.springframework.cloud</groupId>

47             <artifactId>spring-cloud-starter-hystrix-dashboard</artifactId>

48         </dependency>

49         <dependency>

50             <groupId>org.springframework.boot</groupId>

51             <artifactId>spring-boot-starter-test</artifactId>

52             <scope>test</scope>

53         </dependency>

54     </dependencies>

55

56     <dependencyManagement>

57         <dependencies>

58             <dependency>

59                 <groupId>org.springframework.cloud</groupId>

60                 <artifactId>spring-cloud-dependencies</artifactId>

61                 <version>Dalston.RC1</version>

62                 <type>pom</type>

63                 <scope>import</scope>

64             </dependency>

65         </dependencies>

66     </dependencyManagement>

67

68     <build>

69         <plugins>

70             <plugin>

71                 <groupId>org.springframework.boot</groupId>

72                 <artifactId>spring-boot-maven-plugin</artifactId>

73             </plugin>

74         </plugins>

75     </build>

76

77     <repositories>

78         <repository>

79             <id>spring-milestones</id>

80             <name>Spring Milestones</name>

81             <url>https://repo.spring.io/milestone</url>

82             <snapshots>

83                 <enabled>false</enabled>

84             </snapshots>

85         </repository>

86     </repositories>

87 </project>
2). 创建Turbine Dashboard启动类:
用@EnableHystrixDashboard和@EnableTurbine修饰主类, 分别用于支持Hystrix Dashboard和Turbine
 1 package spring.helloworld.turbine.service;

 2

 3 import org.springframework.boot.SpringApplication;

 4 import org.springframework.boot.autoconfigure.SpringBootApplication;

 5 import org.springframework.cloud.netflix.hystrix.dashboard.EnableHystrixDashboard;

 6 import org.springframework.cloud.netflix.turbine.EnableTurbine;

 7

 8 @SpringBootApplication

 9 @EnableHystrixDashboard

10 @EnableTurbine

11 public class DashboardApplication {

12

13     public static void main(String[] args) {

14         SpringApplication.run(DashboardApplication.class, args);

15     }

16 }
3). 在application.yml中配置turbine参数
 1 eureka:

 2     client:

 3         serviceUrl:

 4             defaultZone: http://localhost:8761/eureka/

 5 server:

 6     port: 8903

 7 spring:

 8     application:

 9         name: hystrix-dashboard-turbine

10 turbine:

11     appConfig: service-feign, service-ribbon

12     aggregator:

13         clusterConfig: default

14     clusterNameExpression: new String("default")
turbine.appConfig定义了要监控的服务,这里是我们在前面章节创建的service-feign和sercice-ribbon; aggregator.clusterConfig定义了聚合方式, 此处为default.
turbine.appConfig :配置Eureka中的serviceId列表,表明监控哪些服务
turbine.aggregator.clusterConfig :指定聚合哪些集群,多个使用”,”分割,默认为default。可使用http://.../turbine.stream?cluster={clusterConfig之一}访问
turbine.clusterNameExpression :指定集群名称,可以是三种类型的值
- 默认表达式为appName;此时turbine.aggregator.clusterConfig需要配置想要监控的应用名称;
- 当为default时,turbine.aggregator.clusterConfig可以不写,因为默认就是default;
- 当为metadata[‘cluster’]时,假设想要监控的应用配置了eureka.instance.metadata-map.cluster: ABC,则需要配置,同时turbine.aggregator.clusterConfig: ABC
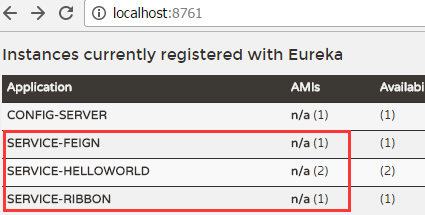
4). 依次启动eureka服务, 2个Helloworld服务, Feign服务,ribbon服务和刚创建turbine服务。从eureka服务中我们可以看到
5)通过Turbine服务访问HystrixDashborad, http:localhost:8903/hystrix
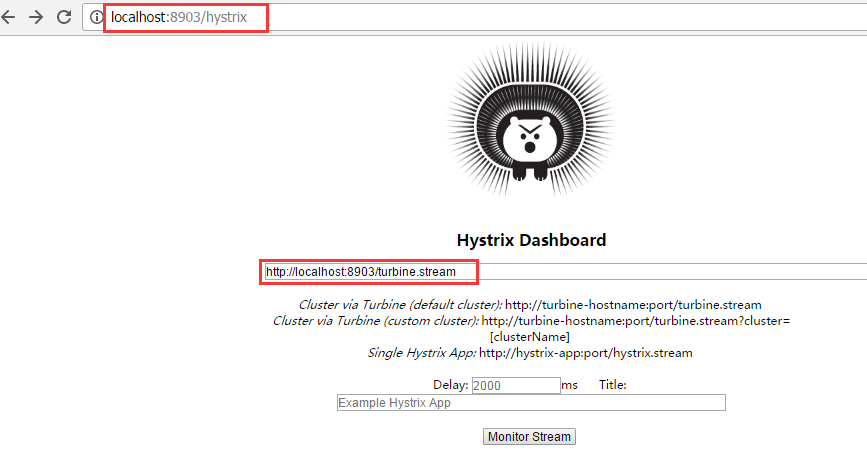
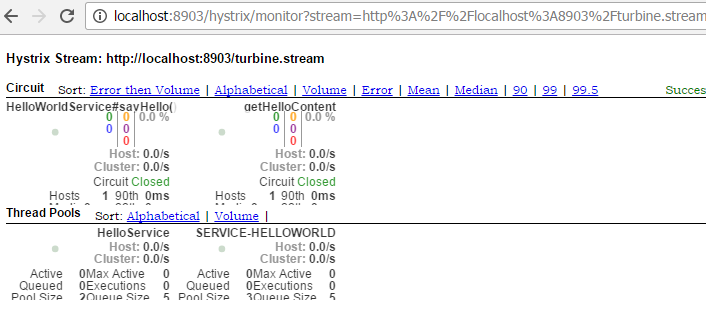
监控流的URL填http://localhost:8903/turbine.stream, 点击monitor stream, 进入监控页面, 随便刷新下feign和ribbon服务(http://localhost:8902/hello和http://localhost:8901), 可以看到监控页面的变化。如下图, 两个服务的监控都会显示在dashboard上
spring cloud Hystrix监控面板Hystrix Dashboard和Turbine的更多相关文章
- 白话SpringCloud | 第六章:Hystrix监控面板及数据聚合(Turbine)
前言 前面一章,我们讲解了如何整合Hystrix.而在实际情况下,使用了Hystrix的同时,还会对其进行实时的数据监控,反馈各类指标数据.今天我们就将讲解下Hystrix Dashboard和Tur ...
- Spring Cloud(五):Hystrix 监控面板【Finchley 版】
Spring Cloud(五):Hystrix 监控面板[Finchley 版] 发表于 2018-04-16 | 更新于 2018-05-10 | 在上一篇 Hystrix 的介绍中,我们提到 ...
- Spring Cloud架构教程 (一)Hystrix监控面板
下面我们基于之前的示例来结合Hystrix Dashboard实现Hystrix指标数据的可视化面板,这里我们将用到下之前实现的几个应用,包括: eureka-server:服务注册中心 eureka ...
- Spring Cloud第八篇 | Hystrix集群监控Turbine
本文是Spring Cloud专栏的第八篇文章,了解前七篇文章内容有助于更好的理解本文: Spring Cloud第一篇 | Spring Cloud前言及其常用组件介绍概览 Spring Clo ...
- spring cloud 2.x版本 Hystrix Dashboard断路器教程
前言 本文采用Spring cloud本文为2.1.8RELEASE,version=Greenwich.SR3 本文基于前两篇文章eureka-server.eureka-client.eureka ...
- 【Spring Cloud笔记】 断路器-hystrix
在微服务架构中,一个微服务的超时失败可能导致瀑布式连锁反映,Spring Cloud Netflix 的断路器Hystrix通过自主反馈,防止了这种情况发生.下面介绍简单的断路器使用方法. [step ...
- Spring Cloud第六篇 | Hystrix仪表盘监控Hystrix Dashboard
本文是Spring Cloud专栏的第六篇文章,了解前五篇文章内容有助于更好的理解本文: Spring Cloud第一篇 | Spring Cloud前言及其常用组件介绍概览 Spring Cloud ...
- spring cloud微服务快速教程之(四)熔断器(Hystrix)及其工具(Dashboard、Turbine)
0-为什么需要熔断器 在分布式系统中,各个服务相互调用相互依赖,如果某个服务挂了,很可能导致其他调用它的一连串服务也挂掉或者在不断等待中耗尽服务器资源,这种现象称之为雪崩效应: 未来防止系统雪崩,熔断 ...
- SpringCloud断路器监控面板——Hystrix Dashboard
一.简介 Hystrix Dashboard是Hystrix的一个组件,Hystrix Dashboard提供一个断路器的监控面板,可以使我们更好的监控服务和集群的状态,仅仅使用Hystrix Das ...
随机推荐
- C/C++ assert()函数用法总结
1. 简介 assert宏的原型定义在<assert.h>中,其作用是如果它的条件返回错误,则终止程序执行. 原型定义: #include <assert.h>void ass ...
- linux添加swap分区【转】
概述 添加交换分区主要是因为安装oracle时碰到交换分区太小时无法安装的情况,这时候就需要添加交换分区了. 操作简介 增加swap分区方法: 1.新建磁盘分区作为swap分区 2.用文件作为swap ...
- 设计模式C++学习笔记之十八(Visitor访问者模式)
18.1.解释 概念:表示一个作用于某对象结构中的各元素的操作.它使你可以在不改变各元素的类的前提下定义作用于这些元素的新操作. main(),客户 IVisitor,访问者接口 CBaseVis ...
- svn更新出现冲突的解决方法
Conflict discovered in '/Users/apple/EtaxiAppServer/common/src/com/yaotaxi/db/MongoDBHelper.java'. S ...
- 微信小程序-动态设置背景色navigationBarBackgroundColor的值
查看API: wx.setNavigationBarColor(OBJECT) 代码: wx.setNavigationBarColor({ frontColor: '#ffffff', // 必写项 ...
- canvas - 简单画板
截图: Demo:Demo 上代码:. <!DOCTYPE html> <html lang="en"> <head> <meta cha ...
- RS485 通信接收时丢失0x11等数据
RS485通信接收方,丢弃掉了值为 0x11 的数据. 怀疑 0x11 被转义,没有按照原始数据接收, 查看ASCII码对应表 0x11 代表 “本文结束”, 因此丢弃是有可能的. 要想接收原始数据而 ...
- zabbix常用的python类api
zabbix自带api #!/usr/bin/python #coding:utf-8 import requests import json url = "http://192.168.9 ...
- 压缩JS的eclipse插件
主页:http://jscompressor.oncereply.me/ Update site: http://jscompressor.oncereply.me/update/
- encoding and Endian
Unicode, Code Point is the value of evry character in Unicode table(int,long,ll) Unicode defines a c ...