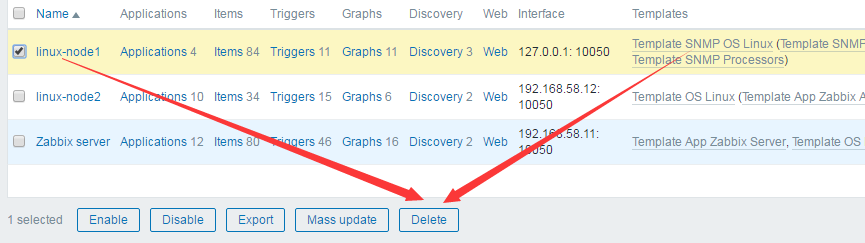
学习zabbix(六)
实验环境
实验用2到2台机器,实验所用机器系统环境如下,可以看到2台机器的主机名和IP地址
|
1
2
3
4
5
6
7
8
9
10
|
[root@linux-node1 ~]# cat /etc/redhat-release CentOS Linux release 7.1.1503 (Core) [root@linux-node1 ~]# cat /etc/hosts127.0.0.1 localhost localhost.localdomain localhost4 localhost4.localdomain4::1 localhost localhost.localdomain localhost6 localhost6.localdomain6192.168.58.11 linux-node1 linux-node1.nmap.com192.168.58.12 linux-node2 linux-node2.nmap.com[root@linux-node1 ~]# hostnamelinux-node1.nmap.com[root@linux-node1 ~]# |
nginx自带的监控介绍
先学习下nginx自带的的状态监控
以下软件包是编译安装nginx需要的包
|
1
2
3
4
5
6
7
8
9
10
11
12
13
14
|
[root@linux-node1 ~]# yum install -y glibc gcc-c++ pcre-devel gcc openssl-develLoaded plugins: fastestmirrorLoading mirror speeds from cached hostfile * base: mirrors.zju.edu.cn * epel: mirrors.tuna.tsinghua.edu.cn * extras: mirrors.aliyun.com * updates: mirrors.aliyun.comPackage glibc-2.17-157.el7_3.1.x86_64 already installed and latest versionPackage gcc-c++-4.8.5-11.el7.x86_64 already installed and latest versionPackage pcre-devel-8.32-15.el7_2.1.x86_64 already installed and latest versionPackage gcc-4.8.5-11.el7.x86_64 already installed and latest versionPackage 1:openssl-devel-1.0.1e-60.el7_3.1.x86_64 already installed and latest versionNothing to do[root@linux-node1 ~]# |
下载nginx稳定版并解压
|
1
2
3
4
5
6
7
8
9
10
11
12
13
14
15
16
17
|
[root@linux-node1 ~]# cd /usr/local/src/[root@linux-node1 src]# ls[root@linux-node1 src]# wget http://nginx.org/download/nginx-1.10.3.tar.gz--2017-03-19 18:04:23-- http://nginx.org/download/nginx-1.10.3.tar.gzResolving nginx.org (nginx.org)... 95.211.80.227, 206.251.255.63Connecting to nginx.org (nginx.org)|95.211.80.227|:80... connected.HTTP request sent, awaiting response... 200 OKLength: 911509 (890K) [application/octet-stream]Saving to: ‘nginx-1.10.3.tar.gz’100%[==================================================>] 911,509 303KB/s in 2.9s 2017-03-19 18:04:27 (303 KB/s) - ‘nginx-1.10.3.tar.gz’ saved [911509/911509][root@linux-node1 src]# tar xfz nginx-1.10.3.tar.gz [root@linux-node1 src]# cd nginx-1.10.3[root@linux-node1 nginx-1.10.3]# |
新建一个用户www,用于以普通用户运行nginx ;配置,生成Makefile文件
|
1
2
3
4
5
|
[root@linux-node1 nginx-1.10.3]# useradd -s /sbin/nologin -M www[root@linux-node1 nginx-1.10.3]# ./configure --prefix=/usr/local/nginx-1.10.3 \> --user=www --group=www \> --with-http_ssl_module \> --with-http_stub_status_module |
配置完毕,pcre是它默认加的,很多人编译使用--with-pcre 其实使用系统的就够了
|
1
2
3
4
5
6
7
8
9
10
11
12
13
14
15
16
17
18
19
20
21
22
23
24
25
26
27
28
29
|
checking for getaddrinfo() ... foundchecking for PCRE library ... foundchecking for PCRE JIT support ... foundchecking for OpenSSL library ... foundchecking for zlib library ... foundcreating objs/MakefileConfiguration summary + using system PCRE library + using system OpenSSL library + md5: using OpenSSL library + sha1: using OpenSSL library + using system zlib library nginx path prefix: "/usr/local/nginx-1.10.3" nginx binary file: "/usr/local/nginx-1.10.3/sbin/nginx" nginx modules path: "/usr/local/nginx-1.10.3/modules" nginx configuration prefix: "/usr/local/nginx-1.10.3/conf" nginx configuration file: "/usr/local/nginx-1.10.3/conf/nginx.conf" nginx pid file: "/usr/local/nginx-1.10.3/logs/nginx.pid" nginx error log file: "/usr/local/nginx-1.10.3/logs/error.log" nginx http access log file: "/usr/local/nginx-1.10.3/logs/access.log" nginx http client request body temporary files: "client_body_temp" nginx http proxy temporary files: "proxy_temp" nginx http fastcgi temporary files: "fastcgi_temp" nginx http uwsgi temporary files: "uwsgi_temp" nginx http scgi temporary files: "scgi_temp"[root@linux-node1 nginx-1.10.3]# |
编译和安装
|
1
|
[root@linux-node1 nginx-1.10.3]# make && make install |
以上安装完毕,安装结尾部分如下
|
1
2
3
4
5
6
7
8
9
10
11
12
13
|
cp conf/nginx.conf '/usr/local/nginx-1.10.3/conf/nginx.conf.default'test -d '/usr/local/nginx-1.10.3/logs' \ || mkdir -p '/usr/local/nginx-1.10.3/logs'test -d '/usr/local/nginx-1.10.3/logs' \ || mkdir -p '/usr/local/nginx-1.10.3/logs'test -d '/usr/local/nginx-1.10.3/html' \ || cp -R html '/usr/local/nginx-1.10.3'test -d '/usr/local/nginx-1.10.3/logs' \ || mkdir -p '/usr/local/nginx-1.10.3/logs'make[1]: Leaving directory `/usr/local/src/nginx-1.10.3'[root@linux-node1 nginx-1.10.3]# echo $?0[root@linux-node1 nginx-1.10.3]# |
做软链接
|
1
2
3
|
[root@linux-node1 nginx-1.10.3]# cd[root@linux-node1 ~]# ln -s /usr/local/nginx-1.10.3/ /usr/local/nginx[root@linux-node1 ~]# |
怎么监控nginx,可以搜索一些做监控的产品他们做的文档,比较好,网站上很多人写的博客其实有的有错误,监控宝这种即使出现错误也不会太大
搜索监控宝的nginx相关的wiki
http://www.jiankongbao.com/search.php?q=nginx

http://wiki.jiankongbao.com/doku.php/%E6%96%87%E6%A1%A3:%E5%AE%89%E5%85%A8%E6%8C%87%E5%BC%95#nginx_监控
需要注意的是,Nginx默认安装不包含状态模块stub_status,所以,在编译Nginx的时候,需要添加以下参数:
|
1
|
--with-http_stub_status_module |
一旦包含stub_status模块后,我们就可以在配置文件nginx.conf中开启状态页面:
|
1
2
3
4
5
6
7
8
9
10
11
12
13
14
15
16
|
http { server { listen 80; server_name localhost; location / { root html; index index.html index.htm; } location /nginx-status { stub_status on; access_log off; } }} |
以上配置文件中,我们实际增加的部分是:
|
1
2
3
4
|
location /nginx-status { stub_status on; access_log off; } |
同样,假如Nginx所在服务器的IP为10.0.0.1,同时指向它的域名为www.domain.com,这样一来,Nginx的状态页面便是:
|
1
|
http://10.0.0.1/nginx-status |
或者
|
1
|
http://www.domain.com/nginx-status |
同样,建议您将以上示例中的nginx-status修改为其它字符串。
另外,Nginx的stub_status也支持授权IP的配置,您可以参考Nginx的手册,监控宝提供的服务监控点IP地址为:
开始操作修改nginx.conf
|
1
2
|
[root@linux-node1 ~]# cd /usr/local/nginx/conf/[root@linux-node1 conf]# vim nginx.conf |
编辑如下,顺便加上访问控制

修改完毕,检测语法,启动,检查
|
1
2
3
4
5
6
7
8
9
10
|
[root@linux-node1 conf]# vim nginx.conf[root@linux-node1 conf]# /usr/local/nginx/sbin/nginx -tnginx: the configuration file /usr/local/nginx-1.10.3/conf/nginx.conf syntax is oknginx: configuration file /usr/local/nginx-1.10.3/conf/nginx.conf test is successful[root@linux-node1 conf]# /usr/local/nginx/sbin/nginx [root@linux-node1 conf]# lsof -i:80COMMAND PID USER FD TYPE DEVICE SIZE/OFF NODE NAMEnginx 10245 root 6u IPv4 157419 0t0 TCP *:http (LISTEN)nginx 10246 www 6u IPv4 157419 0t0 TCP *:http (LISTEN)[root@linux-node1 conf]# |
网页上查看

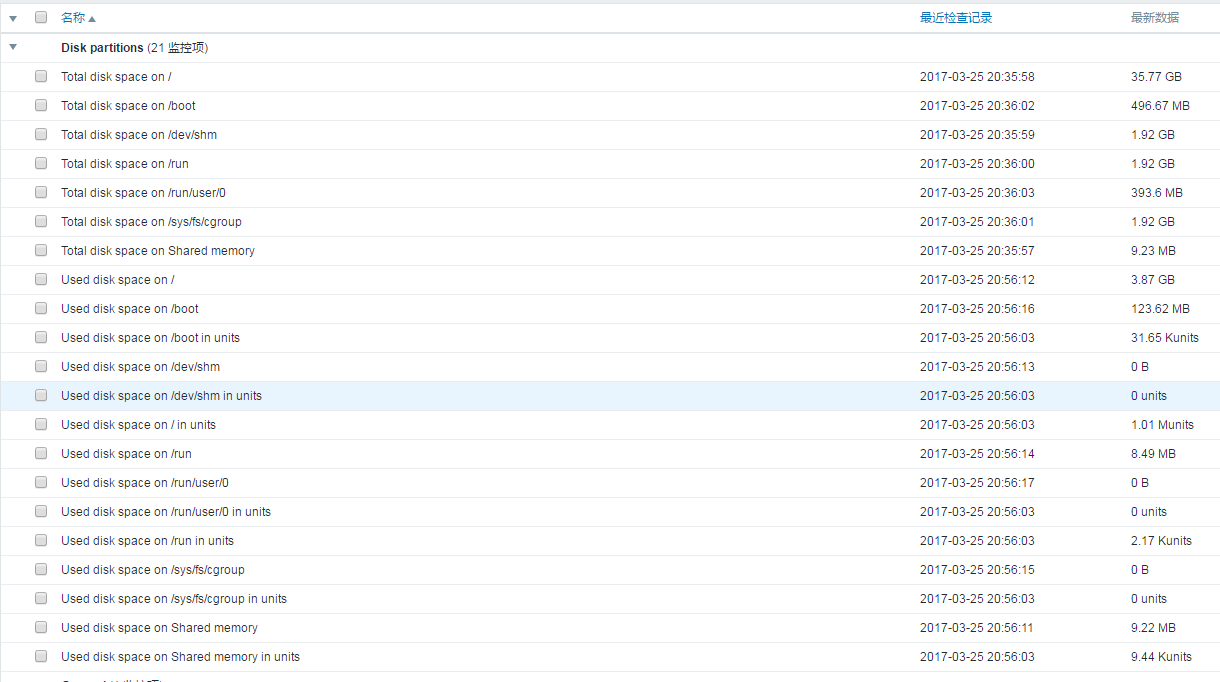
关于状态页面的解释
Active connections: 4
server accepts handled requests
4 4 23
Reading: 0 Writing: 3 Waiting: 0
Active connections:对后端发起的活动连接数。
Server accepts handled requests:Nginx总共处理了4个连接,成功创建4次握手(证明中间没有失败的),总共处理了23个请求。
Reading:Nginx 读取到客户端的Header信息数。
Writing:Nginx 返回给客户端的Header信息数。
Waiting:开启keep-alive的情况下,这个值等于 active – (reading + writing),意思就是Nginx已经处理完成,正在等候下一次请求指令的驻留连接。
监控要做的事,最基础的部分如下:
采集,存储,展示,告警
nagios和zabbix对于一些大量主机需要监控的场景时,nagios不如zabbix
nagios监控就有瓶颈了。因为server端主动访问,1000台就有瓶颈了
zabbix主动模式完全解决,顶多就是server端的读写压力
安装zabbix3.0
在安装之前请确保防火墙以及selinux关闭,并做好时间同步
1.1、yum源配置
|
1
|
rpm -ivh http://mirrors.aliyun.com/zabbix/zabbix/3.0/rhel/7/x86_64/zabbix-release-3.0-1.el7.noarch.rpm |
1.2、安装相关软件
zabbix把数据放到了库里,它支持mysql,centos7之后mysql默认是mariadb
|
1
|
yum install zabbix-server zabbix-web zabbix-server-mysql zabbix-web-mysql mariadb-server mariadb zabbix-agent -y |
zabbix运行的web容器是apache,它默认把apache作为依赖安装上了
安装完毕,留意下版本
|
1
2
3
4
5
6
7
8
9
10
11
12
13
14
15
16
|
[root@linux-node1 ~]# yum install zabbix-server zabbix-web zabbix-server-mysql zabbix-web-mysql mariadb-server mariadb zabbix-agent -yLoaded plugins: fastestmirrorLoading mirror speeds from cached hostfile * base: mirrors.zju.edu.cn * epel: mirrors.tuna.tsinghua.edu.cn * extras: mirrors.aliyun.com * updates: mirrors.aliyun.comPackage zabbix-server-mysql-3.0.8-2.el7.x86_64 already installed and latest versionPackage zabbix-web-3.0.8-2.el7.noarch already installed and latest versionPackage zabbix-server-mysql-3.0.8-2.el7.x86_64 already installed and latest versionPackage zabbix-web-mysql-3.0.8-2.el7.noarch already installed and latest versionPackage 1:mariadb-server-5.5.52-1.el7.x86_64 already installed and latest versionPackage 1:mariadb-5.5.52-1.el7.x86_64 already installed and latest versionPackage zabbix-agent-3.0.8-2.el7.x86_64 already installed and latest versionNothing to do[root@linux-node1 ~]# |
1.3、修改PHP时区配置

由于注释里带#,这里's###g' 改成's@@@g' 结构替换
|
1
|
sed -i 's@# php_value date.timezone Europe/Riga@php_value date.timezone Asia/Shanghai@g' /etc/httpd/conf.d/zabbix.conf |
替换完毕。

二、数据库配置
Centos7上MySQL已经变成了mariadb。
2.1、启动数据库
|
1
|
systemctl start mariadb |
2.2、创建zabbix所用的数据库及用户
|
1
2
3
4
|
mysqlcreate database zabbix character set utf8 collate utf8_bin;grant all on zabbix.* to zabbix@'localhost' identified by 'zabbix';exit |
导入数据
zcat命令用于不真正解压缩文件,就能显示压缩包中文件的内容的场合。
|
1
2
3
4
5
|
[root@linux-node1 ~]# cd /usr/share/doc/zabbix-server-mysql-3.0.8/[root@linux-node1 zabbix-server-mysql-3.0.8]# lsAUTHORS ChangeLog COPYING create.sql.gz NEWS README[root@linux-node1 zabbix-server-mysql-3.0.8]# zcat create.sql.gz | mysql -uzabbix -pzabbix zabbix[root@linux-node1 zabbix-server-mysql-3.0.8]# |
2.3、修改zabbix配置
|
1
|
vim /etc/zabbix/zabbix_server.conf |
取消下面注释,并修改成正确值
DBHost=localhost #数据库所在主机
DBName=zabbix #数据库名
DBUser=zabbix #数据库用户
DBPassword=zabbix #数据库密码
2.4、启动zabbix及http
遇到问题,zabbix-server启动失败,httpd启动成功
|
1
2
3
4
5
6
7
8
9
10
11
12
13
14
15
16
17
18
19
20
21
22
|
[root@linux-node1 ~]# systemctl start zabbix-serverJob for zabbix-server.service failed because a fatal signal was delivered to the control process. See "systemctl status zabbix-server.service" and "journalctl -xe" for details.[root@linux-node1 ~]# systemctl start httpd[root@linux-node1 ~]# getenforceDisabled[root@linux-node1 ~]# journalctl -xe-- Support: http://lists.freedesktop.org/mailman/listinfo/systemd-devel-- -- Unit zabbix-server.service has begun starting up.Mar 19 19:12:59 linux-node1.nmap.com kernel: zabbix_server[11200]: segfault at 18 ip 00007fd7Mar 19 19:12:59 linux-node1.nmap.com systemd[1]: zabbix-server.service: control process exiteMar 19 19:13:01 linux-node1.nmap.com systemd[1]: Failed to start Zabbix Server.-- Subject: Unit zabbix-server.service has failed-- Defined-By: systemd-- Support: http://lists.freedesktop.org/mailman/listinfo/systemd-devel-- -- Unit zabbix-server.service has failed.-- -- The result is failed.Mar 19 19:13:01 linux-node1.nmap.com systemd[1]: Unit zabbix-server.service entered failed stMar 19 19:13:01 linux-node1.nmap.com systemd[1]: zabbix-server.service failed.[root@linux-node1 ~]# |
升级 trousers之后,启动zabbix-server成功(系统版本centos7-1503)
|
1
2
3
4
5
6
7
8
9
10
11
|
[root@linux-node1 ~]# yum update trousersLoaded plugins: fastestmirrorLoading mirror speeds from cached hostfile * base: mirrors.zju.edu.cn * epel: mirror.premi.st * extras: mirrors.aliyun.com * updates: mirrors.aliyun.comResolving Dependencies--> Running transaction check---> Package trousers.x86_64 0:0.3.11.2-3.el7 will be updated---> Package trousers.x86_64 0:0.3.13-1.el7 will be an update |
三、通过浏览器配置zabbix-server
浏览器里输入下面内容,通过页面安装配置
http://192.168.58.11/zabbix
一切OK
密码也是zabbix

name这里可以自定义,它出出现在登录后的右上角


其实以上步骤就是配置了下面文件
点击Finish出现登录界面,用户名和密码默认是Admin/zabbix

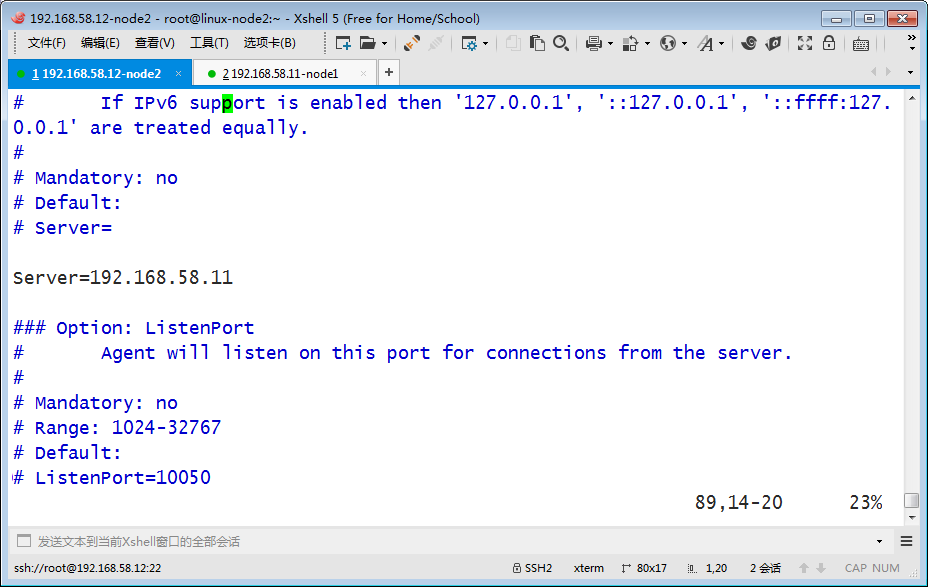
启动zabbix-agent,它默认监听10050端口
zabbix-server默认监听10051端口
|
1
2
3
4
5
6
7
8
9
10
11
12
13
14
15
16
17
18
|
[root@linux-node1 ~]# systemctl start zabbix-agent[root@linux-node1 ~]# netstat -lntpActive Internet connections (only servers)Proto Recv-Q Send-Q Local Address Foreign Address State PID/Program name tcp 0 0 0.0.0.0:111 0.0.0.0:* LISTEN 1/systemd tcp 0 0 192.168.122.1:53 0.0.0.0:* LISTEN 1104/dnsmasq tcp 0 0 0.0.0.0:22 0.0.0.0:* LISTEN 922/sshd tcp 0 0 127.0.0.1:25 0.0.0.0:* LISTEN 1044/master tcp 0 0 0.0.0.0:10050 0.0.0.0:* LISTEN 1793/zabbix_agentd tcp 0 0 0.0.0.0:10051 0.0.0.0:* LISTEN 1316/zabbix_server tcp 0 0 0.0.0.0:3306 0.0.0.0:* LISTEN 1584/mysqld tcp6 0 0 :::111 :::* LISTEN 1/systemd tcp6 0 0 :::80 :::* LISTEN 1708/httpd tcp6 0 0 :::22 :::* LISTEN 922/sshd tcp6 0 0 ::1:25 :::* LISTEN 1044/master tcp6 0 0 :::10050 :::* LISTEN 1793/zabbix_agentd tcp6 0 0 :::10051 :::* LISTEN 1316/zabbix_server [root@linux-node1 ~]# |
zabbix页面登录和介绍
登录成功的界面

启用此监控


它是php-gd绘制的


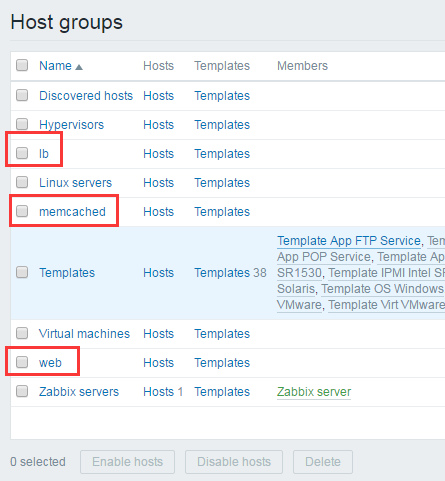
练习创建3个组:web,memcached,lb


zabbix也支持snmp,这台机器开启了snmp,这里我们就用snmp来监控

snmp这里由于是本机监控本机可以写127.0.0.1
其实推荐写成真实IP


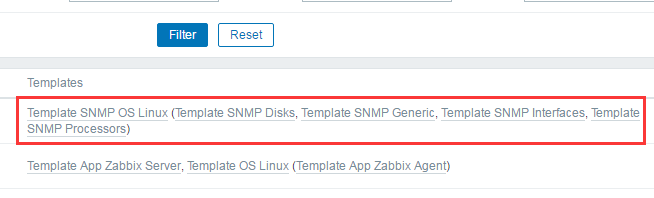
模板这里添加snmp的模板


宏就是下面这个值
|
1
2
3
|
[root@linux-node1 ~]# cat /etc/snmp/snmpd.confrocommunity nmap 192.168.58.11[root@linux-node1 ~]# |
输入如下内容

添加完毕,看到有很多模板显示,其实括号里的都是模板的链接
如果snmp没启动,需要先启动它
|
1
2
3
4
5
6
|
[root@linux-node1 ~]# systemctl enable snmpdCreated symlink from /etc/systemd/system/multi-user.target.wants/snmpd.service to /usr/lib/systemd/system/snmpd.service.[root@linux-node1 ~]# systemctl start snmpd[root@linux-node1 ~]# netstat -luntp | grep 161udp 0 0 0.0.0.0:161 0.0.0.0:* 2549/snmpd [root@linux-node1 ~]# |
页面里查看,snmp监控也成功了

screen是几个图形放一起;2.4需要在configure下面创建;在3.0可以在monitor下创建

|
1
2
3
4
5
6
7
8
9
10
11
|
[root@linux-node1 ~]# cd /usr/local/nginx/conf/[root@linux-node1 conf]# vim nginx.conf[root@linux-node1 conf]# /usr/local/nginx/sbin/nginx -tnginx: the configuration file /usr/local/nginx-1.10.3/conf/nginx.conf syntax is oknginx: configuration file /usr/local/nginx-1.10.3/conf/nginx.conf test is successful[root@linux-node1 conf]# /usr/local/nginx/sbin/nginx [root@linux-node1 conf]# lsof -i:8080COMMAND PID USER FD TYPE DEVICE SIZE/OFF NODE NAMEnginx 2714 root 6u IPv4 35149 0t0 TCP *:webcache (LISTEN)nginx 2715 www 6u IPv4 35149 0t0 TCP *:webcache (LISTEN)[root@linux-node1 conf]# |
先用命令方式获取活动连接数
|
1
2
3
4
5
6
7
8
9
10
11
12
13
14
15
16
17
|
[root@linux-node1 conf]# curl http://192.168.58.11:8080/nginx-statusActive connections: 1 server accepts handled requests 4 4 4 Reading: 0 Writing: 1 Waiting: 0 [root@linux-node1 conf]# curl http://192.168.58.11:8080/nginx-status | grep Active % Total % Received % Xferd Average Speed Time Time Time Current Dload Upload Total Spent Left Speed100 97 100 97 0 0 54525 0 --:--:-- --:--:-- --:--:-- 97000Active connections: 1 [root@linux-node1 conf]# curl -s http://192.168.58.11:8080/nginx-status | grep ActiveActive connections: 1 [root@linux-node1 conf]# curl -s http://192.168.58.11:8080/nginx-status | grep Active |awk '{print $3}'1[root@linux-node1 conf]# curl -s http://192.168.58.11:8080/nginx-status | grep Active |awk '{print $NF}'1[root@linux-node1 conf]# |
vim /etc/zabbix/zabbix_agentd.conf
默认zabbix-agent的配置文件会加载下面目录,因此可以单独新建一个文件,用于存放自定义的key

写一个名叫nginx.conf的配置文件
|
1
2
3
4
5
|
[root@linux-node1 zabbix_agentd.d]# pwd/etc/zabbix/zabbix_agentd.d[root@linux-node1 zabbix_agentd.d]# cat nginx.conf UserParameter=nginx.active,curl -s http://192.168.58.11:8080/nginx-status | grep Active |awk '{print $NF}'[root@linux-node1 zabbix_agentd.d]# |
优化一下,脚本里的命令使用绝对路径
|
1
2
3
4
5
6
|
[root@linux-node1 zabbix_agentd.d]# which curl/usr/bin/curl[root@linux-node1 zabbix_agentd.d]# vim nginx.conf[root@linux-node1 zabbix_agentd.d]# cat nginx.conf UserParameter=nginx.active,/usr/bin/curl -s http://192.168.58.11:8080/nginx-status | grep Active |awk '{print $NF}'[root@linux-node1 zabbix_agentd.d]# |
重启agent,安装zabbix-get工具,它是个测试工具,只有它能获取到了自定义的key的值,才能加入到zabbix-server里。
|
1
2
|
[root@linux-node1 ~]# systemctl restart zabbix-agent[root@linux-node1 ~]# yum install -y zabbix-get |
get一下,发现有问题
|
1
2
3
|
[root@linux-node1 ~]# zabbix_get -s 192.168.58.11 -p 10050 -k"nginx.active"zabbix_get [3070]: Check access restrictions in Zabbix agent configuration[root@linux-node1 ~]# |
因为安装zabbix-agent的时候,Server那里写的是127.0.0.1,agent和server在一台
Server那里要写192.168.58.11
zabbix-get或者这里写127.0.0.1
下面改成192.168.58.11,这里是只允许哪个server的IP访问自己,server这里也支持多Ip

改完重启下agent
|
1
2
3
|
[root@linux-node1 ~]# vim /etc/zabbix/zabbix_agentd.conf [root@linux-node1 ~]# systemctl restart zabbix-agent[root@linux-node1 ~]# |
再次获取,成功
|
1
2
3
|
[root@linux-node1 ~]# zabbix_get -s 192.168.58.11 -p 10050 -k"nginx.active"1[root@linux-node1 ~]# |
网页上这里尽量也改掉

改成如下,否则会报连接故障

总结添加自定义监控项的步骤
1、命令行或脚本先获取成功
2、配置文件里添加用户自定义参数
3、重启zabbix-agent
4、server端使用zabbix_get测试获取
5、web界面创建item
这里还缺最后一步,web页面添加自定义监控项


application这里写个自定义的,它是一组item的集合

创建图形


找到nginx.active


查看图形

手动制造点连接数数据
|
1
2
3
4
5
6
7
8
9
10
11
12
13
14
15
16
17
18
19
20
21
22
23
24
25
26
27
28
29
30
31
32
33
34
35
36
37
38
39
40
41
42
43
44
45
46
47
48
49
50
51
52
53
54
55
56
|
[root@linux-node1 ~]# ab -c 10 -n 100000 http://192.168.58.11:8080/This is ApacheBench, Version 2.3 <$Revision: 1430300 $>Copyright 1996 Adam Twiss, Zeus Technology Ltd, http://www.zeustech.net/Licensed to The Apache Software Foundation, http://www.apache.org/Benchmarking 192.168.58.11 (be patient)Completed 10000 requestsCompleted 20000 requestsCompleted 30000 requestsCompleted 40000 requestsCompleted 50000 requestsCompleted 60000 requestsCompleted 70000 requestsCompleted 80000 requestsCompleted 90000 requestsCompleted 100000 requestsFinished 100000 requestsServer Software: nginx/1.10.3Server Hostname: 192.168.58.11Server Port: 8080Document Path: /Document Length: 612 bytesConcurrency Level: 10Time taken for tests: 8.674 secondsComplete requests: 100000Failed requests: 0Write errors: 0Total transferred: 84500000 bytesHTML transferred: 61200000 bytesRequests per second: 11529.06 [#/sec] (mean)Time per request: 0.867 [ms] (mean)Time per request: 0.087 [ms] (mean, across all concurrent requests)Transfer rate: 9513.73 [Kbytes/sec] receivedConnection Times (ms) min mean[+/-sd] median maxConnect: 0 0 0.2 0 3Processing: 0 1 0.2 1 8Waiting: 0 1 0.2 1 8Total: 0 1 0.2 1 8Percentage of the requests served within a certain time (ms) 50% 1 66% 1 75% 1 80% 1 90% 1 95% 1 98% 1 99% 2 100% 8 (longest request)[root@linux-node1 ~]# |
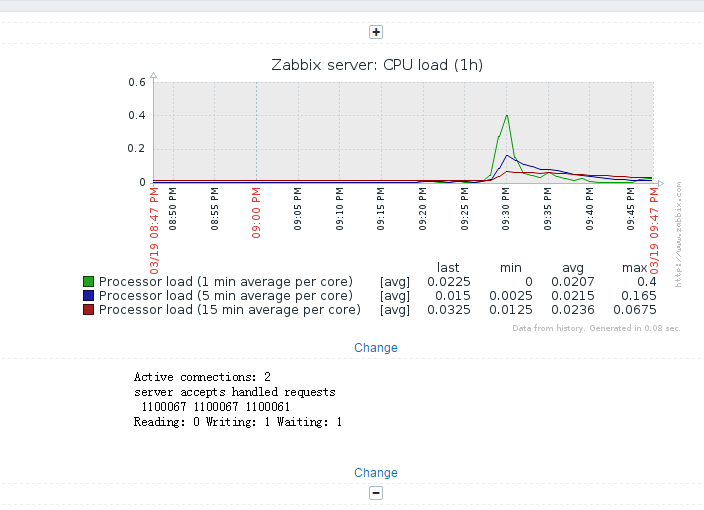
查看图形数据
以堆叠方式显示
堆叠方式就是这种
创建自定义的screen

把nginx.active这个图形加上去

把相关联的加到一个screen里面

其实可以显示很多,比如文本

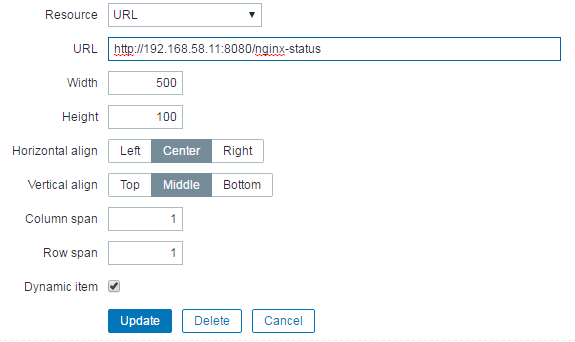
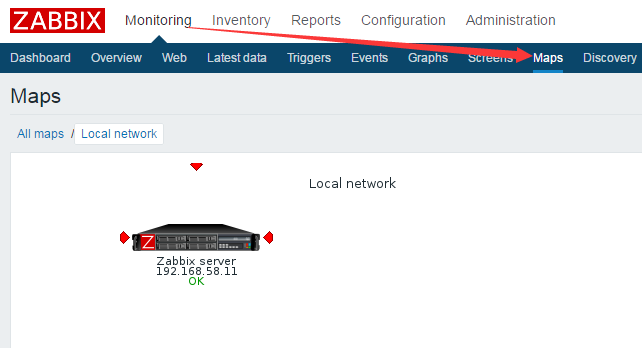
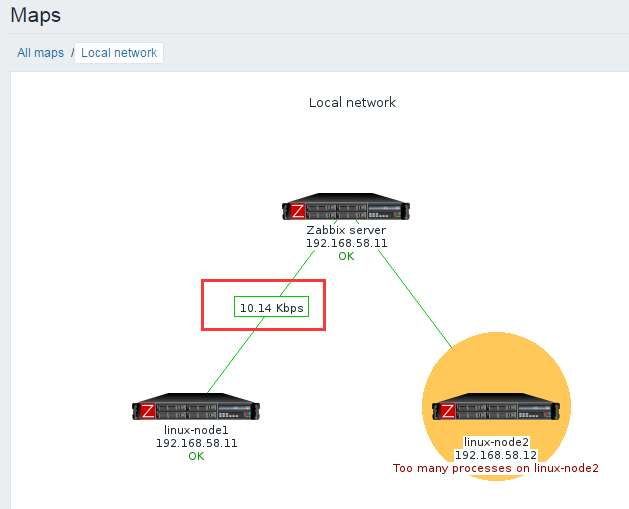
zabbix 还可以自定义map
######################################################################################
zabbix页面注意事项
1、 工作中使用zabbix常遇到的问题:生产一台机器告警了顺手关闭了,然后忘记打开了


4、生产中,一定好划分好主机组,可以按业务划分

5、这里可以找某台机器的最新数据,这是3.0版本之后加的过滤
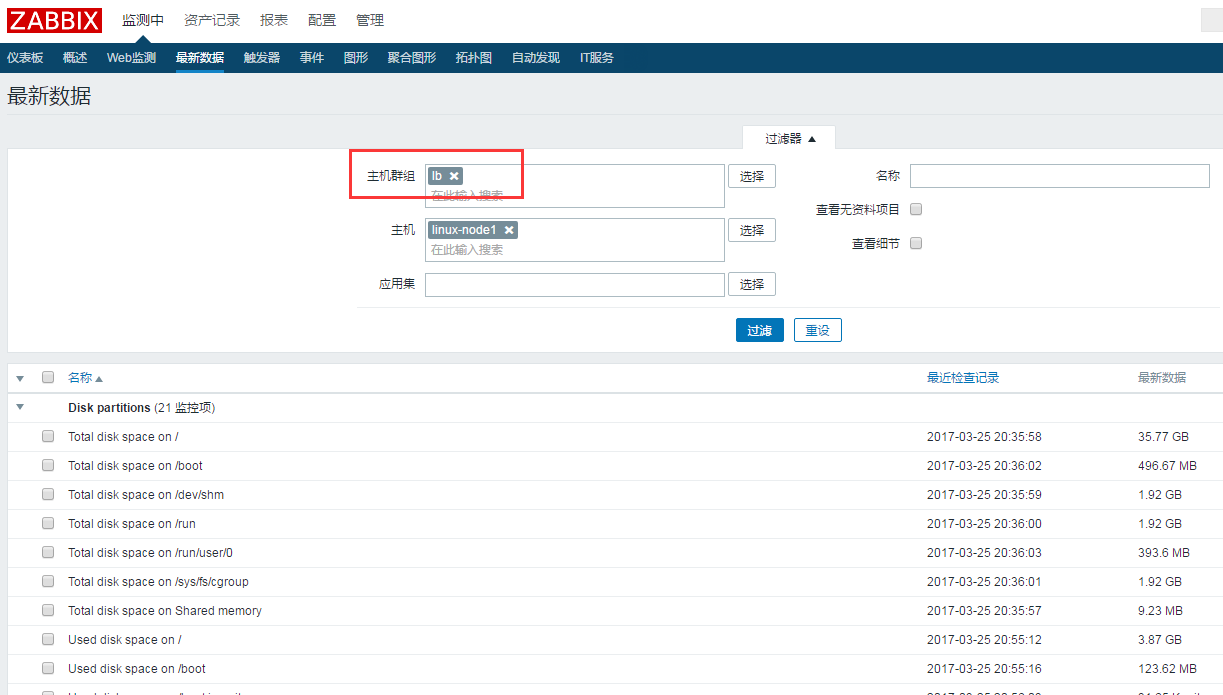
一些最新数据

准备新加一台机器node2
node2上执行如下操作
|
1
2
|
rpm -ivh http://mirrors.aliyun.com/zabbix/zabbix/3.0/rhel/7/x86_64/zabbix-release-3.0-1.el7.noarch.rpmyum install zabbix-agent -y |
配置zabbix-agent配置文件
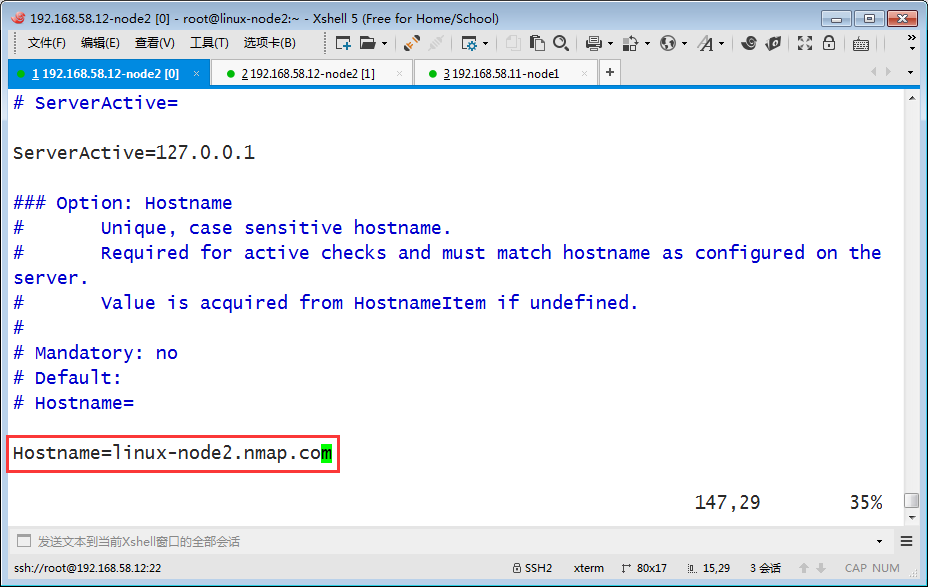
主机名这里写成正确主机名
过滤查看下
|
1
2
3
4
5
6
7
8
9
10
11
|
[root@linux-node2 ~]# vim /etc/zabbix/zabbix_agentd.conf [root@linux-node2 ~]# grep '^[a-Z]' /etc/zabbix/zabbix_agentd.confPidFile=/var/run/zabbix/zabbix_agentd.pidLogFile=/var/log/zabbix/zabbix_agentd.logLogFileSize=0Server=192.168.58.11ServerActive=127.0.0.1Hostname=linux-node2.nmap.comInclude=/etc/zabbix/zabbix_agentd.d/[root@linux-node2 ~]# systemctl start zabbix-agent[root@linux-node2 ~]# |

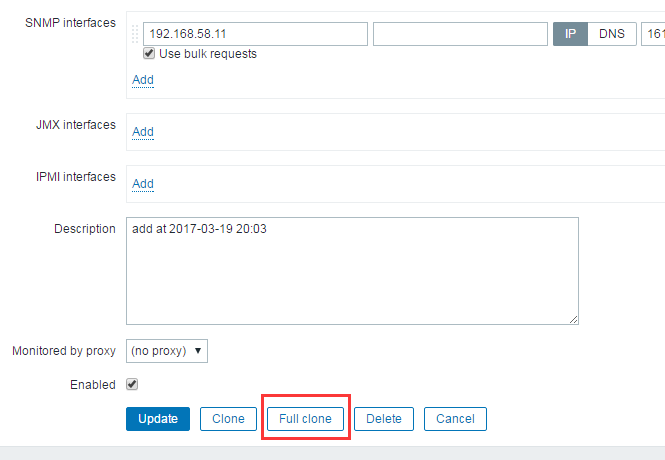
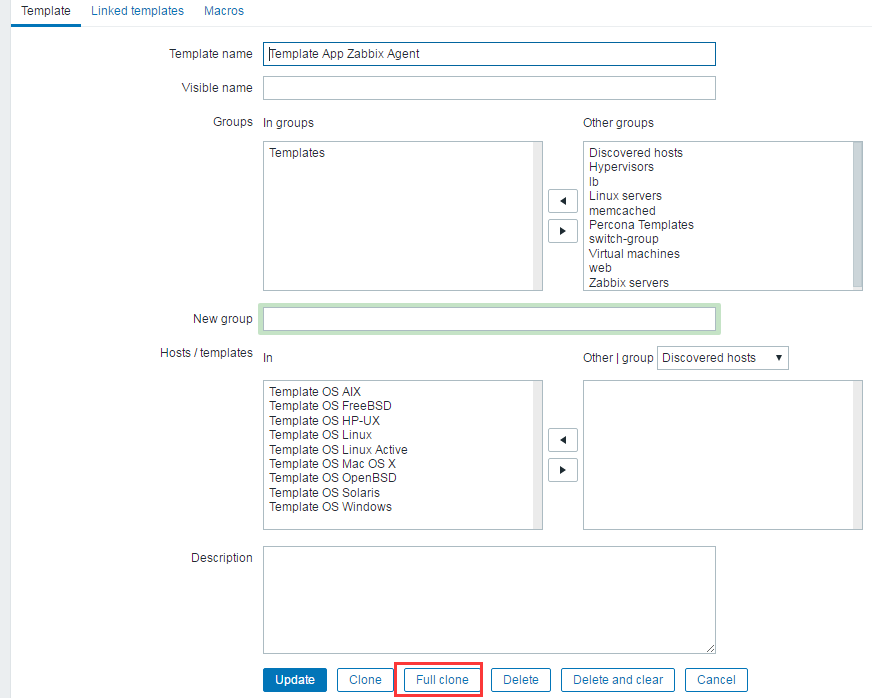
点进去,点击下面的Full clone
输入如下信息


添加之后如下


添加链接


|
1
2
|
net.if.in[{#IFNAME}]net.if.out[{#IFNAME}] |
|
1
|
{linux-node2.nmap.com:net.if.out[eth0].last(0)} |


监控事件和告警

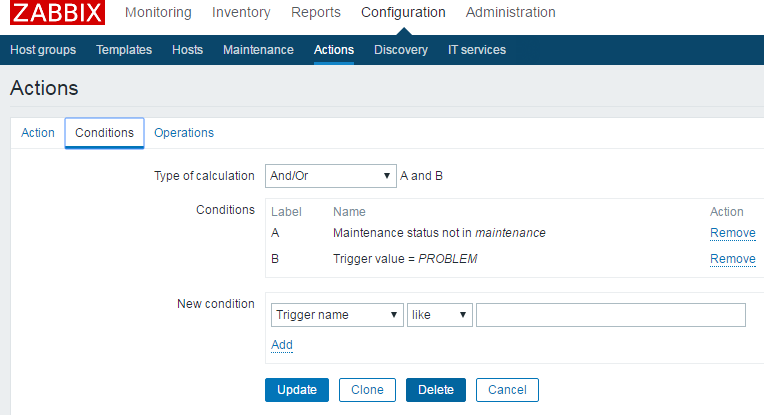
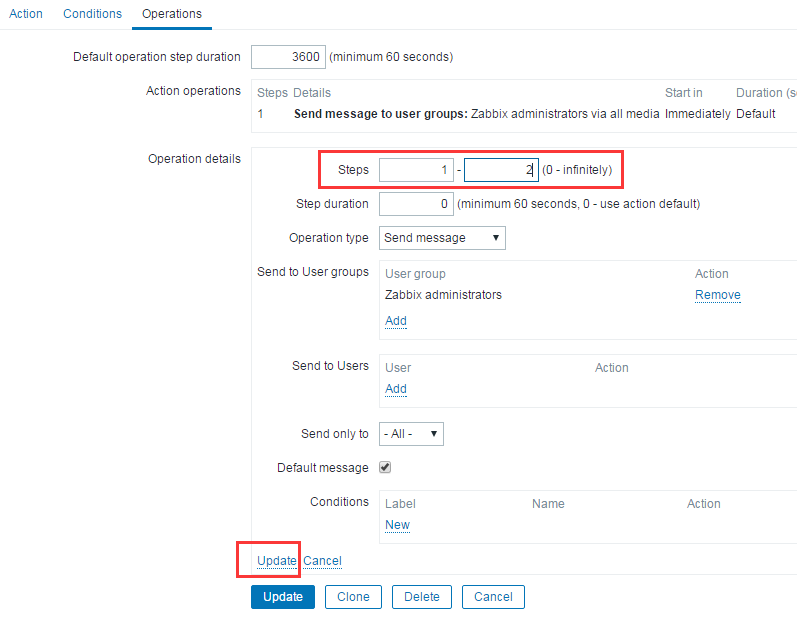
1、怎么通知Action
2、通知给谁

action不仅仅是告警,默认的动作是报警,还能配置下自动执行一些脚本。其实报警这个动作肯定是执行了脚本等实现的
默认情况下通知的内容


报警媒介相关

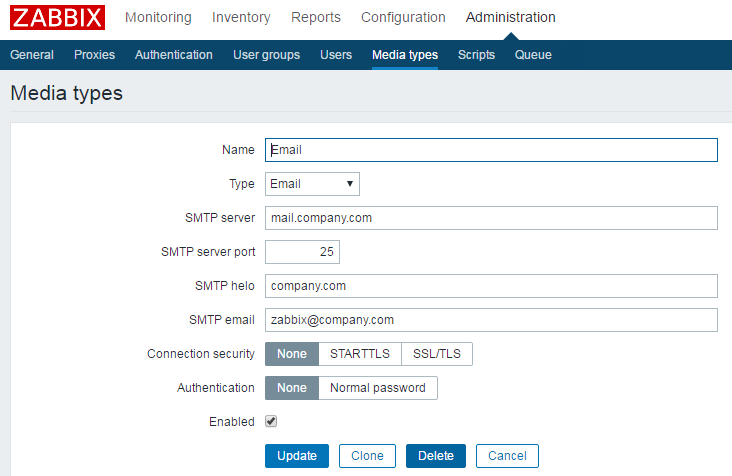


设置ssl连接方式发送和接收邮件

配置用户使用email告警


1、创建用户组。 添加权限 权限只能按用户组分配
2、创建用户 选择用户角色
3、报警媒介
4、Action 添加新主机后,要确认权限分配
1、项目规划
主机分组:
交换机,Nginx,Tomcat,Mysql
监控对象识别:
1、使用snmp监控交换机
2、使用IPMI监控服务器硬件
3、使用Agent监控服务器
4、使用JMX监控java
5、监控MySQL
6、监控Web状态
7、监控Nginx状态

监控网络设备,比如交换机的大体步骤
|
1
2
3
4
5
6
|
1、对于交换机,需要在交换机上开启snmpconfig tsnmp-server community public roend2、zabbix上添加监控 |


通过zabbix监控交换机大体步骤
|
1
2
3
4
5
6
7
8
9
10
11
|
1、对于交换机,需要在交换机上开启snmpconfig tsnmp-server community public roend2、zabbix上添加监控 设置snmp interfaces3、关联监控模板IPMI: 建议:使用自定义item,本地执行ipmitool命令获取数据 |
监控JVM
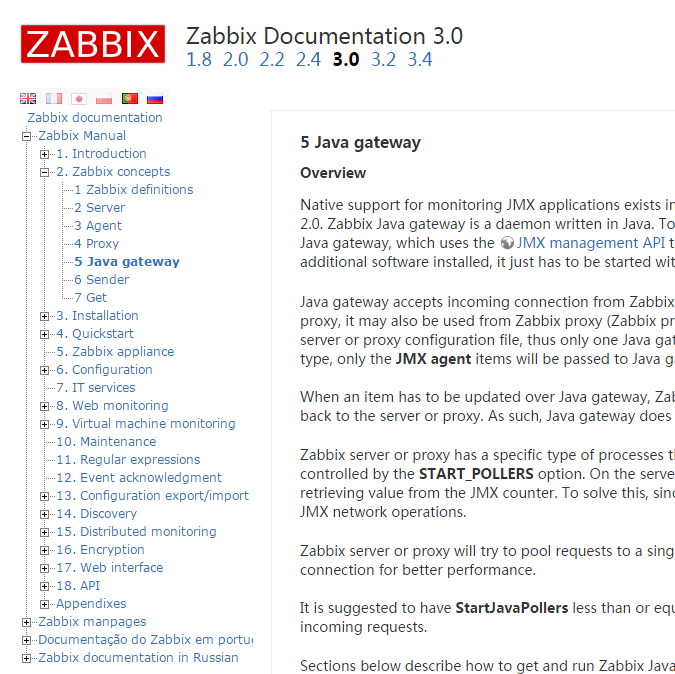
监控jvm可以通过java gateway来
官网链接如下


|
1
2
3
4
5
6
7
8
9
10
|
[root@linux-node1 ~]# yum install -y zabbix-java-gateway java-1.8.0 Loaded plugins: fastestmirrorLoading mirror speeds from cached hostfile * base: mirrors.aliyun.com * epel: mirror01.idc.hinet.net * extras: mirrors.aliyun.com * updates: mirrors.aliyun.comPackage zabbix-java-gateway-3.0.8-2.el7.x86_64 already installed and latest versionPackage 1:java-1.8.0-openjdk-1.8.0.121-0.b13.el7_3.x86_64 already installed and latest versionNothing to do |
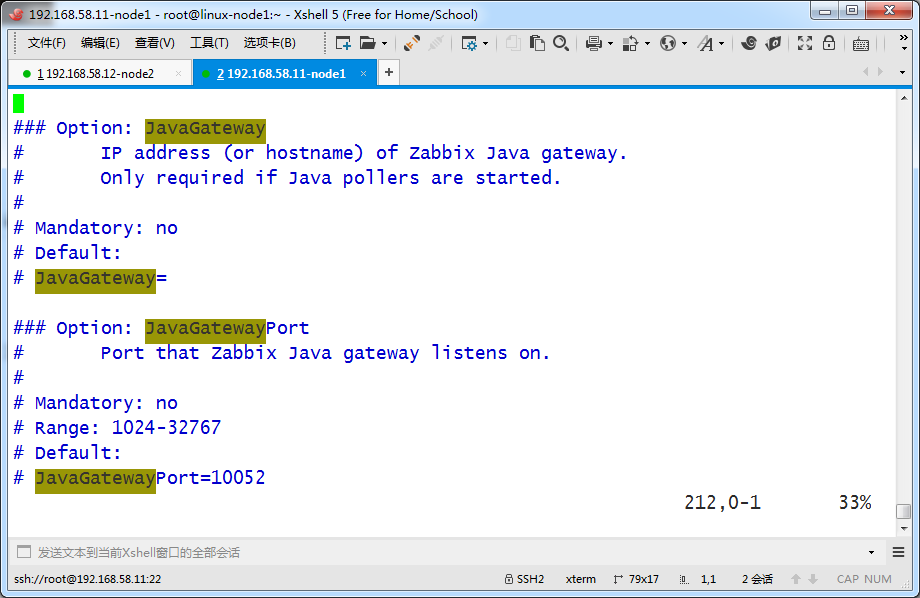
编辑配置


启动服务并设置开机启动
|
1
2
3
4
|
[root@linux-node1 ~]# systemctl start zabbix-java-gateway.service [root@linux-node1 ~]# systemctl enable zabbix-java-gateway.service Created symlink from /etc/systemd/system/multi-user.target.wants/zabbix-java-gateway.service to /usr/lib/systemd/system/zabbix-java-gateway.service.[root@linux-node1 ~]# |
检查监听情况
|
1
2
3
4
5
6
7
|
[root@linux-node1 ~]# netstat -lntp | grep 100tcp 0 0 0.0.0.0:10050 0.0.0.0:* LISTEN 2373/zabbix_agentd tcp 0 0 0.0.0.0:10051 0.0.0.0:* LISTEN 1500/zabbix_server tcp6 0 0 :::10050 :::* LISTEN 2373/zabbix_agentd tcp6 0 0 :::10051 :::* LISTEN 1500/zabbix_server tcp6 0 0 :::10052 :::* LISTEN 18836/java [root@linux-node1 ~]# |
检查java gateway进程和java版本
|
1
2
3
4
5
6
7
8
9
10
11
12
13
|
[root@linux-node1 ~]# ps aux | grep javazabbix 18836 1.2 0.9 3455096 37672 ? Sl 13:42 0:00 java -server -Dlogback.configurationFile=/etc/zabbix/zabbix_java_gateway_logback.xml -classpathlib:lib/android-json-4.3_r3.1.jar:lib/logback-classic-0.9.27.jar:lib/logback-core-0.9.27.jar:lib/slf4j-api-1.6.1.jar:bin/zabbix-java-gateway-3.0.8.jar -Dzabbix.pidFile=/var/run/zabbix/zabbix_java.pid -Dzabbix.timeout=3 -Dsun.rmi.transport.tcp.responseTimeout=3000 com.zabbix.gateway.JavaGatewayroot 18913 0.0 0.0 112644 964 pts/0 S+ 13:43 0:00 grep --colour=auto java[root@linux-node1 ~]# [root@linux-node1 ~]# java -versionopenjdk version "1.8.0_121"OpenJDK Runtime Environment (build 1.8.0_121-b13)OpenJDK 64-Bit Server VM (build 25.121-b13, mixed mode)[root@linux-node1 ~]# |


|
1
2
3
|
[root@linux-node1 ~]# vim /etc/zabbix/zabbix_server.conf [root@linux-node1 ~]# systemctl restart zabbix-server.service [root@linux-node1 ~]# |
|
1
2
3
4
5
6
7
8
9
10
11
|
yum install -y java-1.8.0cd /usr/local/src/wget http://archive.apache.org/dist/tomcat/tomcat-8/v8.0.36/bin/apache-tomcat-8.0.36.tar.gz tar xfz apache-tomcat-8.0.36.tar.gz mv apache-tomcat-8.0.36 /usr/local/ln -s /usr/local/apache-tomcat-8.0.36/ /usr/local/tomcat[root@linux-node2 src]# netstat -lntp | grep 8080tcp6 0 0 :::8080 :::* LISTEN 8137/java [root@linux-node2 src]# |

以上步骤可以总结为
JMX:(使用zabbix java Gateway代理)
1、安装 yum install -y zabbix-java-gateway java-1.8.0
2、配置vim /etc/zabbix/zabbix_java_gateway.conf
3、启动systemctl start zabbix-java-gateway
4、检查端口和进程
5、配置zabbix server关联java gateway
6、重启zabbix server

####################################################################################
|
1
2
3
4
5
|
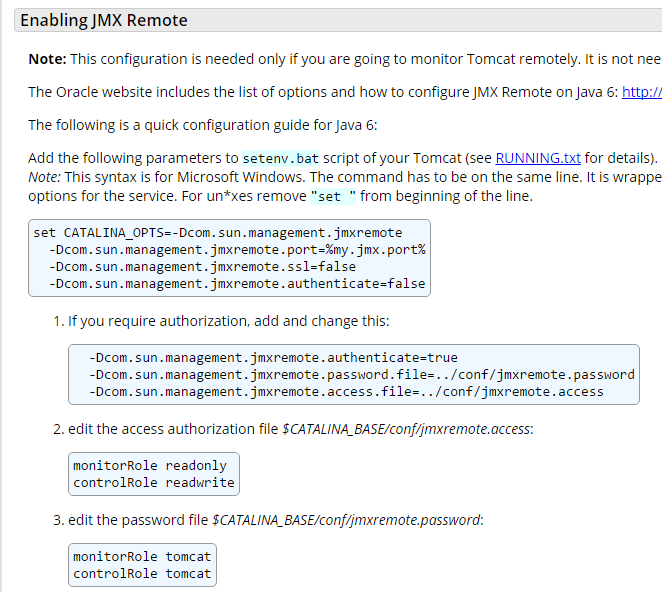
CATALINA_OPTS="$CATALINA_OPTS -Dcom.sun.management.jmxremote -Dcom.sun.management.jmxremote.port=8888 -Dcom.sun.management.jmxremote.ssl=false -Dcom.sun.management.jmxremote.authenticate=false -Djava.rmi.server.hostname=192.168.58.12" |

|
1
2
3
4
5
6
7
8
9
10
11
12
13
14
15
16
17
18
19
20
21
22
23
24
25
26
27
28
29
30
|
[root@linux-node2 src]# killall java[root@linux-node2 src]# killall javajava: no process found[root@linux-node2 src]# /usr/local/tomcat/bin/startup.sh Using CATALINA_BASE: /usr/local/tomcatUsing CATALINA_HOME: /usr/local/tomcatUsing CATALINA_TMPDIR: /usr/local/tomcat/tempUsing JRE_HOME: /usrUsing CLASSPATH: /usr/local/tomcat/bin/bootstrap.jar:/usr/local/tomcat/bin/tomcat-juli.jarTomcat started.看到8888端口已经起来了[root@linux-node2 src]# netstat -lntp Active Internet connections (only servers)Proto Recv-Q Send-Q Local Address Foreign Address State PID/Program name tcp 0 0 0.0.0.0:10050 0.0.0.0:* LISTEN 6938/zabbix_agentd tcp 0 0 0.0.0.0:111 0.0.0.0:* LISTEN 1/systemd tcp 0 0 0.0.0.0:22 0.0.0.0:* LISTEN 1160/sshd tcp 0 0 127.0.0.1:25 0.0.0.0:* LISTEN 1251/master tcp6 0 0 :::10050 :::* LISTEN 6938/zabbix_agentd tcp6 0 0 127.0.0.1:8005 :::* LISTEN 8522/java tcp6 0 0 :::56614 :::* LISTEN 8522/java tcp6 0 0 :::8009 :::* LISTEN 8522/java tcp6 0 0 :::111 :::* LISTEN 1/systemd tcp6 0 0 :::8080 :::* LISTEN 8522/java tcp6 0 0 :::22 :::* LISTEN 1160/sshd tcp6 0 0 :::8888 :::* LISTEN 8522/java tcp6 0 0 :::57945 :::* LISTEN 8522/java tcp6 0 0 ::1:25 :::* LISTEN 1251/master [root@linux-node2 src]# |


|
1
2
3
|
[root@linux-node1 ~]# zabbix_get -s 192.168.58.12 -k jmx["java.lang:type=GarbageCollector,name=Copy",CollectionCount]ZBX_NOTSUPPORTED: Unsupported item key.[root@linux-node1 ~]# |

1、开启Nginx监控
2、编写脚本来进行数据采集
3、设置用户自定义参数
4、重启zabbix-agent
5、添加item
6、创建图形
7、创建触发器
8、创建模板

|
1
2
3
4
5
|
[root@linux-node2 src]# ss -ant | awk 'NR>1 {++s[$1]} END {for(k in s) print k,s[k]}'LISTEN 14ESTAB 4TIME-WAIT 30[root@linux-node2 src]# |


|
1
|
[root@linux-node1 ~]# vim /etc/zabbix/zabbix_agentd.conf |


|
1
2
3
4
5
6
7
8
9
10
11
|
[root@linux-node1 ~]# cd /etc/zabbix/zabbix_agentd.d/[root@linux-node1 zabbix_agentd.d]# lsnginx.conf userparameter_mysql.conf[root@linux-node1 zabbix_agentd.d]# rz -Erz waiting to receive.[root@linux-node1 zabbix_agentd.d]# lsnginx.conf userparameter_mysql.conf zabbix_linux_plugin.sh[root@linux-node1 zabbix_agentd.d]# chmod +x zabbix_linux_plugin.sh [root@linux-node1 zabbix_agentd.d]# lsnginx.conf userparameter_mysql.conf zabbix_linux_plugin.sh[root@linux-node1 zabbix_agentd.d]# |

|
1
2
3
|
[root@linux-node1 ~]# vim /usr/local/nginx/conf/nginx.conf[root@linux-node1 ~]# /usr/local/nginx/sbin/nginx -s reload[root@linux-node1 ~]# |


|
1
2
|
[root@linux-node1 ~]# /usr/local/nginx/sbin/nginx -s reload[root@linux-node1 ~]# |
|
1
2
3
|
[root@linux-node1 zabbix_agentd.d]# ./zabbix_linux_plugin.sh nginx_status 8080 active1[root@linux-node1 zabbix_agentd.d]# |
|
1
2
3
4
5
|
[root@linux-node1 zabbix_agentd.d]# cp nginx.conf linux.conf[root@linux-node1 zabbix_agentd.d]# vim linux.conf [root@linux-node1 zabbix_agentd.d]# cat linux.conf UserParameter=linux_status[*],/etc/zabbix/zabbix_agentd.d/zabbix_linux_plugin.sh "$1" "$2" "$3"[root@linux-node1 zabbix_agentd.d]# |
|
1
2
|
[root@linux-node1 zabbix_agentd.d]# systemctl restart zabbix-agent.service [root@linux-node1 zabbix_agentd.d]# |
|
1
2
3
|
[root@linux-node1 ~]# zabbix_get -s 192.168.58.11 -k linux_status[nginx_status,8080,active]1[root@linux-node1 ~]# |


|
1
2
3
4
5
6
7
8
9
|
[root@linux-node1 zabbix_agentd.d]# pwd/etc/zabbix/zabbix_agentd.d[root@linux-node1 zabbix_agentd.d]# lltotal 16-rw-r--r-- 1 root root 96 Mar 26 15:22 linux.conf-rw-r--r-- 1 root root 117 Mar 19 20:37 nginx.conf-rw-r--r-- 1 root root 1531 Mar 2 23:49 userparameter_mysql.conf-rwxr-xr-x 1 root root 2776 Jun 18 2016 zabbix_linux_plugin.sh[root@linux-node1 zabbix_agentd.d]# |


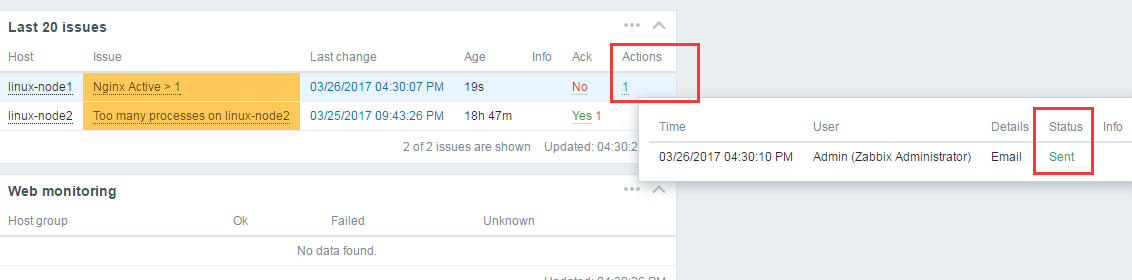
邮件配置对的话,肯定能收到告警
这里还看到了一个告警,Too many processes on linux-node2
系统自带的触发器,阈值太低,修改下模板里的items里的阀值


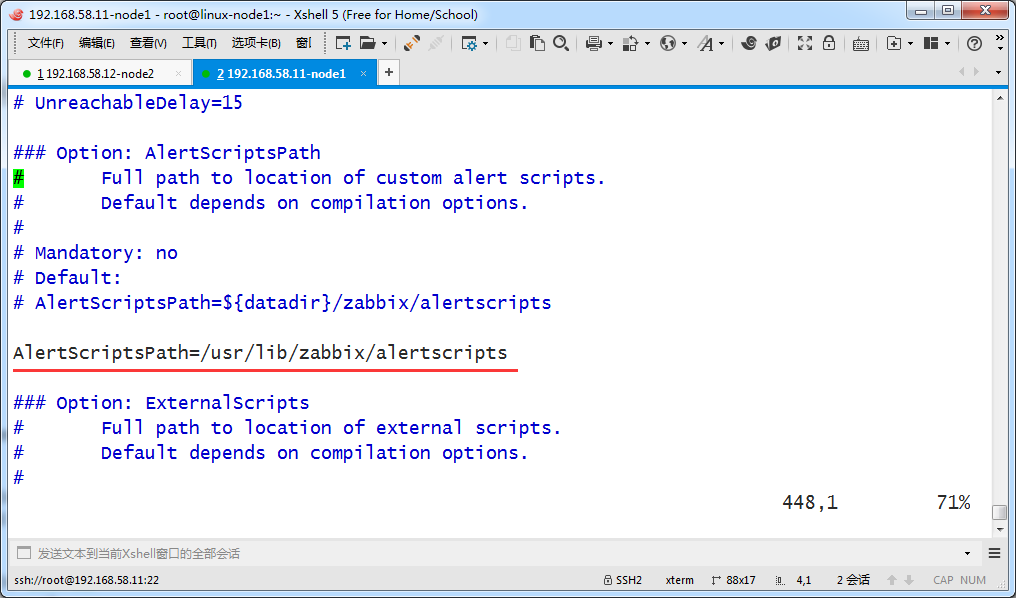
自定义告警脚本:
1、放在 /usr/lib/zabbix/alertscripts
2、需要支持3个参数,1 收件人,2 主题, 3内容
3、执行权限
4、web界面添加
5、修改actions


|
1
2
3
4
5
6
7
8
9
10
11
12
13
14
15
16
|
curl -X POST 'http://gw.api.taobao.com/router/rest' \-H 'Content-Type:application/x-www-form-urlencoded;charset=utf-8' \-d 'app_key=12129701' \-d 'format=json' \-d 'method=alibaba.aliqin.fc.sms.num.send' \-d 'partner_id=apidoc' \-d 'sign=DB9F439ACCF950E94514CDF0BF24DFB8' \-d 'sign_method=hmac' \-d 'timestamp=2017-03-26+16%3A25%3A33' \-d 'v=2.0' \-d 'extend=123456' \-d 'rec_num=13000000000' \-d 'sms_free_sign_name=%E9%98%BF%E9%87%8C%E5%A4%A7%E4%BA%8E' \-d 'sms_param=%7B%5C%22code%5C%22%3A%5C%221234%5C%22%2C%5C%22product%5C%22%3A%5C%22alidayu%5C%22%7D' \-d 'sms_template_code=SMS_585014' \-d 'sms_type=normal' |
|
1
2
3
4
5
6
7
8
9
10
11
12
13
14
|
[root@linux-node1 ~]# cd /usr/lib/zabbix/alertscripts[root@linux-node1 alertscripts]# ls[root@linux-node1 alertscripts]# vim sms.sh[root@linux-node1 alertscripts]# chmod +x sms.sh [root@linux-node1 alertscripts]# cat sms.sh #!/bin/bashALERT_TO=$1ALERT_TITLE=$2ALERT_BODY=$3echo $ALERT_TO >> /tmp/sms.logecho $ALERT_TITLE >> /tmp/sms.logecho $ALERT_BODY >> /tmp/sms.log[root@linux-node1 alertscripts]# |


|
1
2
3
4
5
|
[root@linux-node1 tmp]# tail -5 /tmp/sms.log xxxx38@qq.comPROBLEM: Nginx Active > 1 Original ev* (*UNKNOWN*:*UNKNOWN*): *UNKNOWN*tus[nginx_status,8080,active]): 3[root@linux-node1 tmp]# |


|
1
2
3
4
5
6
7
8
9
10
11
12
13
14
|
yum install http://www.percona.com/downloads/percona-release/redhat/0.1-4/percona-release-0.1-4.noarch.rpm -y[root@linux-node1 ~]# yum install percona-zabbix-templates php php-mysql -yLoaded plugins: fastestmirrorLoading mirror speeds from cached hostfile * base: mirrors.aliyun.com * epel: mirror01.idc.hinet.net * extras: mirrors.aliyun.com * updates: mirrors.aliyun.comPackage percona-zabbix-templates-1.1.7-2.noarch already installed and latest versionPackage php-5.4.16-42.el7.x86_64 already installed and latest versionPackage php-mysql-5.4.16-42.el7.x86_64 already installed and latest versionNothing to do[root@linux-node1 ~]# |
相关知识点
1、php脚本用来采集数据
2、shell调用这个php
3、zabbix配置文件
4、zabbix模板文件
|
1
2
3
4
5
6
7
8
9
10
|
[root@linux-node1 ~]# rpm -ql percona-zabbix-templates/var/lib/zabbix/percona/var/lib/zabbix/percona/scripts/var/lib/zabbix/percona/scripts/get_mysql_stats_wrapper.sh/var/lib/zabbix/percona/scripts/ss_get_mysql_stats.php/var/lib/zabbix/percona/templates/var/lib/zabbix/percona/templates/userparameter_percona_mysql.conf/var/lib/zabbix/percona/templates/zabbix_agent_template_percona_mysql_server_ht_2.0.9-sver1.1.7.xml[root@linux-node1 ~]# cp /var/lib/zabbix/percona/templates/userparameter_percona_mysql.conf /etc/zabbix/zabbix_agentd.d/[root@linux-node1 ~]# |
|
1
2
3
4
5
|
[root@linux-node1 ~]# cd /etc/zabbix/zabbix_agentd.d/[root@linux-node1 zabbix_agentd.d]# lslinux.conf userparameter_mysql.conf zabbix_linux_plugin.shnginx.conf userparameter_percona_mysql.conf[root@linux-node1 zabbix_agentd.d]# |
|
1
2
|
[root@linux-node1 scripts]# systemctl restart zabbix-agent.service [root@linux-node1 scripts]# |

|
1
2
3
4
5
6
7
8
9
10
11
12
|
[root@linux-node1 zabbix_agentd.d]# tail -10 userparameter_percona_mysql.conf UserParameter=MySQL.log-writes,/var/lib/zabbix/percona/scripts/get_mysql_stats_wrapper.sh hgUserParameter=MySQL.Query-time-count-04,/var/lib/zabbix/percona/scripts/get_mysql_stats_wrapper.sh opUserParameter=MySQL.Query-time-count-05,/var/lib/zabbix/percona/scripts/get_mysql_stats_wrapper.sh oqUserParameter=MySQL.Query-time-count-06,/var/lib/zabbix/percona/scripts/get_mysql_stats_wrapper.sh orUserParameter=MySQL.Query-time-count-07,/var/lib/zabbix/percona/scripts/get_mysql_stats_wrapper.sh osUserParameter=MySQL.Query-time-count-08,/var/lib/zabbix/percona/scripts/get_mysql_stats_wrapper.sh otUserParameter=MySQL.Query-time-count-09,/var/lib/zabbix/percona/scripts/get_mysql_stats_wrapper.sh ouUserParameter=MySQL.Open-files,/var/lib/zabbix/percona/scripts/get_mysql_stats_wrapper.sh ijUserParameter=MySQL.State-closing-tables,/var/lib/zabbix/percona/scripts/get_mysql_stats_wrapper.sh lqUserParameter=MySQL.running-slave,/var/lib/zabbix/percona/scripts/get_mysql_stats_wrapper.sh running-slave[root@linux-node1 zabbix_agentd.d]# |
|
1
2
3
4
|
[root@linux-node1 zabbix_agentd.d]# cd /var/lib/zabbix/percona/scripts[root@linux-node1 scripts]# lsget_mysql_stats_wrapper.sh ss_get_mysql_stats.php[root@linux-node1 scripts]# |
|
1
2
3
4
5
6
7
8
9
10
11
12
13
14
15
16
17
|
[root@linux-node1 scripts]# cat ss_get_mysql_stats.php.cnf <?php$mysql_user = 'root';$mysql_pass = '';[root@linux-node1 scripts]# [root@linux-node1 scripts]# mysqlWelcome to the MariaDB monitor. Commands end with ; or \g.Your MariaDB connection id is 9629Server version: 5.5.52-MariaDB MariaDB ServerCopyright (c) 2000, 2016, Oracle, MariaDB Corporation Ab and others.Type 'help;' or '\h' for help. Type '\c' to clear the current input statement.MariaDB [(none)]> exitBye[root@linux-node1 scripts]# |
|
1
2
3
|
[root@linux-node1 scripts]# /var/lib/zabbix/percona/scripts/get_mysql_stats_wrapper.sh gg0[root@linux-node1 scripts]# |
|
1
2
3
|
[root@linux-node1 scripts]# ll get_mysql_stats_wrapper.sh -rwxr-xr-x 1 root root 1251 Dec 10 02:22 get_mysql_stats_wrapper.sh[root@linux-node1 scripts]# |


|
1
2
3
|
[root@linux-node1 scripts]# ./get_mysql_stats_wrapper.sh gm1[root@linux-node1 scripts]# |
|
1
2
3
4
|
[root@linux-node1 scripts]# zabbix_get -s 192.168.58.11 -k MySQL.max-connectionsrm: cannot remove ‘/tmp/localhost-mysql_cacti_stats.txt’: Operation not permitted151[root@linux-node1 scripts]# |
|
1
2
3
4
5
6
7
8
|
[root@linux-node1 scripts]# ll /tmp/localhost-mysql_cacti_stats.txt -rw-r--r-- 1 root root 1406 Mar 26 22:15 /tmp/localhost-mysql_cacti_stats.txt[root@linux-node1 scripts]# chown zabbix.zabbix /tmp/localhost-mysql_cacti_stats.txt[root@linux-node1 scripts]# ll /tmp/localhost-mysql_cacti_stats.txt -rw-r--r-- 1 zabbix zabbix 1406 Mar 26 22:15 /tmp/localhost-mysql_cacti_stats.txt[root@linux-node1 scripts]# zabbix_get -s 192.168.58.11 -k MySQL.max-connections151[root@linux-node1 scripts]# |

|
1
2
3
4
5
6
7
8
|
[root@linux-node1 ~]# curl --head http://192.168.58.12:8080/HTTP/1.1 200 OKServer: Apache-Coyote/1.1Content-Type: text/html;charset=UTF-8Transfer-Encoding: chunkedDate: Sun, 26 Mar 2017 15:14:17 GMT[root@linux-node1 ~]# |


|
1
2
3
4
5
6
7
8
|
[root@linux-node2 ~]# /usr/local/tomcat/bin/shutdown.sh Using CATALINA_BASE: /usr/local/tomcatUsing CATALINA_HOME: /usr/local/tomcatUsing CATALINA_TMPDIR: /usr/local/tomcat/tempUsing JRE_HOME: /usrUsing CLASSPATH: /usr/local/tomcat/bin/bootstrap.jar:/usr/local/tomcat/bin/tomcat-juli.jar[root@linux-node2 ~]# lsof -i:8080[root@linux-node2 ~]# |

|
1
2
3
4
5
6
7
8
9
10
11
12
|
[root@linux-node1 ~]# dateMon Mar 27 08:45:34 CST 2017[root@linux-node1 ~]# systemctl restart ntpd[root@linux-node1 ~]# dateMon Mar 27 08:45:46 CST 2017[root@linux-node1 ~]# dateMon Mar 27 08:45:47 CST 2017[root@linux-node1 ~]# dateMon Mar 27 08:45:48 CST 2017[root@linux-node1 ~]# dateWed Mar 29 23:10:17 CST 2017[root@linux-node1 ~]# |


|
1
2
3
4
5
|
[root@linux-node2 webapps]# mv ROOT ROOT2[root@linux-node2 webapps]# lsdocs examples host-manager manager ROOT2[root@linux-node2 webapps]# mv ROOT2 ROOT[root@linux-node2 webapps]# |

|
1
2
3
4
5
6
7
8
9
10
11
|
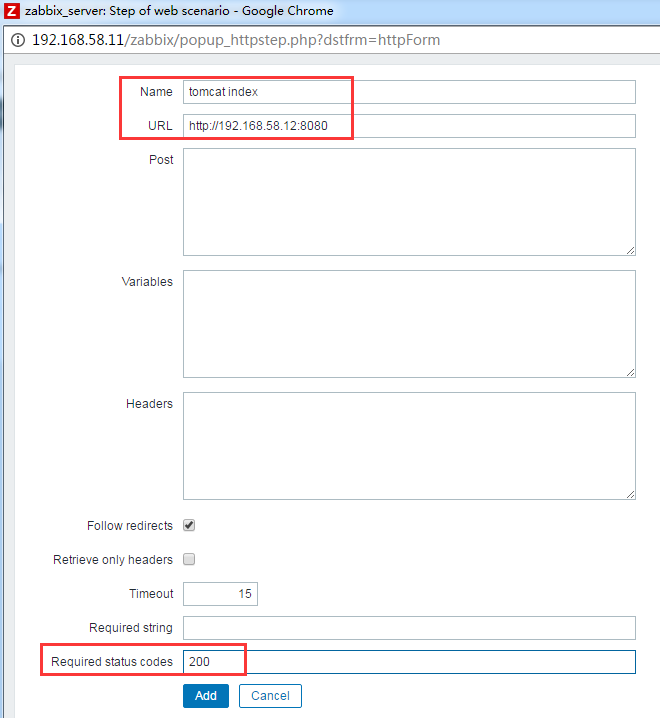
[root@linux-node1 ~]# tail -f /tmp/sms.log Original ev* (*UNKNOWN*:*UNKNOWN*): *UNKNOWN*e=Runtime",Uptime]): 00:00:09525031638@qq.comPROBLEM: linux-node2 is not reachable Original ev* (*UNKNOWN*:*UNKNOWN*): *UNKNOWN*e=Runtime",Uptime]): 00:00:25525031638@qq.com状态:OK 监控项:jmx["java.lang:type=Runtime",Uptime]):00:00:5525031638@qq.com状态:PROBLEM 监控项:web.test.rspcode[tomcat web monitor,tomcat index]):40 |


为什么使用主动模式
1、监控主机多,性能跟不上,延迟大
2、多机房,防火墙
Zabbix轻松解决。Nagios不太好解决
针对Agent来说
1、被动模式
2、主动模式,active
当监控主机超过300+,建议使用主动模式


|
1
2
|
[root@linux-node2 webapps]# systemctl restart zabbix-agent.service [root@linux-node2 webapps]# |
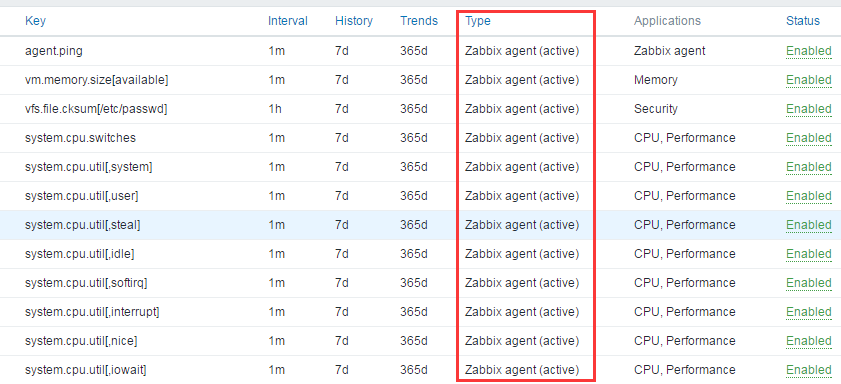
网页制作主动监控模式模板


add之后


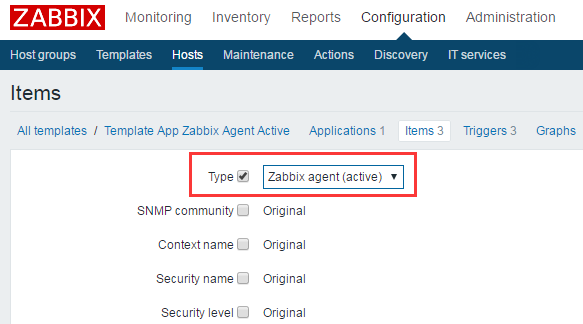
这里都变成active的了


学习zabbix(六)的更多相关文章
- 前端学习 第六弹: javascript中的函数与闭包
前端学习 第六弹: javascript中的函数与闭包 当function里嵌套function时,内部的function可以访问外部function里的变量 function foo(x) { ...
- Android Animation学习(六) View Animation介绍
Android Animation学习(六) View Animation介绍 View Animation View animation系统可以用来执行View上的Tween animation和F ...
- java之jvm学习笔记六-十二(实践写自己的安全管理器)(jar包的代码认证和签名) (实践对jar包的代码签名) (策略文件)(策略和保护域) (访问控制器) (访问控制器的栈校验机制) (jvm基本结构)
java之jvm学习笔记六(实践写自己的安全管理器) 安全管理器SecurityManager里设计的内容实在是非常的庞大,它的核心方法就是checkPerssiom这个方法里又调用 AccessCo ...
- Bootstrap3.0学习第六轮(表单)
Bootstrap3.0学习第六轮(表单) 前言 阅读之前您也可以到Bootstrap3.0入门学习系列导航中进行查看http://www.cnblogs.com/aehyok/p/3404867.h ...
- Learning ROS for Robotics Programming Second Edition学习笔记(六) indigo xtion pro live
中文译著已经出版,详情请参考:http://blog.csdn.net/ZhangRelay/article/category/6506865 Learning ROS for Robotics Pr ...
- Maven学习(六)-- Maven与Eclipse整合
由于我使用的是IDEA所以就不摘录了,感兴趣的移步 Maven学习总结(六)--Maven与Eclipse整合 Maven学习总结(七)--eclipse中使用Maven创建Web项目
- python学习第六讲,python中的数据类型,列表,元祖,字典,之列表使用与介绍
目录 python学习第六讲,python中的数据类型,列表,元祖,字典,之列表使用与介绍. 二丶列表,其它语言称为数组 1.列表的定义,以及语法 2.列表的使用,以及常用方法. 3.列表的常用操作 ...
- Python学习第六课
Python学习第六课 课前回顾 列表 创建 通过 [] :写在[]里,元素之间用逗号隔开 对应操作: 查 增 append insert 改(重新赋值) 删除(remove del pop(删除后会 ...
- Typescript 学习笔记六:接口
中文网:https://www.tslang.cn/ 官网:http://www.typescriptlang.org/ 目录: Typescript 学习笔记一:介绍.安装.编译 Typescrip ...
- 【转载】 强化学习(六)时序差分在线控制算法SARSA
原文地址: https://www.cnblogs.com/pinard/p/9614290.html ------------------------------------------------ ...
随机推荐
- C# mutex互斥锁构造
概念 Mutext 出现的比monitor更早,而且传承自COM,当然,waitHandle也是它的父类,它继承了其父类的功能,有趣的是Mutex的脾气非常的古怪,它 允许同一个线程多次重复访问共享区 ...
- Echarts图表类型
每个系列通过 type 决定自己的图表类型: type: 'bar':柱状/条形图 type: 'line':折线/面积图 type: 'pie':饼图 type: 'scatter':散点(气泡)图 ...
- java jdbc连接池
public class C3P0Util { //1. 在成员变量位置创建一个静态的ComboPooledDtatSource 对象 private static ComboPooledDataSo ...
- cmd:WIN7操作系统下cmd窗口下的复制粘贴
1.右击cmd的顶部栏,点开属性 2.在 选项 下,勾选"快速编辑模式" 3.按住鼠标左键标注需要复制的区域 再点击一下右键,则上文的标记区域就已经被复制了,可以通过ctrl+v进 ...
- Chrome:F12开发者模式下console不打印信息
控制台不打印信息的解决方法 你要看看你是否在之前进行过查找关键字操作,操作之后忘记删去这个关键字,导致console中只会留下对于该关键字的查询结果.
- SpringSecurity原理解析以及CSRF跨站请求伪造攻击
SpringSecurity SpringSecurity是一个基于Spring开发的非常强大的权限验证框架,其核心功能包括: 认证 (用户登录) 授权 (此用户能够做哪些事情) 攻击防护 (防止伪造 ...
- LeetCode-078-子集
子集 题目描述:给你一个整数数组 nums ,数组中的元素 互不相同 .返回该数组所有可能的子集(幂集). 解集 不能 包含重复的子集.你可以按 任意顺序 返回解集. 示例说明请见LeetCode官网 ...
- LeetCode-011-盛最多水的容器
盛最多水的容器 题目描述:给你 n 个非负整数 a1,a2,...,an,每个数代表坐标中的一个点 (i, ai) .在坐标内画 n 条垂直线,垂直线 i 的两个端点分别为 (i, ai) 和 (i, ...
- linux作业--第一周
1.按系列罗列Linux的发行版,并描述不同发行版之间的联系与区别. 目前三大主流发行版分别为Debian.Redhat.SUSE. redhat: RHEL: Red Hat公司发布的面向企业用户的 ...
- PHP日常错误总结
session问题 问题描述 初到公司开发的项目在本地测试没有问题,部署到线上之后出来验证码一直错误,或者是CSRF token mismatch. 这些问题都是和session有关系,打开两个页面, ...