Golang程序性能分析
前言
程序性能分析我相信是每个程序员都会遇到的问题,比如说一个程序的CPU为什么占用这么高?有没有优化的空间?又比如程序出现了内存泄漏如何排查等等。如果是C++程序会借助于Google pprof c++ profile,java程序会依赖于jstack等工具,幸运的是Golang语言本身就集成了性能分析工具pprof包,可以有效的分析程序CPU,MEM,Metux等指标。其中还可以通过第三方图形应用来更加直观的显示每个调用关系和指标占用情况。
演示环境
$ uname -a

Darwin 18.6. Darwin Kernel Version 18.6.: Thu Apr  :: PDT ; root:xnu-4903.261.~/RELEASE_X86_64 x86_64

$ go version

go version go1.12.4 darwin/amd64
下面我直接用Golang pprof官方提供的示例来演示下CPU和MEM的分析方法,以及集成出图工具后的各种效果。
CPU
var cpuprofile = flag.String("cpuprofile", "", "write cpu profile to file")

func main() {

    flag.Parse()

    if *cpuprofile != "" {

        f, err := os.Create(*cpuprofile)

        if err != nil {

            log.Fatal(err)

        }

        pprof.StartCPUProfile(f)

        defer pprof.StopCPUProfile()

    }

    ...
程序定义了一个cpuprofile的文件,用于保存程序的cpu prof信息。StartCPUProfile方法会将信息输出到cpuprofile文件中,程序退出前会调用StopCPUProfile方法,将缓存的信息一并(flush)刷到cpuprofile中。
$ go build havlak1.go

$ ./havlak1 -cpuprofile havlak1.prof

# of loops:  (including  artificial root node)

$ go tool pprof havlak1 havlak1.prof

File: havlak1

Type: cpu

Time: Jun ,  at :52pm (CST)

Duration: .81s, Total samples = .20s (129.67%)

Entering interactive mode (type "help" for commands, "o" for options)

(pprof) top

Showing nodes accounting for 11090ms, 57.76% of 19200ms total

Dropped  nodes (cum <= 96ms)

Showing top  nodes out of

      flat  flat%   sum%        cum   cum%

    2250ms 11.72% 11.72%     2550ms 13.28%  runtime.mapaccess1_fast64

    1830ms  9.53% 21.25%     4760ms 24.79%  runtime.scanobject

    1470ms  7.66% 28.91%     9250ms 48.18%  main.FindLoops

    1040ms  5.42% 34.32%     1040ms  5.42%  runtime.memmove

     880ms  4.58% 38.91%     3420ms 17.81%  runtime.mallocgc

     840ms  4.38% 43.28%     2660ms 13.85%  main.DFS

     800ms  4.17% 47.45%     1990ms 10.36%  runtime.mapassign_fast64ptr

     790ms  4.11% 51.56%     1020ms  5.31%  runtime.findObject

     600ms  3.12% 54.69%      760ms  3.96%  runtime.heapBitsSetType

     590ms  3.07% 57.76%      600ms  3.12%  runtime.pageIndexOf
输出top 10 表示的是显示最消耗cpu的10个函数调用。上述每列指标的含义为:
- flat 采样时,该函数正在运行的次数*采样频率(10ms),记得到估算的函数“运行时间”。不包含等待子函数返回的时间。
- flat% flat/总采样时间值,例如第一行的数据 2250ms/(19.2*1000)Total samples =11.72%。
- sum% 前面所有flat%的累加,所以第一行的sum%永远都是等于flat%,第二行21.25%=11.72%+9.53%。
- cum 采样时,该函数出现在调用堆栈的采样时间。包含等待子函数返回的时间。
- cum% cum/总采样时间值,例如第一行的数据 2550ms/(19.2*1000)Total samples =13.28%。
上述的文字比例显示说实话没有看出具体的调用关系,有没有更好的图形界面呢,答案是用web命令,前提是已经安装了图像处理软件graphviz,否则会报错:
(pprof) web

Failed to execute dot. Is Graphviz installed? Error: exec: "dot": executable file not found in $PATH

$ brew install graphviz

(pprof) web
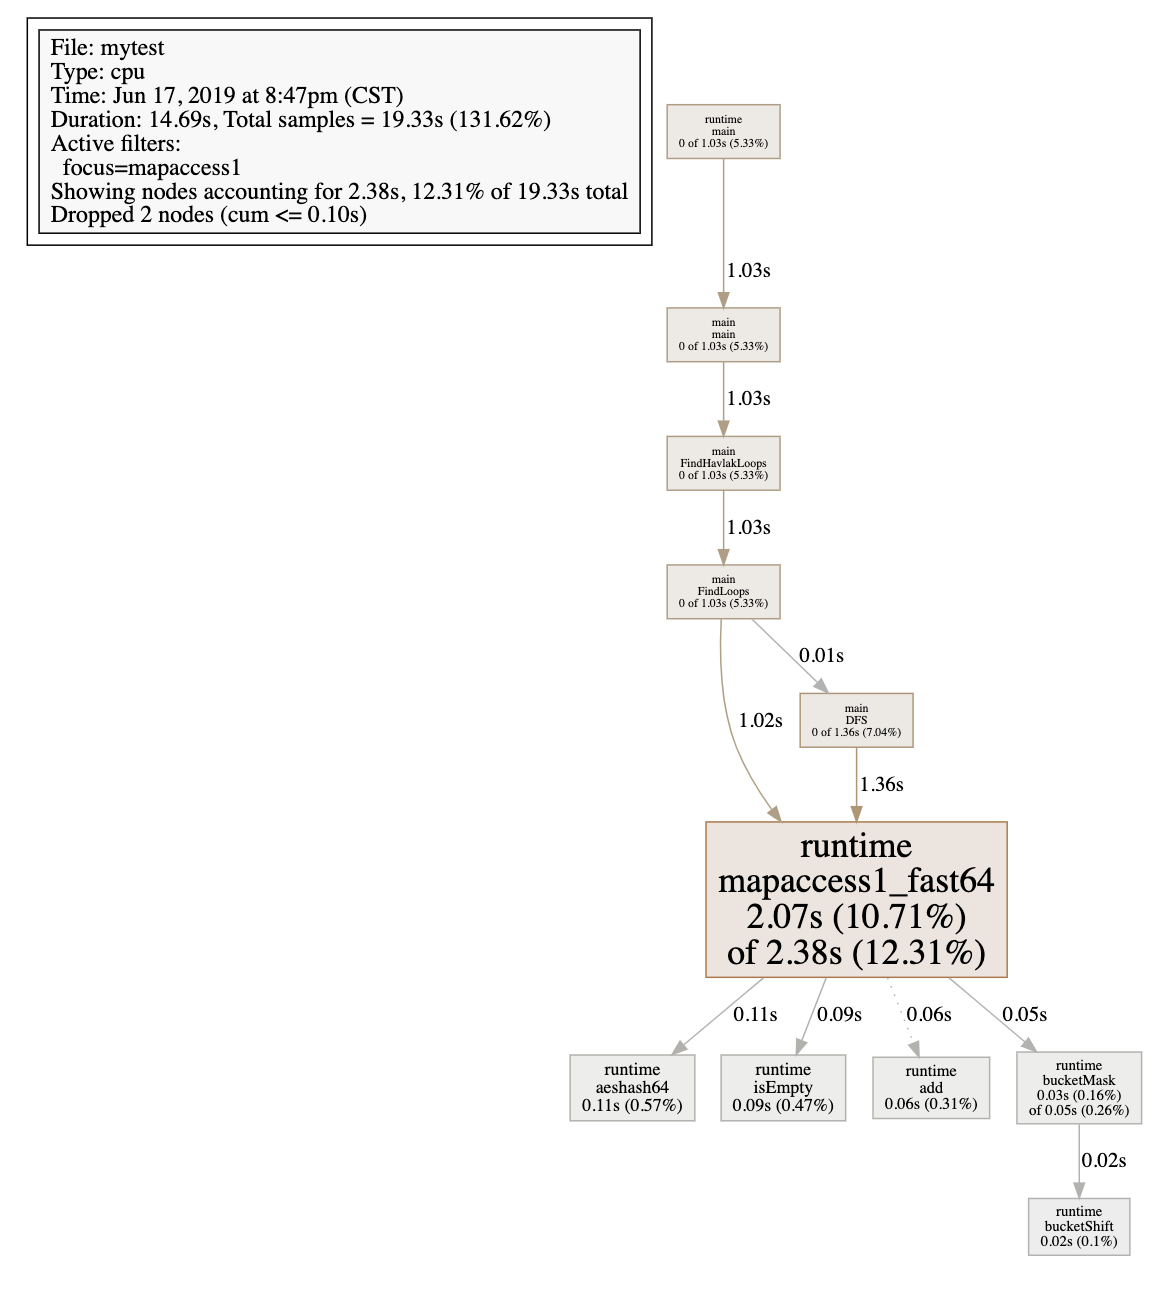
输入web命令后会自动唤起浏览器显示调用关系的图片:

但是这样全盘的调用关系老实将也是有点乱,可以通过--nodefraction=0.1把占用低于10%的关系不显示,也可以可以通过web mapaccess1 来查看runtime mapaccess1_fast64的单条调用关系链,会更加的聚焦和清晰。
其实上面的图形还是不够直观,最直观的调用关系和占比图是火焰图,但是火焰图需要依赖第三方火焰图生成工具,不是golang pprof自带的,步骤下:
- 安装火焰图生成工具 go-torch go get github.com/uber/go-torch
- 安装火焰图生成脚本 FlameGraph 进入到go-torch的bin路径执行
git clone https://github.com/brendangregg/FlameGraph.git,cd FlameGraph && mv * ../
u$ go-torch havlak1 havlak1.prof

INFO[::] Run pprof command: go tool pprof -raw -seconds  havlak1 havlak1.prof

INFO[::] Writing svg to torch.svg
在执行命令的当前目录下会生成一个torch.svg的文件,用浏览器打开如下:
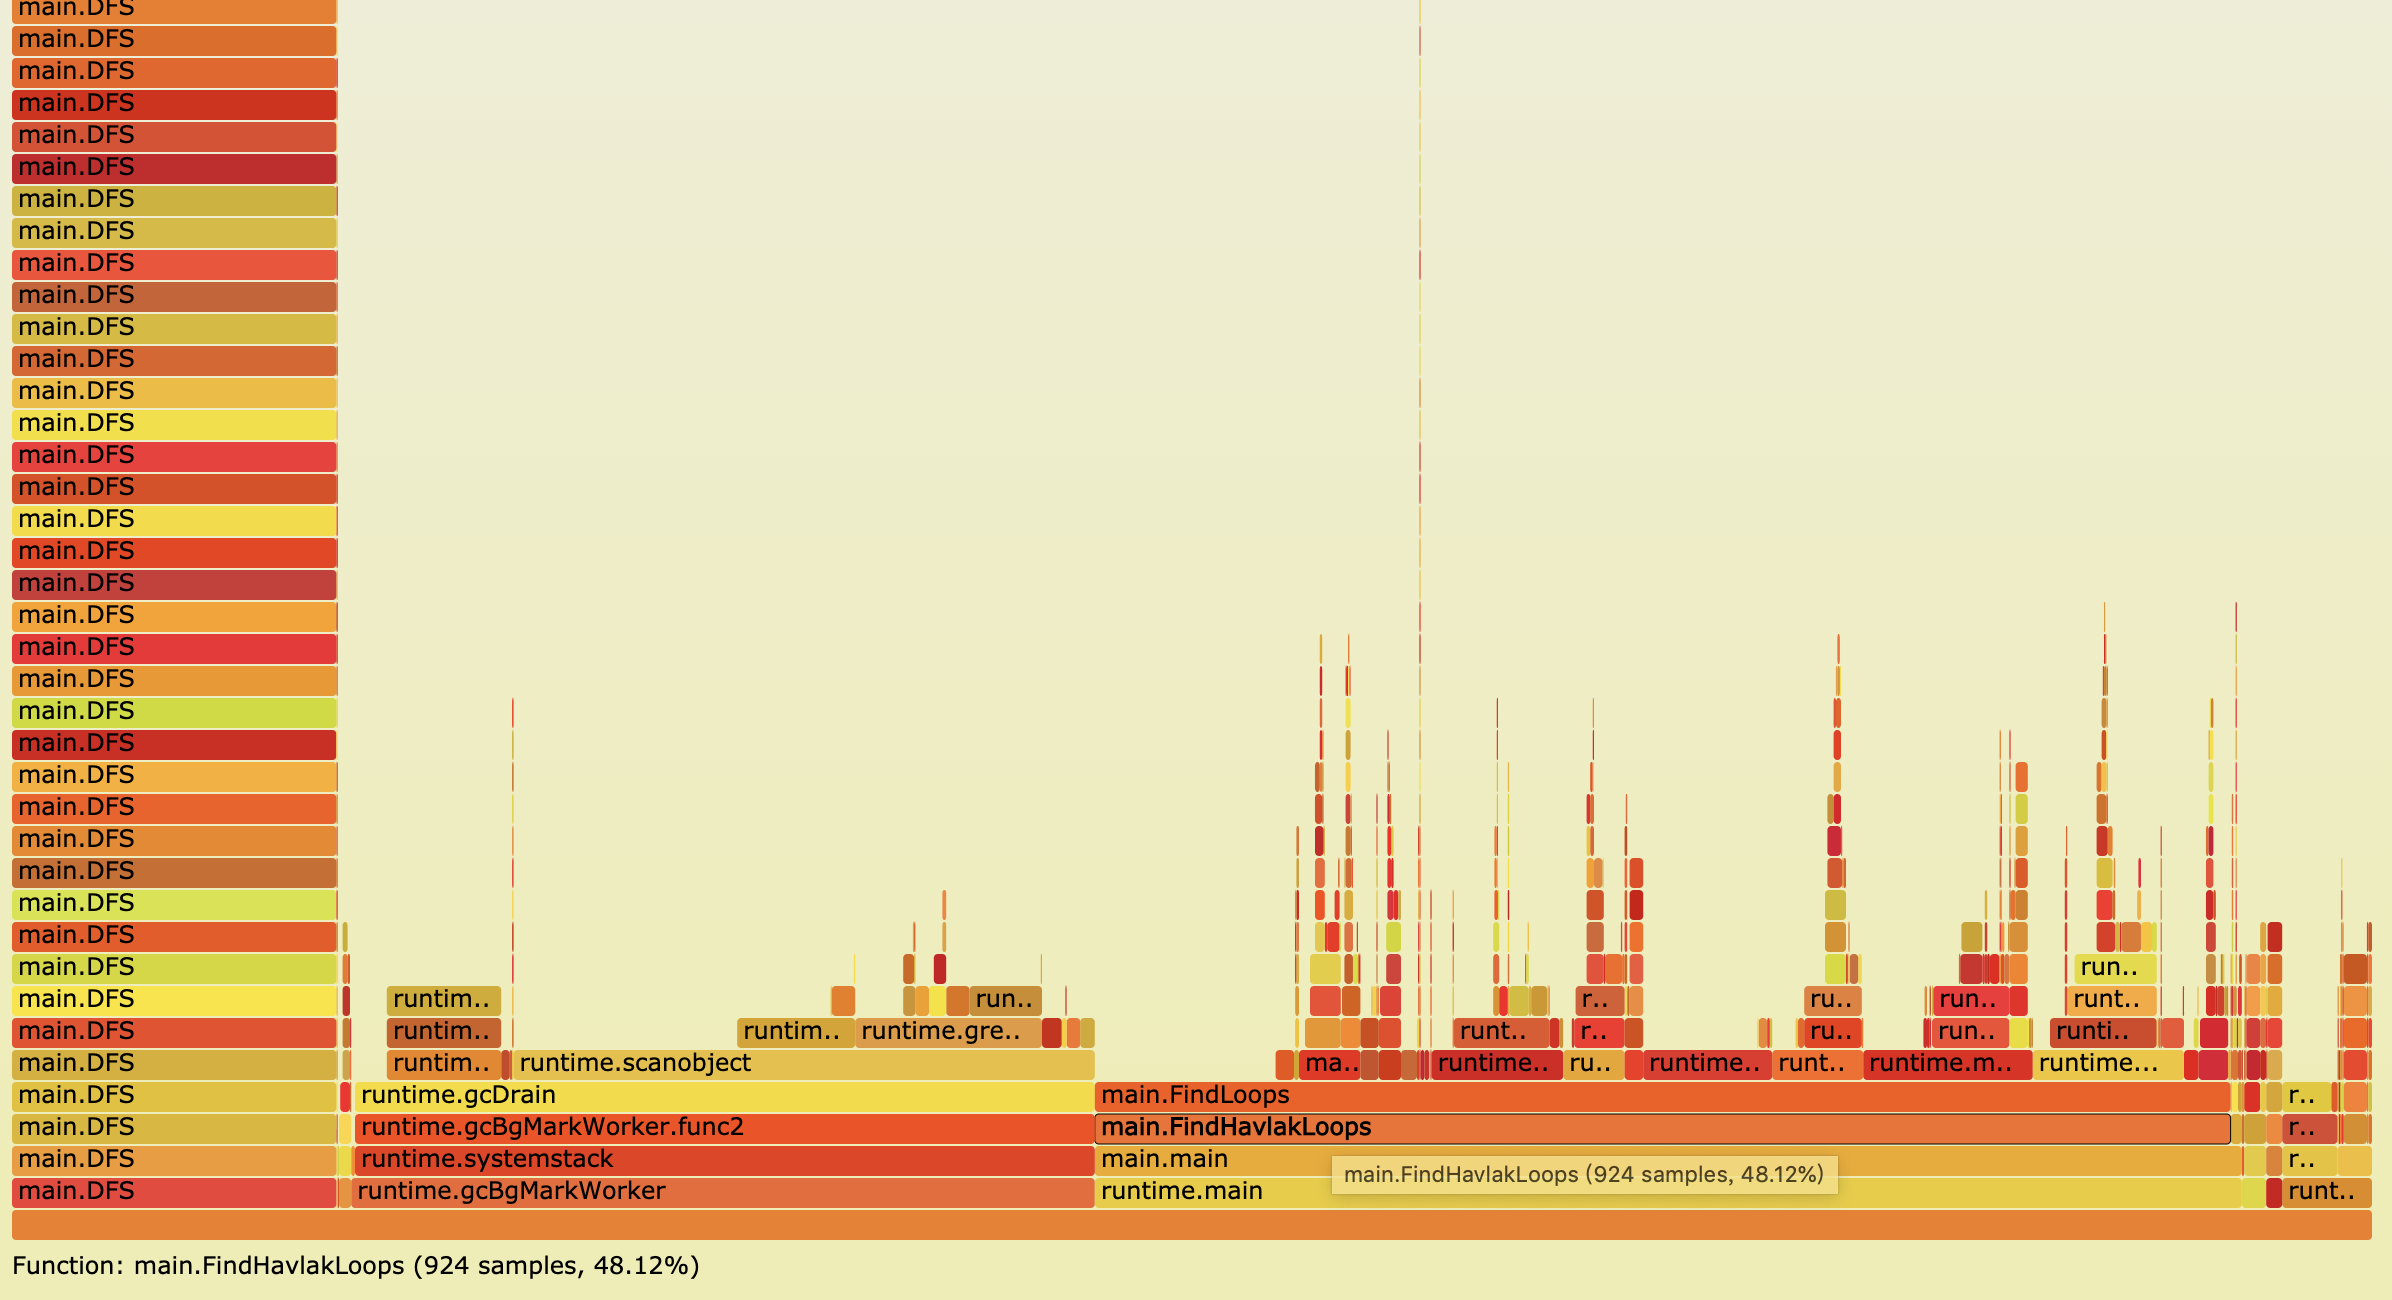
从底往上是一层层调用关系,长方格的长度表示占比。所以说调用关系和占比一目了然。
程序优化了DFS函数后的占用情况:
(pprof) top

Showing nodes accounting for 4410ms, 38.82% of 11360ms total

Dropped  nodes (cum <= .80ms)

Showing top  nodes out of

      flat  flat%   sum%        cum   cum%

    1230ms 10.83% 10.83%     3650ms 32.13%  runtime.scanobject

     950ms  8.36% 19.19%     5430ms 47.80%  main.FindLoops

     840ms  7.39% 26.58%      840ms  7.39%  runtime.memmove

     730ms  6.43% 33.01%     2680ms 23.59%  runtime.mallocgc

     660ms  5.81% 38.82%      810ms  7.13%  runtime.findObject

(pprof)
可以看出现在函数的主要消耗在内存的申请和回收上面(runtime.mallocgc)。为了找出为什么gc回收这么频繁,我们必须先找出究竟是哪里在频繁的申请内存。所以引入了下面的MEM章节。
MEM
var memprofile = flag.String("memprofile", "", "write memory profile to this file")

...

    FindHavlakLoops(cfgraph, lsgraph)

    if *memprofile != "" {

        f, err := os.Create(*memprofile)

        if err != nil {

            log.Fatal(err)

        }

        pprof.WriteHeapProfile(f)

        f.Close()

        return

    }
分析运行的结果:
$ go tool pprof havlak3 havlak3.prof

File: havlak3

Type: inuse_space

Time: Jun ,  at :05pm (CST)

Entering interactive mode (type "help" for commands, "o" for options)

(pprof) top5

Showing nodes accounting for .51MB, % of .51MB total

Showing top  nodes out of

      flat  flat%   sum%        cum   cum%

      18MB 52.17% 52.17%       18MB 52.17%  main.NewBasicBlock

    .72MB 28.16% 80.32%     .72MB 28.16%  main.FindLoops

       3MB  8.69% 89.02%        3MB  8.69%  main.(*BasicBlock).AddOutEdge

    .29MB  6.64% 95.65%    .29MB 58.80%  main.(*CFG).CreateNode

    .50MB  4.35%   %     .50MB  4.35%  main.(*BasicBlock).AddInEdge

(pprof)
显示具体的函数内部内存占用情况:
(pprof) list CreateNode

Total: .51MB

ROUTINE ======================== main.(*CFG).CreateNode in /Users/haiweilu/saas/src/awesomeProject/test/havlak3.go

    .29MB    .29MB (flat, cum) 58.80% of Total

         .          .     :    }

         .          .     :    if node != len(cfg.Blocks) {

         .          .     :        println("oops", node, len(cfg.Blocks))

         .          .     :        panic("wtf")

         .          .     :    }

         .       18MB     :    bblock := NewBasicBlock(node)

    .29MB     .29MB    :    cfg.Blocks = append(cfg.Blocks, bblock)

         .          .    :

         .          .    :    if len(cfg.Blocks) ==  {

         .          .    :        cfg.Start = bblock

         .          .    :    }

         .          .    :

(pprof) list FindLoops

Total: .51MB

ROUTINE ======================== main.FindLoops in /Users/haiweilu/saas/src/awesomeProject/test/havlak3.go

    .72MB     .72MB (flat, cum) 28.16% of Total

         .          .    :        return

         .          .    :    }

         .          .    :

         .          .    :    size := cfgraph.NumNodes()

         .          .    :

    .97MB     .97MB    :    nonBackPreds := make([]map[int]bool, size)

    .77MB     .77MB    :    backPreds := make([][]int, size)

         .          .    :

    .97MB     .97MB    :    number := make([]int, size)

         .          .    :    header := make([]int, size, size)

         .          .    :    types := make([]int, size, size)

         .          .    :    last := make([]int, size, size)

         .          .    :    nodes := make([]*UnionFindNode, size, size)

         .          .    :

(pprof)
可以看到程序又大量的临时变量的创建和销毁,导致了golang的gc机制频繁触发,从而导致CPU飙高。有gc机制的编程语言并不意味着可以忽略内存分配问题,这个问题的简单解决是保存一个全局的成员变量,避免内存的频繁申请和释放。
在线debug
package main

import (

    "net/http"

    _ "net/http/pprof"

)

func main()  {

    http.ListenAndServe("localhost:6060", nil)

}
通过浏览器debug:

通过go tool debug:
go tool pprof http://localhost:6060/debug/pprof/profile   # 30-second CPU profile

go tool pprof http://localhost:6060/debug/pprof/heap      # heap profile

go tool pprof http://localhost:6060/debug/pprof/block     # goroutine blocking profile
总结
本文讲解了go pprof包分析golang 程序 CPU和MEM的用法,其中包含文字界面,简单的web图形界面和火焰图,其实pprof还可以分析程序的其他指标,更多的技能解锁等待大家自行发现。
参考
https://blog.golang.org/profiling-go-programs
Golang程序性能分析的更多相关文章
- pprof进行golang程序性能分析
一.导入包 import _ "net/http/pprof" 二.启动监控routine go func() { http.ListenAndServe("0.0.0. ...
- Linux下的应用程序性能分析 总结
Linux下的应用程序性能分析,根据内核程序和应用程序的不同,下文分两类进行描述. 我们侧重的是应用级别的程序,推荐google perf tool/kcachegrind组合 一.和内核有关的工具 ...
- Linux程序性能分析和火焰图
Linux程序性能分析和火焰图 Linux程序的性能分析工具数量比较多,涉及到整个操作系统的方方面面,可能是开源的原因吧,相对于Windows来说丰富太多.其中应用分析性能方面Dtrace, Syst ...
- 八、jdk工具之JvisualVM、JvisualVM之二--Java程序性能分析工具Java VisualVM
目录 一.jdk工具之jps(JVM Process Status Tools)命令使用 二.jdk命令之javah命令(C Header and Stub File Generator) 三.jdk ...
- [golang]7种 Go 程序性能分析方法
视频信息 Seven ways to Profile Go Applicationsby Dave Cheneyat Golang UK Conf. 2016 视频:https://www.youtu ...
- Go1.5正式版程序性能分析小积累,实验环境windows64
方法一: 内存分配器跟踪:GODEBUG=allocfreetrace=1 调度器追踪 调度器追踪能够提供对 goroutine 调度的动态行为的内视,而且同意调试负载平衡和可扩展性问题.要启用调度器 ...
- 使用Golang进行性能分析(Profiling)
转自:http://www.cppblog.com/sunicdavy/archive/2015/04/11/210308.html 本文介绍游戏服务器的性能分析, web服务器性能分析不在本文分析范 ...
- python程序性能分析
中文:http://www.cnblogs.com/zhouej/archive/2012/03/25/2379646.html 英文:https://www.huyng.com/posts/pyth ...
- JAVA程序性能分析及调优浅析
1.性能分析本质 寻找系统的性能瓶颈(木桶理论/短板效应),并处理系统的性能瓶颈 2.性能分析主要指标负载.响应和服务器CPU\MEM等的使用率 3.性能分析主要工具 LoadRunner Visua ...
随机推荐
- hdu 2674(余数性质)
N!Again Time Limit: 2000/1000 MS (Java/Others) Memory Limit: 32768/32768 K (Java/Others)Total Sub ...
- interview ms1 robert move **
move 2turn rightmove 3turn rightmove 6 初始位置为(0,0),方向为north,求最后的位置. string2char: const char* t = sec ...
- Notepad++ 自动补全,括号自动完成插件,主题和字体设置
Notepad++ 自动补全成对符号http://rabbit52.com/2012/devel/notepad-autocomplete-brackets QuickText 和 Zen Codin ...
- C# 数组与 list 互相转换案例
在项目中用到了 随手分享下 记得点赞呦! 1,从System.String[]转到List<System.String>System.String[] str={"str&quo ...
- Android-Handler消息机制实现原理
一.消息机制流程简介 在应用启动的时候,会执行程序的入口函数main(),main()里面会创建一个Looper对象,然后通过这个Looper对象开启一个死循环,这个循环的工作是,不断的从消息队列Me ...
- ASP.NET 5已终结,迎来ASP.NET Core 1.0和.NET Core 1.0 转
作者:yourber 命名是非常困难的事情,微软这次为了和ASP.NET4.6做区分,采用了全新的命名方式ASP.NET Core 1.0,它是一个全新的框架. ASP.NET 在过去的 15 年里是 ...
- 基于WPF系统框架设计(10)-分页控件设计
背景 最近要求项目组成员开发一个通用的分页组件,要求是这个组件简单易用,通用性,兼容现有框架MVVM模式,可是最后给我提交的成果勉强能够用,却欠少灵活性和框架兼容性. 设计的基本思想 传入数据源,总页 ...
- Code signing is required for product type Unit Test Bundle in SDK iOS 8.0
I fixed the issue (temporarily) by going to Edit Scheme, then in the Build section, removing my unit ...
- 【Android】attr、style和theme
一.Attr 属性,风格样式的最小单元: Attr 的定义 在自定义 View 的时候,在 res/attrs.xml 文件中声明属性,而Android 系统的属性也是以同样的方式定义的.比如 lay ...
- 慕课网python进阶函数式编程学习记录
函数 不等于 函数式 函数: function 函数式: functional,一种编程范式 就好比计算机 不等于 计算 c语言: 函数 python :函数式(计算) 函数式编程特点: 把计算视为函 ...