dstat 监控工具
dstat 监控工具
安装
命令使用
dstat -h                                        # 帮助

dstat -tpcdrmgln                                # 屏幕刷新

dstat -tpcdrmgln                             # 5s刷新一次,刷新10次

nohup dstat -tpcdrmgln  --output dstat.csv &   # 将每5s的结果输出到csv ,可以放到后台跑
命令演示
1.屏幕输出

2. 记录到CSV文件
nohup dstat -tpcdrmgln --output dstat.csv &
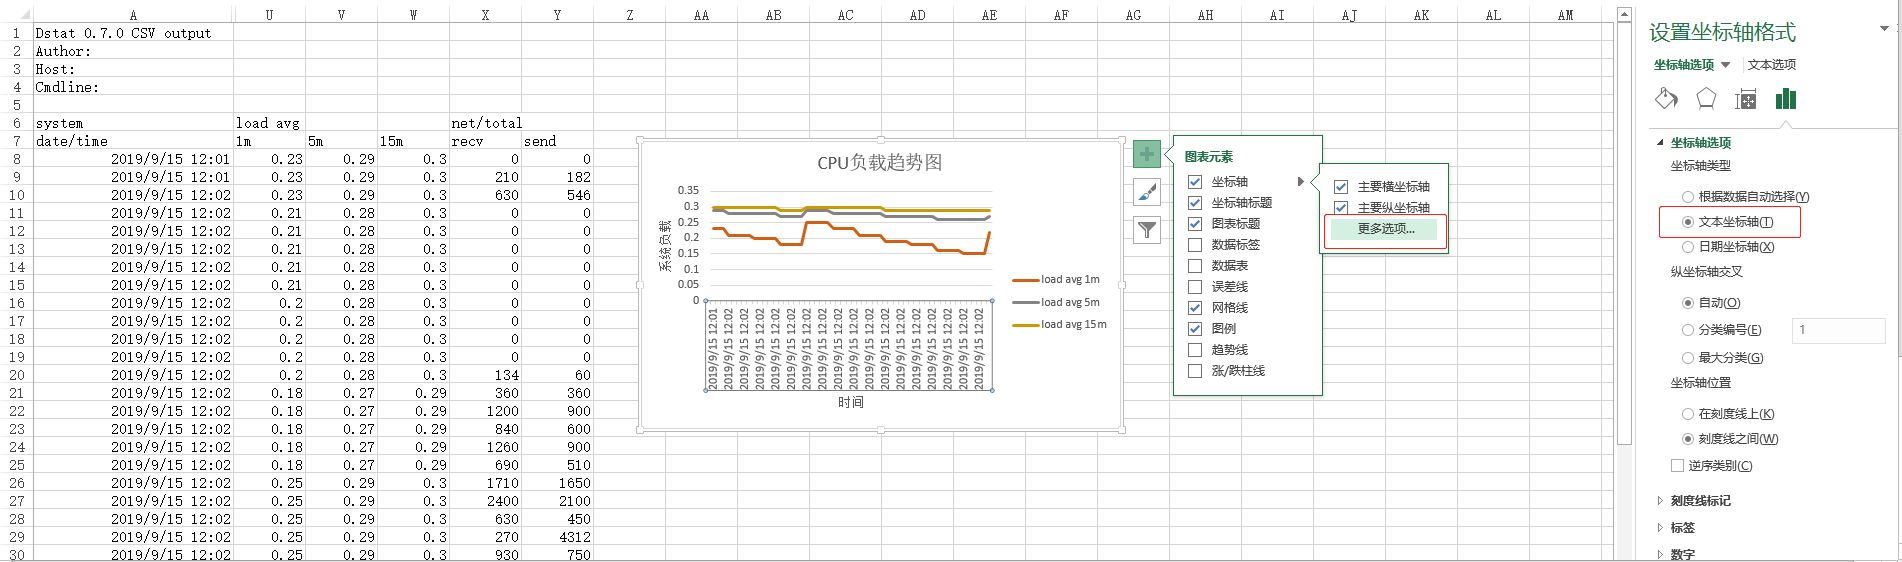
下载文件后,可用Excel生成趋势图表,类似:
帮助信息
[oracle@oracle ~]$ dstat -h

Usage: dstat [-afv] [options..] [delay [count]]

Versatile tool for generating system resource statistics

Dstat options:

  -c, --cpu              enable cpu stats

     -C ,,total           include cpu0, cpu3 and total

  -d, --disk             enable disk stats

     -D total,hda           include hda and total

  -g, --page             enable page stats

  -i, --int              enable interrupt stats

     -I ,eth2              include int5 and interrupt used by eth2

  -l, --load             enable load stats

  -m, --mem              enable memory stats

  -n, --net              enable network stats

     -N eth1,total          include eth1 and total

  -p, --proc             enable process stats

  -r, --io               enable io stats (I/O requests completed)

  -s, --swap             enable swap stats

     -S swap1,total         include swap1 and total

  -t, --time             enable time/date output

  -T, --epoch            enable time counter (seconds since epoch)

  -y, --sys              enable system stats

  --aio                  enable aio stats

  --fs, --filesystem     enable fs stats

  --ipc                  enable ipc stats

  --lock                 enable lock stats

  --raw                  enable raw stats

  --socket               enable socket stats

  --tcp                  enable tcp stats

  --udp                  enable udp stats

  --unix                 enable unix stats

  --vm                   enable vm stats

  --plugin-name          enable plugins by plugin name (see manual)

  --list                 list all available plugins

  -a, --all              equals -cdngy (default)

  -f, --full             automatically expand -C, -D, -I, -N and -S lists

  -v, --vmstat           equals -pmgdsc -D total

  --bw, --blackonwhite   change colors for white background terminal

  --float                force float values on screen

  --integer              force integer values on screen

  --nocolor              disable colors (implies --noupdate)

  --noheaders            disable repetitive headers

  --noupdate             disable intermediate updates

  --output file          write CSV output to file

delay is the delay in seconds between each update (default: )

count is the number of updates to display before exiting (default: unlimited)
dstat 监控工具的更多相关文章
- 【转】Linux终端下 dstat 监控工具
转自https://linux.cn/article-3215-1.html dstat 是一个可以取代vmstat,iostat,netstat和ifstat这些命令的多功能产品.dstat克服了这 ...
- Linux终端下 dstat 监控工具
dstat 是一个可以取代vmstat,iostat,netstat和ifstat这些命令的多功能产品.dstat克服了这些命令的局限并增加了一些另外的功能,增加了监控项,也变得更灵活了.dstat可 ...
- dstat 服务器性能查看命令【转】
一. 安装和简解 # yum -y install dstat# dstat CPU状态:CPU的使用率.这项报告更有趣的部分是显示了用户,系统和空闲部分,这更好地分析了CPU当前的使用状况.如果你看 ...
- dstat命令详解
dstat 如果系统没有些工具 yum -y install dstat安装下即妥,此软件小巧玲珑,软件包大小只有144k,安装大小660k. 此工具默认情况下会动态显示CPU,disk,net,pa ...
- Htop/Glances/Dstat性能测试系统监控工具领域的瑞士军刀
原文链接:https://mp.weixin.qq.com/s/TvfzIy4uXHPOFQ1h5Q4KWg 建议点击原文链接查看 续上篇分享的[性能测试工具],今天整理了常用的系统监控工具,当然有特 ...
- 全能系统监控工具dstat
一.什么是dstat? 通过man帮助,可以看到官方对dstat的定义为:多功能系统资源统计生成工具( versatile tool for generating system resource st ...
- Linux终端监控工具之dstat
1.安装 yum install dstat 2.示例 1)直接跟数字,表示#秒收集一次数据,默认为一秒:dstat 5表示5秒更新一次 这是默认输出显示的信息: CPU状态:CPU的使用率.这项报告 ...
- 你值得拥有:25个Linux性能监控工具
一.基于命令行的性能监控工具 1.dstat - 多类型资源统计工具 该命令整合了vmstat,iostat和ifstat三种命令.同时增加了新的特性和功能可以让你能及时看到各种的资源使用情况,从而能 ...
- 80 多个 Linux 系统管理员的监控工具
原文出处: serverdensity 译文出处:Linux中国 随着互联网行业的不断发展,各种监控工具多得不可胜数.这里列出网上最全的监控工具.让你可以拥有超过80种方式来管理你的机器.在本文中 ...
随机推荐
- iOS App Store网址的命名规则
App Store 命名规则:https://itunes.apple.com/cn/app/ + 拼音(最多6个,全部小写,空格要-) + /id +appID 一些参考实例: http:// ...
- 报错:(未解决)Opening socket connection to server master/192.168.52.26:2181. Will not attempt to authenticate using SASL (unknown error)
报错背景: CDH集群中,将kafka和Flume整合,将kafka的数据发送给Flume消费. 启动kafka的时候正常,但是启动Flume的时候出现了报错现象. 报错现象: DH--.cdh5./ ...
- antd 用 customize-cra 方式引入 sass
antd 用 customize-cra 方式引入 sass 只需要安装:node-sass 即可
- 【Leetcode_easy】1160. Find Words That Can Be Formed by Characters
problem 1160. Find Words That Can Be Formed by Characters solution class Solution { public: int coun ...
- webpack 4 教程
webpack 4 教程:https://blog.zfanw.com/webpack-tutorial/
- sql 表的连接与查找
A.left outer join: 左外连接(左连接):结果集几包括连接表的匹配行,也包括左连接表的所有行. SQL: select a.a, a.b, a.c, b.c, b.d, b.f fro ...
- Eclipse 常用配置和基本调试
常用配置 1.显示行号:window->Preferences->General->Editors->Text Editors , 勾选show line numbers 2. ...
- (3)Spring Boot日志
文章目录 选择哪一种日志框架 日志的使用 Spring Boot 日志使用 选择哪一种日志框架 市面上日志门面有: JCL(Jakart Commons Logging) .SLF4J(Simple ...
- vs2017环境下python包的安装
1)---vs已经下载了的才适用 1,鼠标放在右侧窗口python环境那里(如没有窗口,可点击最上方的“窗口”-“重置窗口”) 2,右键然后点击“查看所有python环境”,会弹出当前默认的环境(高亮 ...
- stm32f103的低功耗开启和关闭
stm32f103低功耗分为WFI等待中断和WFE等待事件,我只用到等待中断,这里没有细究. 待机模式最低功耗2uA,只有备份寄存器和待机电路供电,PLL,HSI,HSE断开,寄存器和SRAM复位,除 ...