[转]Comparing sFlow and NetFlow in a vSwitch
As virtualization shifts the network edge from top of rack switches to software virtual switches running on the hypervisors; visibility in the virtual switching layer is essential in order to provide network, server and storage management teams with the information needed to coordinate resources and ensure optimal performance.
The recent release of Citrix XenServer 6.0 provides an opportunity for a side-by-side comparison of sFlow and NetFlow monitoring technologies since both protocols are supported by the Open vSwitch that is now the default XenServer network stack.
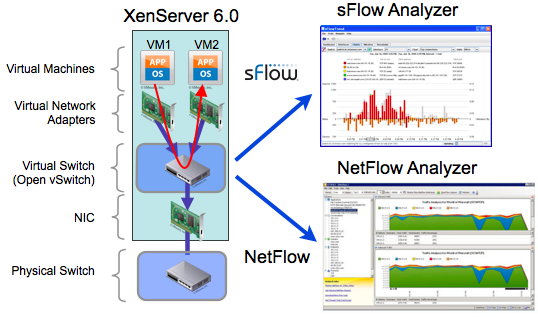
The diagram above shows the experimental setup. Traffic between the virtual machines VM1 and VM2 passes through the Virtual Switch where sFlow and NetFlow measurements are simultaneously generated. The sFlow is sent to an sFlow Analyzer (InMon sFlowTrend) and the NetFlow to a NetFlow Analyzer (SolarWinds Real-Time NetFlow Analyzer). Both tools are running in tandem making it is easy to perform side by side comparisons to see differences in the visibility that NetFlow and sFlow provide into the same underlying traffic.
Note: XenServer 6.0, sFlowTrend and Real-Time NetFlow Analyzer are all available at no charge, making it easy for anyone to reproduce these tests.
Configuration
The Host sFlow supplemental pack was installed to automate sFlow configuration of the Open vSwitch and to export standard sFlow Host metrics. The following /etc/hsflowd.conf file sets the packet sampling rate to 1-in-400, counter polling interval to 20 seconds and sends sFlow to sFlowTrend running on host 10.0.0.42 and listening on UDP port 6343.
sflow{

  DNSSD = off

  polling = 20

  sampling = 400

  collector{

    ip = 10.0.0.42

    udpport = 6343

  }

}
The following command was used to manually configure NetFlow monitoring, sending NetFlow to the Real-Time NetFlow Analyzer running on host 10.0.0.42 and listening on UDP port 2055:
ovs−vsctl −− set Bridge xenbr0 netflow=@nf \

−− −−id=@nf create NetFlow targets=\"10.0.0.42:2055\" active−timeout=60
Results
The following charts show the top protocols measured using sFlow and NetFlow:
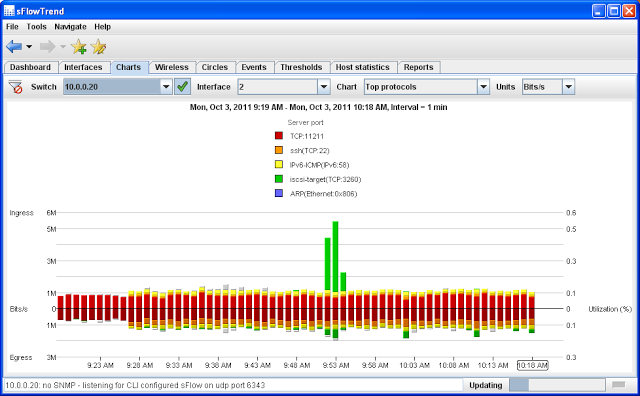
Top Protocols in sFlowTrend
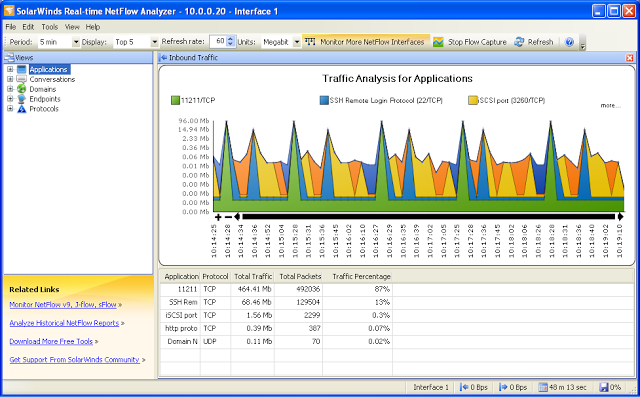
Top Protocols in Real-Time NetFlow Analyzer
Looking at the two charts, both show similar average traffic levels. The sFlowTrend chart shows the ingress Memcache (TCP:11211) traffic at between 0.7 and 0.9 Mb/s. Looking at the Real-time NetFlow Analyzer total traffic table, 464.41Mb were seen over the last 11 minutes 47 seconds, giving an average rate of 0.66 Mb/s. The sFlowTrend measurements are consistently higher since they include the bandwidth consumed by layer 2 headers whereas NetFlow only reports on layer 3 bytes. However, the layer 2 overhead can be estimated by assuming that an additional 18 bytes per packet (MAC source, MAC destination, type and CRC) and multiplying by the total packets count (492,036), resulting in an additional 0.1 Mb/s which brings the NetFlow measurement to 0.76Mb/s, putting it into agreement with the sFlow measurements.
Note: The overhead associated with Ethernet headers and tunneling protocols can represent a significant fraction of overall bandwidth. By exporting packet headers, sFlow provides detailed information on the encapsulations and their overhead. NetFlow does not provide a direct measure of total bandwidth.
The periodic, 60 second, spikes in traffic shown on the NetFlow Analyzer chart are an artifact of the way NetFlow reports on long running connections. With NetFlow, packet and byte counters are maintained for each connection in a flow cache within the switch. When the connection terminates, a flow record is generated containing the connection information and counters. The active-timeout setting in the NetFlow configuration is used to ensure visibility into long running connections, causing the switch to periodically export NetFlow records for active connections. In contrast, sFlow does not use a flow cache, instead sampled packet headers are continually exported, resulting in real-time charts that more accurately reflect the traffic trend.
In addition, exporting packet headers allows an sFlow analyzer to monitor all types of traffic flowing across the switch; note the ARP and IPv6 traffic displayed in sFlowTrend in addition to the TCP/UDP flows. Visibility into layer 2 traffic is particularly important in switched environments where protocols such as DHCP/BOOTP, STP, LLDP and ARP need to be closely managed. sFlow also provides visibility into networked storage, including Ethernet SAN technologies (e.g. FCoE or AoE), that typically dominates bandwidth usage in the data center. Looking forward, there are a number of tunneling protocols being developed to connect virtual switches, including: GRE, mpls, VPLS, VXLAN and NVGRE. As new protocols are deployed on the network they are easily monitored without any change to exiting sFlow agents ensuring end-to-end visibility across the physical and virtual network.
In contrast, NetFlow relies on the switch to decode the traffic. In this case the switch is exporting NetFlow version 5 which only exports records for IPv4 traffic. The NetFlow analyzer is thus only able to report on IPv4 protocols, all other traffic is invisible. This limitation is not unique to Open vSwitch; NetFlow version 5 is the most widely supported version of NetFlow in network devices and is also the version exported by VMware vSphere 5.0.
The next two charts show top connections flowing through the virtual switch:
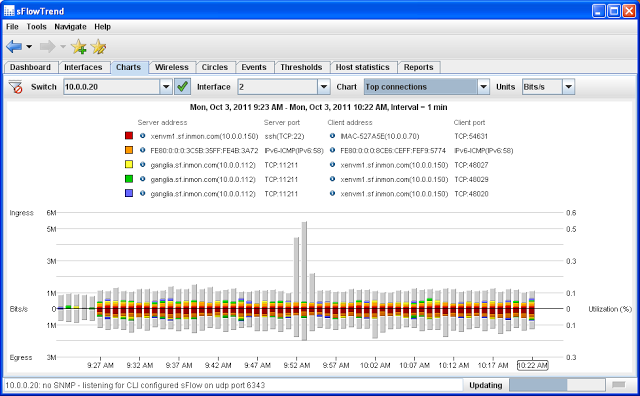
Top Connections in sFlowTrend

Top Connections in Real-Time NetFlow Analyzer
The Top Connections charts further demonstrate the limitation in NetFlow visibility where only IPv4 flows are shown. The sFlow analyzer is able to report in detail on all types of traffic flowing through the switch, in this case showing details of IPv6 traffic in addition to IPv4 flows.
The next two charts show interface utilization and packet counts from sFlowTrend:
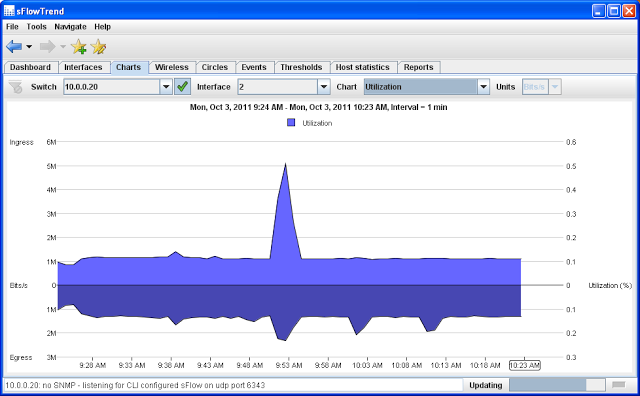
Link Utilization in sFlowTrend
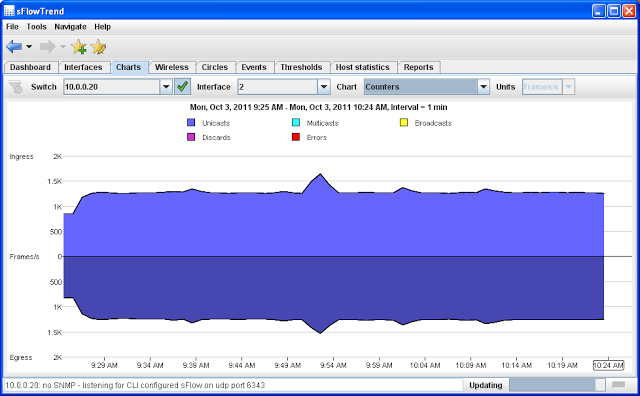
Link Counters in sFlowTrend
This type of interface trending is a staple of network management, but obtaining the information is challenging in virtual environments. While SNMP is typically used to obtain this information from network equipment, servers are much less likely to be managed using SNMP and so SNMP polling is often not an option. In addition, there may be large numbers of virtual ports associated with each physical switch port. In a virtual environment with 10,000 physical switch ports you might need to monitor as many as 200,000 virtual ports. Even if SNMP agents were installed on all the servers, SNMP polling does not scale well to large numbers of interfaces. The integrated counter polling mechanism built into sFlow provides scalable monitoring of the utilization of every switch port in the network, both physical and virtual, quickly identifying problems wherever they may occur in the network.
In contrast, NetFlow only reports on traffic flows so neither of these charts is available in the NetFlow Analyzer. The remaining charts are based on sFlow counter data so there are no corresponding NetFlow Analyzer charts.
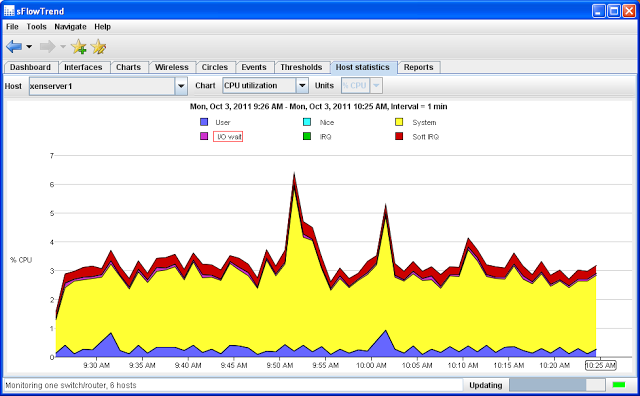
The next sFlowTrend chart shows the CPU load on the hypervisor:
Hypervisor CPU in sFlowTrend
The virtual switch is a software component running on the hypervisor, thus if the hypervisor is overloaded, then network performance will degrade. The sFlow counter polling mechanism extends to system performance counters in addition to the interface counters shown earlier, allowing the sFlow analyzer to display hypervisor CPU utilization. In this case the chart shows a small spike in system CPU utilization corresponds to the spike in traffic at 9:52AM.
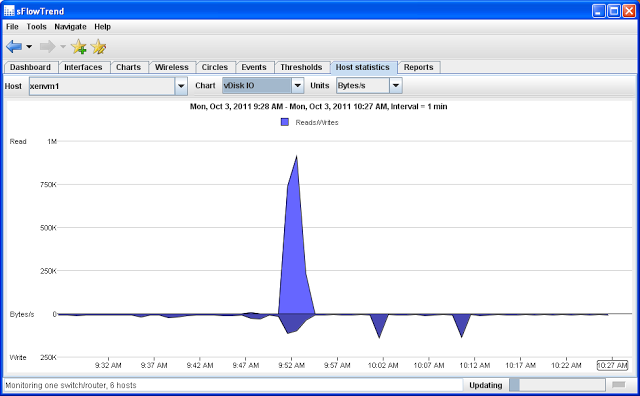
The next sFlowTrend chart shows a trend in disk IO on the virtual machine:
Virtual Machine Disk IO in sFlowTrend
This chart shows that the burst in iSCSI traffic shown in the Top Protocols chart corresponds to a spike in read activity on the virtual machine. Again, sFlow's counter push mechanism efficiently exports information about the performance of virtual machines, allowing the interaction between network and system activity to be understood.
Comments
NetFlow provides limited visibility, focusing on layer 3 network connections. The NetFlow architecture relies on complex functionality within the switches and the complexity of configuring and maintaining NetFlow adds to operational costs and limits scalability. For example, gaining visibility into IPv6 traffic requires firmware (and often hardware) upgrades to the network infrastructure that can be challenging in large scale, always-on, cloud environments.
In contrast, adding support for additional protocols in sFlow requires no change to the network infrastructure, but is simply a matter of upgrading the sFlow analyzer. The sFlow architecture eliminates complexity from the agents, increasing scalability and reducing the operational costs associated with configuration and maintenance. sFlow provides comprehensive visibility into network and system resources needed to manage performance in virtualized and cloud environments.
[转]Comparing sFlow and NetFlow in a vSwitch的更多相关文章
- [转]Rapidly detecting large flows, sFlow vs. NetFlow/IPFIX
Figure 1: Low latency software defined networking control loop The articles SDN and delay and Delay ...
- 别以为真懂Openstack: 虚拟机创建的50个步骤和100个知识点(4)
六.Libvirt 对于Libvirt,在启动虚拟机之前,首先需要define虚拟机,是一个XML格式的文件 列出所有的Instance # virsh list Id Name ...
- Go 语言相关的优秀框架,库及软件列表
If you see a package or project here that is no longer maintained or is not a good fit, please submi ...
- Awesome Go精选的Go框架,库和软件的精选清单.A curated list of awesome Go frameworks, libraries and software
Awesome Go financial support to Awesome Go A curated list of awesome Go frameworks, libraries a ...
- 干货分享: 长达150页的openvswitch的ppt,不实验无真相
下载链接: Openvswitch实验教程 http://files.cnblogs.com/popsuper1982/Openvswtich.pptx 一.概论 Software Defined N ...
- Openvswitch手册(3): sFlow, netFlow
这一节,我们重点看sFlow 采样流sFlow(Sampled Flow)是一种基于报文采样的网络流量监控技术,主要用于对网络流量进行统计分析. sFlow系统包含一个嵌入在设备中的sFlow Age ...
- Open vSwitch安装及配置
一. Open vSwitch简介 1.1概述 Open vSwitch是一个高质量的.多层虚拟交换机,使用开源Apache 2.0许可协议,由Nicira Networks开发,主要实现代码为可移植 ...
- [cloud][OVS][sdn] Open vSwitch 初步了解
What is Open vSwitch? Open vSwitch is a production quality, multilayer virtual switch licensed under ...
- sFlow
http://www.sflow.org/developers/specifications.php http://www.inmon.com/technology/index.php sFlow s ...
随机推荐
- Mac编译RocketMQ 4.1.0
参考:https://my.oschina.net/jayronwang/blog/861396 1. 前提先安装并设置好maven,jdk,git,这个网上有很多教程,就不讲了 2. 下载rocke ...
- L2-018 多项式A除以B(模拟)
这仍然是一道关于A/B的题,只不过A和B都换成了多项式.你需要计算两个多项式相除的商Q和余R,其中R的阶数必须小于B的阶数. 输入格式: 输入分两行,每行给出一个非零多项式,先给出A,再给出B.每行的 ...
- WMI参数介绍
Win32_DiskDrive 硬盘 参数说明 vailability --设备的状态.BytesPerSector --在每个扇区的物理磁盘驱动器的字节数.Capabilities --媒体访 ...
- java实验环境搭建,eclise下载与使用
一.1.官方下载地址:http://www.oracle.com/technetwork/java/javase/downloads/index.html 下载后安装,默认安装即可. 2.在 wind ...
- Vue.$nextTick
`Vue.nextTick(callback)`,当数据发生变化,更新后执行回调. `Vue.$nextTick(callback)`,当dom发生变化,更新后执行的回调
- matplotlib 初次编译无法运行
终端 解决方案:vim ~/.matplotlib/matplotlibrc 输入backend: TkAgg 保存
- java socket编程(一)简介
#Java TCP Ip编程 其实下面几张图片就可以解释简单解释tcp-ip协议的大体流程了. ###计算机网络,分组报文和协议 网络是一组通过通信信道相互连接的机器组成. 组与组之间通过路由器连接 ...
- [转]JSOUP 抓取HTTPS/HTTP网页,校验问题
针对一般的http请求是不需要的校验的.但是https安全校验过总过不去.最后找到以下方法,终于成功. 让我们的站点信任所有站点,不需要引包,系统自带ssl证书校验,话不多数,贴代码. /** * 信 ...
- django2.0 + python3.6 在centos7 下部署生产环境的一些注意事项
一:mysql 与环境选用的坑 目前, 在生产环境部署django有三种方式: 1. apache + mod_wsgi 2. nginx + uwsigi 3. nginx + supervisor ...
- 【第一次作业】&&软件工程大一班---甘昀
这个作业属于哪个课程: <课程的链接点这里> 这个作业要求在哪里: <作业要求的链接点这里> 我在这个课程的目标是: 学会软件开发的流程和思想 这个作业在哪个具体方面帮助我 ...