[翻译]:SQL死锁-阻塞探测
到了这篇,才是真正动手解决问题的时候,有了死锁之后就要分析死锁的原因,具体就是需要定位到具体的SQL语句上。那么如何发现产生死锁的问题本质呢?下面这篇讲的非常细了,还提到了不少实用的SQL,但对我个人来讲,前半部分基本就够用,可以指出死锁的原因,至于后面那些有兴趣可以多研究研究。
As we already know, usually blocking happens due non-optimized queries. But how to detect queries that need to be optimized? Of course, in case of severe issues, we can analyze the queries that timeouts on the client side, but it gives us only the worst cases – with default settings it would show the queries that ran for more than 30 seconds.
现在我们已经知道阻塞是因为未经过优化的查询造成的,但是如何去探测我们有哪些语句是需要优化的呢?当然,在非常严重的情况下,我们可以分析在客户端执行超时的查询,但它只提醒在默认设置下的超时。
So, what can we do? Keeping various monitoring software out of scope, there are 2 simple methods to do the troubleshooting. First one is Blocking Process Report and second one is DMV. Let’s start with the first one.
我们能做什么呢?这里有两种解决方法:第一是Blocking process report ,第二是利用DMV。我们先看简单点的Blocking Process report。
注:我个人也比较喜欢这个,没有专业的SQL语句,提供图形化的操作界面。
Blocking process report provides you nice XML with information about sessions involved in the blocking. But first, you have to set Blocked Process Threshold with the following commands:
要查看Blocking process report呢,我们需要有一个的权限,需要拥有Sysadmin的权限,然后再设置一些系统配置。Blocking process report提供了非常友好的信息,里面包含有和阻塞相关的会话信息。
EXECUTE sp_configure 'show advanced options', 1
GO
RECONFIGURE
GO
EXECUTE sp_configure 'blocked process threshold', 5 -- in seconds.
GO
RECONFIGURE
GO
EXECUTE sp_configure 'show advanced options', 0
GO
RECONFIGURE
GO
Of course, you should think what threshold you want to use and balance between a lot or very few events reported. I’d suggest to start with threshold of 5 seconds – if you have processes that are blocked for more than 5 seconds there is the good chance that deadlock monitor is constantly running. There are 2 things to keep in mind. First – SQL does the good job trying to monitor the blocking and generate blocked processes report, but it does not guarantee that it will do it all the time. E.g. it does the check when it has available resources to do so. Secondary, if you have process blocked for a long time, SQL generates report on every try. I.e. if you have threshold equal to 5 seconds, you will get the different reports for the same blocked condition after 5 seconds, 10 seconds and so on.
After you set that threshold, the next step is to run SQL Server Profiler and setup the trace with only 1 event: “Blocked process report”. You can do it in UI:

But the better way to run server side trace. You can export trace definition and run the script to do that.

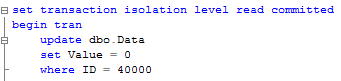
I’m not going to focus on the details how to set it up – you can find information in Books Online. So let’s see what information that trace produces. Let’s run the blocking script from my previous post. In one session let’s run the update in uncommitted transaction (X lock on the row):
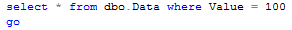
In another session let’s run select that introduces table scan:
Blocked process trace generates the report with following XML.

It has 2 elements: blocked-process and blocking-process. Simple case has just 2 processes involved but in real life it could be more complicated – Process A can block Process B and same time be blocked by Process C. That leads to the multiple events in the trace.
Let’s take a quick look at the details. First of all, you can see the status (red lines). Blocked process has the status of “Suspended”. Blocking process status is more interesting. “Sleeping” status indicates that process is waiting for the next command. Most likely it’s the sign of incorrect transaction handling on the client. Think about situation when client starts transaction when user opens the form, update data when user does some changes and commit or rollback it when user clicks on SAVE or CANCEL button.
Next, blocking report shows quite a few details about processes itself (Green lines). SPID, login, host, client app, etc. It also includes the information (Blue lines) about transaction isolation level, lock mode requested as well as point to resource that is locked. If you need, you can trace it down to specific row although I found that it’s rarely needed.
But most interesting are execution stacks and buffers (Pink blocks). For Ad-hoc sql you can see actual SQL involved in the locking. The situation is a little bit more complicated when stored procedures are involved. Let’s take a look. First, let’s create the simple procedure that replaces this update statement:
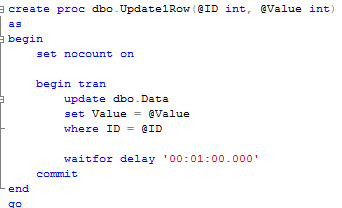
Next, let’s run this SP and select statement again. Make sure you commit or rollback transaction from the previous example first. Here is the blocking report:
As you can see in the blocking report, it does not show you what statement caused the blocking. In order to get it, you can use SQLHandle from the top statement in the execution stack and sys.dm_exec_sql_text data management function. Let’s see that:
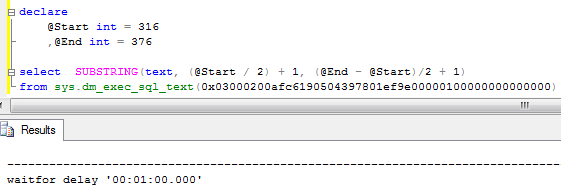
You can either count the line based on the trace value or find the actual statement based on offsets. It worth to mention that this could return different statement that the one that acquired the lock.
That method has one major drawback – statement needs to be in the cache in order at the time when you call sys.dm_exec_sql_text function. Alternative and better method to obtain blocked process report is using extended events (SQL Server 2008+). While it returns the same data, event is triggered at the time of the blocking, so you can analyze/query the system at the time of the blocking. But it’s far more complex to setup and out of the scope for now.
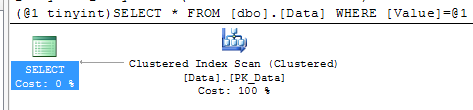
After you find the statements involved in the blocking, you can analyze while blocking occurs. As I mentioned before, the chance is that there are scans involved. You can use management studio and see execution plan there. Alternatively I found that those queries are quite often become one of the biggest IO consumers in the system, so you’ll see them if you analyze sys.dm_query_exec_stats data management view. You can use the script below. If query is there – just click on the plan and you’re all set.
SELECT TOP 50
SUBSTRING(qt.TEXT, (qs.statement_start_offset/2)+1,
((
CASE qs.statement_end_offset
WHEN -1 THEN DATALENGTH(qt.TEXT)
ELSE qs.statement_end_offset
END - qs.statement_start_offset)/2)+1),
qp.query_plan,
qs.execution_count,
(qs.total_logical_reads + qs.total_logical_writes) / qs.execution_count as [Avg IO],
qs.total_logical_reads, qs.last_logical_reads,
qs.total_logical_writes, qs.last_logical_writes,
qs.total_worker_time,
qs.last_worker_time,
qs.total_elapsed_time/1000 total_elapsed_time_in_ms,
qs.last_elapsed_time/1000 last_elapsed_time_in_ms,
qs.last_execution_time
FROM
sys.dm_exec_query_stats qs
CROSS APPLY sys.dm_exec_sql_text(qs.sql_handle) qt
CROSS APPLY sys.dm_exec_query_plan(qs.plan_handle) qp
ORDER BY
[Avg IO] DESC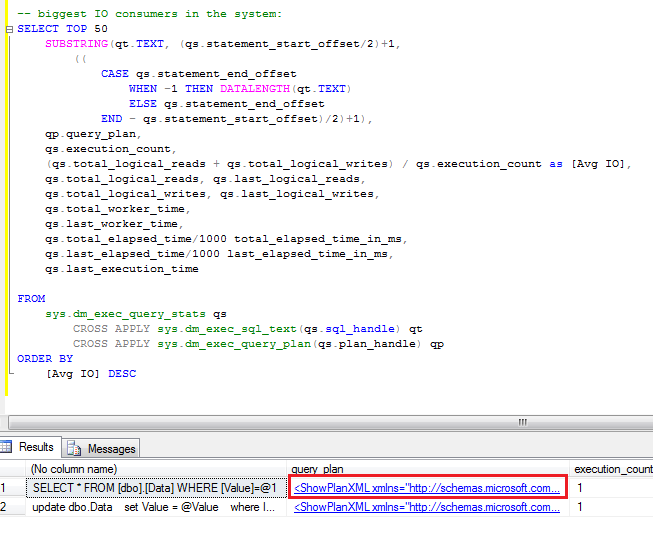
Blocking process report is extremely useful when you need to collect information about blocking. Although, if you need to look what happens in the system right now, you can use sys.dm_tran_locks data management view. I’ll show you 2 scripts below.
The first one gives you the list of the locks system has right now:
select
TL1.resource_type
,DB_NAME(TL1.resource_database_id) as [DB Name]
,CASE TL1.resource_type
WHEN 'OBJECT' THEN OBJECT_NAME(TL1.resource_associated_entity_id, TL1.resource_database_id)
WHEN 'DATABASE' THEN 'DB'
ELSE
CASE
WHEN TL1.resource_database_id = DB_ID()
THEN
(
select OBJECT_NAME(object_id, TL1.resource_database_id)
from sys.partitions
where hobt_id = TL1.resource_associated_entity_id
)
ELSE
'(Run under DB context)'
END
END as ObjectName
,TL1.resource_description
,TL1.request_session_id
,TL1.request_mode
,TL1.request_status
,WT.wait_duration_ms as [Wait Duration (ms)]
,(
select
SUBSTRING(
S.Text,
(ER.statement_start_offset / 2) + 1,
((
CASE
ER.statement_end_offset
WHEN -1
THEN DATALENGTH(S.text)
ELSE ER.statement_end_offset
END - ER.statement_start_offset) / 2) + 1)
from
sys.dm_exec_requests ER
cross apply sys.dm_exec_sql_text(ER.sql_handle) S
where
TL1.request_session_id = ER.session_id
) as [Query]
from
sys.dm_tran_locks as TL1 left outer join sys.dm_os_waiting_tasks WT on
TL1.lock_owner_address = WT.resource_address and TL1.request_status = 'WAIT'
where
TL1.request_session_id <> @@SPID
order by
TL1.request_session_id

The second one is slightly modified version that shows you only blocking and blocked processes.
/*
Shows blocked and blocking processes. Even if it works across all database, ObjectName
populates for current database only. Could be modified with dynamic SQL if needed
Be careful with Query text for BLOCKING session. This represents currently active
request for this specific session id which could be different than query which produced locks
It also could be NULL if there are no active requests for this session
*/
select
TL1.resource_type
,DB_NAME(TL1.resource_database_id) as [DB Name]
,CASE TL1.resource_type
WHEN 'OBJECT' THEN OBJECT_NAME(TL1.resource_associated_entity_id, TL1.resource_database_id)
WHEN 'DATABASE' THEN 'DB'
ELSE
CASE
WHEN TL1.resource_database_id = DB_ID()
THEN
(
select OBJECT_NAME(object_id, TL1.resource_database_id)
from sys.partitions
where hobt_id = TL1.resource_associated_entity_id
)
ELSE
'(Run under DB context)'
END
END as ObjectName
,TL1.resource_description
,TL1.request_session_id
,TL1.request_mode
,TL1.request_status
,WT.wait_duration_ms as [Wait Duration (ms)]
,(
select
SUBSTRING(
S.Text,
(ER.statement_start_offset / 2) + 1,
((
CASE
ER.statement_end_offset
WHEN -1
THEN DATALENGTH(S.text)
ELSE ER.statement_end_offset
END - ER.statement_start_offset) / 2) + 1)
from
sys.dm_exec_requests ER
cross apply sys.dm_exec_sql_text(ER.sql_handle) S
where
TL1.request_session_id = ER.session_id
) as [Query]
from
sys.dm_tran_locks as TL1 join sys.dm_tran_locks TL2 on
TL1.resource_associated_entity_id = TL2.resource_associated_entity_id
left outer join sys.dm_os_waiting_tasks WT on
TL1.lock_owner_address = WT.resource_address and TL1.request_status = 'WAIT'
where
TL1.request_status <> TL2.request_status and
(
TL1.resource_description = TL2.resource_description OR
(TL1.resource_description is null and TL2.resource_description is null)
)

So those are 2 techniques that can help you with the troubleshooting. Again, I think it’s not as powerful as extended events approach but same time those are much simpler to accomplish.
[翻译]:SQL死锁-阻塞探测的更多相关文章
- [翻译]:SQL死锁-阻塞
一般情况下死锁不是一步到位的,它必须满足特定的条件,然后形成资源的循环依赖才会产生死锁,死锁之前一定会出现阻塞,由阻塞升级才有可能出现死锁,所以我们有必要了解系统中都有哪些已经被阻塞的锁. 我在解决共 ...
- [翻译]:SQL死锁-死锁排除
As we already saw, the reasons why we have blocking issues and deadlocks in the system are pretty mu ...
- [翻译]:SQL死锁-锁与事务级别
其实这一篇呢与解决我项目中遇到的问题也是必不可少的.上一篇讲到了各种锁之间的兼容性,里面有一项就是共享锁会引起死锁,如何避免呢,将我们的查询都设置中read uncommitted是否可行呢?其结果显 ...
- [翻译]:SQL死锁-锁的类型
很久没有写博客了,这里面的原因有很多.最近的一个项目由于客户明确提出要做下性能压力测试,使用的工具就是VS自带的压力测试工具.以前其它项目做压力测试后反馈的其中一个重要问题就是数据库的死锁.没想到我们 ...
- [翻译]:SQL死锁-为什么会出现死锁
下面这篇对理解死锁非常重要,首先死锁是如何产生的我们要清楚. We already know why blocking occurs in the system and howto detect an ...
- SQL死锁知识及解决办法
[翻译]:SQL死锁-死锁排除 min.jiang 2014-03-18 00:23 阅读:874 评论:1 项目中死锁的解决经历 min.jiang 2014-03-17 01:09 阅读: ...
- sql server 阻塞与锁
SQL Server阻塞与锁 在讨论阻塞与加锁之前,需要先理解一些核心概念:并发性.事务.隔离级别.阻塞锁及死锁. 并发性是指多个进程在相同时间访问或者更改共享数据的能力.一般情况而言,一个系统在互不 ...
- [SQL]死锁处理语句
原文:[SQL]死锁处理语句 引言 今天在群里看到分享的解决死锁的sql语句,就想着这东西以后肯定用的着,就下载下来,在这里记录一下,以后查找也方便. SQL SET QUOTED_IDENTIFIE ...
- 需要我们了解的SQL Server阻塞原因与解决方法
需要我们了解的SQL Server阻塞原因与解决方法 上篇说SQL Server应用模式之OLTP系统性能分析.五种角度分析sql性能问题.本章依然是SQL性能 五种角度其一“阻塞与死锁” 这里通过连 ...
随机推荐
- 给animator动态添加事件
using UnityEngine; using System.Collections; public class setAnimationEvent : MonoBehaviour { public ...
- 关于STM8空间不足的解决方法
STM8虽然功能齐全,但是空间不足也是经常出来的情况.要么.text overflow,要么.bss overflow,让人头疼.这里把一些优化方案列出来,让空间得到充分利用: 1.在Project ...
- CLR via C#深解笔记六 - 泛型
面向对象编程一个好处就是“代码重用”,极大提高了开发效率.如是,可以派生出一个类,让它继承基类的所有能力,派生类只需要重写虚方法,或添加一些新的方法,就可以定制派生类的行为,使之满足开发人员的需求. ...
- 编译安装 LLVM
本文记录 LLVM 的安装过程,比较繁琐,使用 LLVM 3.4 操作系统:CentOS 6.6 64 位 1. 下载需要的软件 相关软件下载地址:http://llvm.org/releases/d ...
- python 字符串复制
通过变量来进行赋值 fstr = 'strcpy'sstr = fstrfstr = 'strcpy2'print sstr
- smartjs 0.2 OOP讲解 - Klass 类继承
SmartJS2.0加入OOP的功能.OOP包括klass与factory两个对象. Klass 类继承 与其他的类继承相比,smartjs使用了执行指针的概念(后面例子中会介绍),另外提供base基 ...
- 使用uploadify上传控件无法进入后台问题分析
分别在.net mvc 和java struts2中使用到 uploadify上传 文件,遇到同样的问题,选中文件上传后,文件无法上传,打上断点后发现没有进入后台. 逐步断点发现 项目共同点是加入了 ...
- Mina、Netty、Twisted一起学(一):实现简单的TCP服务器
MINA.Netty.Twisted为什么放在一起学习?首先,不妨先分别看一下它们官方网站对其的介绍: MINA: Apache MINA is a network application frame ...
- ruby -- 基础学习(四)TimeDate处理
TimeDate格式化输出: DateTime.parse(Time.now.to_s).strftime('%Y-%m-%d %H:%M:%S').to_s #就是按照2013-8-16 16:4 ...
- HTML5探索一(那些新增的标签和属性)
tml5相比html4,添加了部分语义化的标签和属性,现在我们就从这些标签和属性开始,学习html5吧. 首先,认识下HTML5新的文档类型: <!DOCTYPE html> 那些新标签 ...