gnuplot Python API
源文件
 #!/usr/bin/env python

 from os import popen

 class gnuplot_leon:

 # Author : Leon  Email: yangli0534@gmail.com

 # a gnuplot api of python

     def __init__(self):

         self.gnuplot = popen('gnuplot','w')

         self.write = self.gnuplot.write

         self.flush = self.gnuplot.flush

         self.close = self.gnuplot.close

         #return gp

     def set_plot_size(self,x=0.85,y=0.85):

         self.write(''.join(['set  size ',str(x),' ,',str(y),'\n']))

         #self.write(''.join(['set term png size ',str(x),' ',str(y),'\n']))

         #self.flush()

     def set_canvas_size(self,x=600,y=400):

         #self.write('set size 0.85, 0.85\n')

         self.write(''.join(['set term png size ',str(x),' ',str(y),'\n']))

     def set_title(self,title='gnuplot'):

         self.write(''.join(['set title "{/Times:Italic ',str(title), '}"\n']))

         self.write('set title  font ",10"  norotate tc rgb "white"\n')

     def set_gif(self):

         self.write('set terminal gif animate\n')

     def set_png(self):

         self.write('set terminal png\n')

     def set_file_name(self,filename='gnuplot.gif'):

         self.write(''.join(['set output ', '"',str(filename) ,'"','\n']))

     def set_tics_color(self,color='orange'):

         self.write(''.join(['set tics textcolor rgb ','"',str(color),'"','\n']))

     def set_border_color(self,color='orange'):

         self.write(''.join(['set border lc rgb ','"',str(color),'"','\n']))

     def set_grid_color(self,color='orange'):

         self.write(''.join(['set grid lc rgb ','"',str(color),'"','\n']))

     def set_bkgr_color(self,color='orange'):

         self.write(''.join(['set object 1 rectangle from screen 0,0 to screen 1,1 fc rgb ','"',str(color),'"',' behind\n']))

     def set_xlabel(self,text='x',color='white'):

         self.write(''.join(['set xlabel " {/Times:Italic distance: ', str(text) ,' } " tc rgb ','"',str(color),'"',' \n']))

     def set_ylabel(self,text='x',color='white'):

         self.write(''.join(['set ylabel " {/Times:Italic distance: ', str(text) ,' } " tc rgb ','"',str(color),'"',' \n']))

     def auto_scale_enable(self):

         self.write('set autoscale\n')

     def set_key(self,onoff='off ',text='gnuplot',color='white'):

         self.write('unset key\n')

         self.write(''.join(['set key ',str(onoff),' title "',str(text),'" textcolor rgbcolor "',str(color),'"\n']))

         #self.write('show key\n')

     def set_x_range(self,start,end):

         self.write(''.join(['set xrange [ ',str(start),':',str(end),']\n']))

     def set_y_range(self,start,end):

         self.write(''.join(['set yrange [ ',str(start),':',str(end),']\n']))

     def set_frame_start(self,linestype = 'l',linewidth=3,l_color='green,'):

         #self.write('plot "-" w l  lw 1.5 lc rgb "green"\n')

         self.write(''.join(['plot "-"  notitle w ',str(linestype),' lw ', str(linewidth), ' lc rgb ', '"', str(l_color),'" \n']))

     def update_point(self,x,y):

         self.write(''.join([str(x),' ',str(y),'\n']))

     def set_frame_end(self):

         self.write('e\n')

     def set_output_valid(self):

         self.write('set output\n')

     def close(self):

         self.close()
例'1
#!/usr/bin/env python import sys
import math
import os
from gnuplot_leon import * # Author : Leon Email: yangli0534@gmail.com
# fdtd simulation , plotting with gnuplot, writting in python
# perl and gnuplot software packages should be installed before running this program
# 1d fdtd with absorbing boundary and TFSF boundary between [49] and [50]
# lossy dielectric material localted at > ez[150] gp = gnuplot_leon() gp.set_plot_size(1,1)
gp.set_canvas_size(600,800)
gp.set_title('fdtd simulation by leon : gnuplot class test')
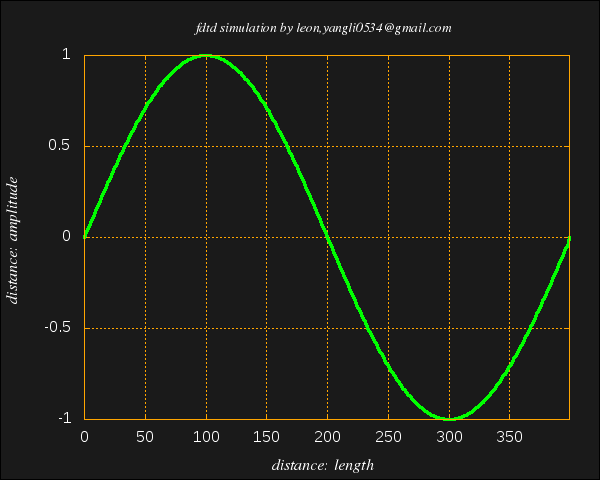
title = 'fdtd simulation by leon,yangli0534\\\\@gmail.com'
#gp.write('set terminal gif animate\n')
gp.set_title(title)
#gp.set_gif()
gp.set_png()
gp.set_file_name('demo1.png')
gp.set_tics_color('white')
gp.set_border_color('orange')
gp.set_grid_color('orange')
gp.set_bkgr_color('gray10')
gp.set_xlabel('length','white')
gp.set_ylabel('amplitude','white')
gp.auto_scale_enable()
gp.set_key('off','sin(x)','white') size = 400#physical distance sinwave=size * [0.00]# cnt = 0
elem = 0.00000
pi = 3.14159265358979323846
#gp.write(''.join(['set xrange [0:',str(size),'-1]\n']));
gp.set_x_range(0,size-1)
#for i in range(0,size):
# sinwave[i] = 0.0 for mm in range(0, size-1):
sinwave[mm] = math.sin(2*pi*mm/size) gp.set_frame_start('l', 3, 'green')
cnt = 0
for elem in sinwave:
gp.update_point(cnt,elem)
#print ''.join([str(cnt),':',str(elem),'\n'])
cnt += 1
gp.set_frame_end()
gp.set_key('off','sin(x)','white')
gp.set_output_valid()
gp.close()
例2
 #!/usr/bin/env python

 import sys

 import math

 import os

 from gnuplot_leon import *

 # Author : Leon  Email: yangli0534@gmail.com

 # fdtd simulation , plotting with gnuplot, writting in python

 # perl and gnuplot software packages should be installed before running this program

 # 1d fdtd with absorbing boundary and TFSF boundary between [49] and [50]

 # lossy dielectric material localted at > ez[150]

 gp = gnuplot_leon()

 gp.set_plot_size(0.85,0.85)

 gp.set_canvas_size(600,400)

 #gp.set_title('fdtd simulation by leon : gnuplot class test')

 title = 'fdtd simulation by leon,yangli0534\\\\@gmail.com'

 gp.set_title(title)

 gp.set_gif()

 #gp.set_png()

 gp.set_file_name('demo2.gif')

 gp.set_tics_color('white')

 gp.set_border_color('orange')

 gp.set_grid_color('orange')

 gp.set_bkgr_color('gray10')

 gp.set_xlabel('length','white')

 gp.set_ylabel('amplitude','white')

 gp.auto_scale_enable()

 gp.set_key('off','sin(x)','white')

 size = 400#physical distance

 ez=size * [0.00]#electric field

 hy=size * [0.00]#magnetic field

 ceze=size * [0.00]#

 cezh=size * [0.00]#

 chye=size * [0.00]#

 chyh=size * [0.00]#

 #sinwave=size * [0.00]#

 imp0 = 377.00

 LOSS = 0.01

 LOSS_LAYER = 250

 MaxTime = 18000

 cnt = 0

 elem = 0.00000

 gp.set_x_range(0,size-1)

 for i in range(0,size):

     ez[i] = 0.0

     hy[i] = 0.0

     #sinwave[i] = 0.0

     if (i < 100):

         #$epsR[$i] = 1.0;

         ceze[i] = 1.0

         cezh[i] = imp0

     elif(i < LOSS_LAYER):

         #$epsR[$i] = 1.0;

         ceze[i] = 1.0

         cezh[i] = imp0/9.0

     else :

         #$epsR[$i] = 9.0;

         ceze[i] = (1.0-LOSS)/(1.0+LOSS)

         cezh[i] = imp0 / 9 /(1.0+LOSS)

     if( i < LOSS_LAYER):

         chye[i] = 1.0/imp0

         chyh[i] = 1.0

     else:

         chye[i] = 1.0/imp0/(1.0+LOSS)

         chyh[i] = (1.0-LOSS)/(1.0+LOSS)

 for qTime in range(0, MaxTime):

     # update magnetic field

     for mm in range(0, size-1):

         hy[mm] = hy[mm]*chyh[mm] + (ez[mm+1]-ez[mm])*chye[mm]

         #sinwave[mm] = math.sin(mm/size*2*pi)

     hy[49] = hy[49]-math.exp(-(qTime - 30.0)*(qTime - 30.0)/100.0)/imp0

     # update electric field

     ez[0] = ez[1]#abc

     #$ez[$size-1] = $ez[$size-2];

     for mm in range(1, size-1):

         ez[mm] = ez[mm]*ceze[mm] + (hy[mm] - hy[mm-1])*cezh[mm]

     if(qTime % 30 == 0):

         gp.set_frame_start('l', 3, 'green')

         cnt = 0

         for elem in ez:

             gp.update_point(cnt,elem)

             cnt +=  1

         gp.set_frame_end()

     ez[50] =  ez[50]+math.exp(-(qTime +0.5-(-0.5)- 30.0)*(qTime +0.5-(-0.5)- 30.0)/100.0);

 #gp.write('set output\n')

 #gp.close()

 gp.set_output_valid()

 gp.close()
gnuplot Python API的更多相关文章
- Appium python API 总结
Appium python api 根据testerhome的文章,再补充一些文章里面没有提及的API [TOC] [1]find element driver 的方法 注意:这几个方法只能通过sel ...
- The novaclient Python API
The novaclient Python API Usage First create a client instance with your credentials: >>> f ...
- Openstack python api 学习文档 api创建虚拟机
Openstack python api 学习文档 转载请注明http://www.cnblogs.com/juandx/p/4953191.html 因为需要学习使用api接口调用openstack ...
- BotVS开发基础—Python API
代码 import json def main(): # python API列表 https://www.botvs.com/bbs-topic/443 #状态信息 LogStatus(" ...
- 《Spark Python API 官方文档中文版》 之 pyspark.sql (一)
摘要:在Spark开发中,由于需要用Python实现,发现API与Scala的略有不同,而Python API的中文资料相对很少.每次去查英文版API的说明相对比较慢,还是中文版比较容易get到所需, ...
- 《Spark Python API 官方文档中文版》 之 pyspark.sql (二)
摘要:在Spark开发中,由于需要用Python实现,发现API与Scala的略有不同,而Python API的中文资料相对很少.每次去查英文版API的说明相对比较慢,还是中文版比较容易get到所需, ...
- HBase Python API
HBase Python API HBase通过thrift机制可以实现多语言编程,信息通过端口传递,因此Python是个不错的选择 吐槽 博主在Mac上配置HBase,奈何Zoomkeeper一直报 ...
- 二、Blender/Python API总览
原文:https://docs.blender.org/api/blender_python_api_current/info_overview.html Python in Blender Ble ...
- Appium+python自动化8-Appium Python API
Appium+python自动化8-AppiumPython API 前言: Appium Python API全集,不知道哪个大神整理的,这里贴出来分享给大家. 1.contexts conte ...
随机推荐
- 【jQuery基础学习】06 jQuery表单验证插件-Validation
jQuery的基础部分前面都讲完了,那么就看插件了. 关于jQuery表单验证插件-Validation validation特点: 内置验证规则:拥有必填.数字.E-Mail.URL和信用卡号码等1 ...
- OWIN概述
关于OWIN OWIN defines a standard interface between .NET web servers and web applications. The goal of ...
- 自定义View_2_关于自定义组合View
自定义View(2) Android当中给我们提供了丰富的UI控件,当然也许满足不了我们的需求,我们就必须学会自定义自己的View,我们怎么算是自定义自己的view呢! 我们会根据原来有的View对V ...
- APP落地页开发中的一些小经验~
在开发日常落地页的时候,每当碰到一些很酷炫的宣传图用css实现很复杂且耗时的时候,一般采取切图然后将其放在页面中,在这个过程中发现<img/>标签中图片下方会有一行小空白,影响了与后一部分 ...
- javascript作用域链学习笔记
作用域链 "JavaScript中的函数运行在它们被定义的作用域里,而不是它们被执行的作用域里." --权威指南 在JavaScript中,一切皆对象,包括函数.函数对象和其它对象 ...
- SharePoint 2013 跨网站集发布功能简介
在SharePoint Server 2013网站实施中,我们经常会遇到跨网站集获取数据,而2013的这一跨网站集发布功能,正好满足我们这样的需求. 使用SharePoint 2013中的跨网站发布, ...
- 简单几步让Chrome浏览器也能打开Oracle EBS
2016-12-14更新: Google Chrome浏览器从版本45开始正式禁用NPAPI插件(也就是原本JRE插件的实现架构).所以如果你的浏览器版本已经是45以上了,本文提供的方法将不再适用.以 ...
- 我在用的mac软件(1)--终端环境之iTerm2
之前一直有朋友要我分享下在用的mac软件,今天有空就来写一下,可能不止于软件,会有一些配置或者工具,或者叫环境更合适.有些可能一句话带过,有些会详细介绍.也不分类了,想到哪个就写出来.如果已经写的足够 ...
- Android实战--电话拨号器
今天跟着黑马视频建立一个android app--电话拨号器 首先新建一个android项目 activity_main_xml中的代码如下: <RelativeLayout xmlns:and ...
- Android开发, 如何看logcat
有如下log: android.view.InflateException: Binary XML file line #2: Error inflating class com.hankkin. ...