原文地址:https://wsgzao.github.io/post/elk/
另外可以参考:https://www.digitalocean.com/community/tutorials/how-to-install-elasticsearch-logstash-and-kibana-elk-stack-on-ubuntu-14-04
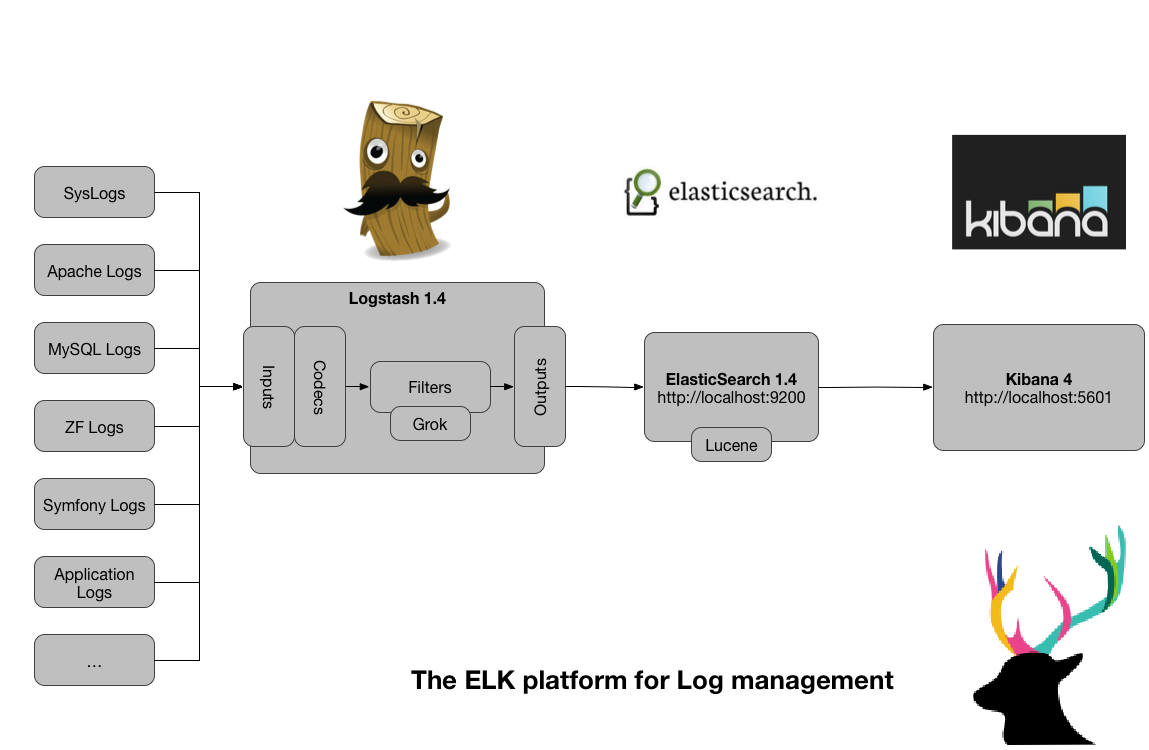
前言
Elasticsearch + Logstash + Kibana(ELK)是一套开源的日志管理方案,分析网站的访问情况时我们一般会借助Google/百度/CNZZ等方式嵌入JS做数据统计,但是当网站访问异常或者被攻击时我们需要在后台分析如Nginx的具体日志,而Nginx日志分割/GoAccess/Awstats都是相对简单的单节点解决方案,针对分布式集群或者数据量级较大时会显得心有余而力不足,而ELK的出现可以使我们从容面对新的挑战。
- Logstash:负责日志的收集,处理和储存
- Elasticsearch:负责日志检索和分析
- Kibana:负责日志的可视化
ELK(Elasticsearch + Logstash + Kibana)
更新记录
2015年08月31日 - 初稿
阅读原文 - http://wsgzao.github.io/post/elk/
扩展阅读
CentOS 7.x安装ELK(Elasticsearch+Logstash+Kibana) - http://www.chenshake.com/centos-install-7-x-elk-elasticsearchlogstashkibana/
Centos 6.5 安装nginx日志分析系统 elasticsearch + logstash + redis + kibana - http://blog.chinaunix.net/xmlrpc.php?r=blog/article&uid=17291169&id=4898582
logstash-forwarder and grok examples - https://www.ulyaoth.net/threads/logstash-forwarder-and-grok-examples.32413/
三斗室 - http://chenlinux.com/
elastic - https://www.elastic.co/guide
LTMP索引 - http://wsgzao.github.io/index/#LTMP
组件预览
JDK - http://www.oracle.com/technetwork/java/javase/downloads/index.html
Elasticsearch - https://www.elastic.co/downloads/elasticsearch
Logstash - https://www.elastic.co/downloads/logstash
Kibana - https://www.elastic.co/downloads/kibana
redis - http://redis.io/download
设置FQDN
创建SSL证书的时候需要配置FQDN
1
2
3
4
5
6
7
8
9
10
11
12
13
14
15
16
17
18
19
20
21
22
23
|
#修改hostname
cat /etc/hostname
elk

#修改hosts
cat /etc/hosts

127.0.0.1   localhost localhost.localdomain localhost4 localhost4.localdomain4
::1         localhost localhost.localdomain localhost6 localhost6.localdomain6

127.0.0.1 10-10-87-19
10.10.87.19 elk.ooxx.com elk

#刷新环境
hostname -F /etc/hostname

#复查结果
hostname -f
elk.ooxx.com

hostname
elk
|
服务端
Java
1
2
3
4
5
6
7
8
9
|
cat /etc/redhat-release
CentOS release 6.5 (Final)

yum install java-1.7.0-openjdk
java -version

java version "1.7.0_85"
OpenJDK Runtime Environment (rhel-2.6.1.3.el6_6-x86_64 u85-b01)
OpenJDK 64-Bit Server VM (build 24.85-b03, mixed mode)
|
Elasticsearch
1
2
3
4
5
6
7
8
9
10
11
12
13
14
15
16
17
18
19
20
21
22
23
24
25
26
27
28
29
30
31
32
|
#下载安装
wget https://download.elastic.co/elasticsearch/elasticsearch/elasticsearch-1.7.1.noarch.rpm
yum localinstall elasticsearch-1.7.1.noarch.rpm

#启动相关服务
service elasticsearch start
service elasticsearch status

#查看Elasticsearch的配置文件
rpm -qc elasticsearch

/etc/elasticsearch/elasticsearch.yml
/etc/elasticsearch/logging.yml
/etc/init.d/elasticsearch
/etc/sysconfig/elasticsearch
/usr/lib/sysctl.d/elasticsearch.conf
/usr/lib/systemd/system/elasticsearch.service
/usr/lib/tmpfiles.d/elasticsearch.conf

#查看端口使用情况
netstat -nltp

Active Internet connections (only servers)
Proto Recv-Q Send-Q Local Address               Foreign Address             State       PID/Program name
tcp        0      0 0.0.0.0:9200                0.0.0.0:*                   LISTEN      1765/java
tcp        0      0 0.0.0.0:9300                0.0.0.0:*                   LISTEN      1765/java
tcp        0      0 0.0.0.0:22                  0.0.0.0:*                   LISTEN      1509/sshd
tcp        0      0 :::22                       :::*                        LISTEN      1509/sshd

#测试访问
curl -X GET http://localhost:9200/
|
Kibana
1
2
3
4
5
6
7
8
9
10
11
12
13
14
15
16
17
18
19
20
21
22
23
24
25
26
27
28
29
30
31
32
33
34
35
36
37
38
39
40
41
42
43
44
45
46
47
48
49
50
51
52
53
54
55
56
57
58
59
60
61
62
63
64
65
66
67
68
69
70
71
72
73
74
75
76
77
78
79
80
81
82
83
84
85
86
87
88
89
90
91
92
93
94
95
96
97
98
99
100
101
102
103
104
105
106
107
108
109
110
111
112
113
114
115
116
117
118
119
120
121
122
123
124
125
126
127
128
129
130
|
#下载tar包
wget https://download.elastic.co/kibana/kibana/kibana-4.1.1-linux-x64.tar.gz
#解压
tar zxf kibana-4.1.1-linux-x64.tar.gz -C /usr/local/
cd /usr/local/
mv kibana-4.1.1-linux-x64 kibana

#创建kibana服务
vi /etc/rc.d/init.d/kibana

#!/bin/bash
### BEGIN INIT INFO
# Provides:          kibana
# Default-Start:     2 3 4 5
# Default-Stop:      0 1 6
# Short-Description: Runs kibana daemon
# Description: Runs the kibana daemon as a non-root user
### END INIT INFO

# Process name
NAME=kibana
DESC="Kibana4"
PROG="/etc/init.d/kibana"

# Configure location of Kibana bin
KIBANA_BIN=/usr/local/kibana/bin

# PID Info
PID_FOLDER=/var/run/kibana/
PID_FILE=/var/run/kibana/$NAME.pid
LOCK_FILE=/var/lock/subsys/$NAME
PATH=/bin:/usr/bin:/sbin:/usr/sbin:$KIBANA_BIN
DAEMON=$KIBANA_BIN/$NAME

# Configure User to run daemon process
DAEMON_USER=root
# Configure logging location
KIBANA_LOG=/var/log/kibana.log

# Begin Script
RETVAL=0

if [ `id -u` -ne 0 ]; then
        echo "You need root privileges to run this script"
        exit 1
fi

# Function library
. /etc/init.d/functions

start() {
        echo -n "Starting $DESC : "

pid=`pidofproc -p $PID_FILE kibana`
        if [ -n "$pid" ] ; then
                echo "Already running."
                exit 0
        else
        # Start Daemon
if [ ! -d "$PID_FOLDER" ] ; then
                        mkdir $PID_FOLDER
                fi
daemon --user=$DAEMON_USER --pidfile=$PID_FILE $DAEMON 1>"$KIBANA_LOG" 2>&1 &
                sleep 2
                pidofproc node > $PID_FILE
                RETVAL=$?
                [[ $? -eq 0 ]] && success || failure
echo
                [ $RETVAL = 0 ] && touch $LOCK_FILE
                return $RETVAL
        fi
}

reload()
{
    echo "Reload command is not implemented for this service."
    return $RETVAL
}

stop() {
        echo -n "Stopping $DESC : "
        killproc -p $PID_FILE $DAEMON
        RETVAL=$?
echo
        [ $RETVAL = 0 ] && rm -f $PID_FILE $LOCK_FILE
}

case "$1" in
  start)
        start
;;
  stop)
        stop
        ;;
  status)
        status -p $PID_FILE $DAEMON
        RETVAL=$?
        ;;
  restart)
        stop
        start
        ;;
  reload)
reload
;;
  *)
# Invalid Arguments, print the following message.
        echo "Usage: $0 {start|stop|status|restart}" >&2
exit 2
        ;;
esac

#修改启动权限
chmod +x /etc/rc.d/init.d/kibana

#启动kibana服务
service kibana start
service kibana status

#查看端口
netstat -nltp

Active Internet connections (only servers)
Proto Recv-Q Send-Q Local Address               Foreign Address             State       PID/Program name
tcp        0      0 0.0.0.0:9200                0.0.0.0:*                   LISTEN      1765/java
tcp        0      0 0.0.0.0:9300                0.0.0.0:*                   LISTEN      1765/java
tcp        0      0 0.0.0.0:22                  0.0.0.0:*                   LISTEN      1509/sshd
tcp        0      0 0.0.0.0:5601                0.0.0.0:*                   LISTEN      1876/node
tcp        0      0 :::22                       :::*                        LISTEN      1509/sshd
|
Logstash
1
2
3
4
5
6
7
8
9
10
11
12
13
14
15
16
17
18
19
20
21
22
23
24
25
26
27
28
29
30
31
32
33
34
35
36
37
38
39
40
41
42
43
44
45
46
47
48
49
50
51
52
53
54
55
56
57
58
59
60
61
62
63
64
65
66
67
68
69
70
71
|
#下载rpm包
wget https://download.elastic.co/logstash/logstash/packages/centos/logstash-1.5.4-1.noarch.rpm
#安装
yum localinstall logstash-1.5.4-1.noarch.rpm

#设置ssl,之前设置的FQDN是elk.ooxx.com
cd /etc/pki/tls
#openssl req -x509  -batch -nodes -newkey rsa:2048 -keyout lumberjack.key -out lumberjack.crt -subj /CN=logstash.example.com
openssl req -subj '/CN=elk.ooxx.com/' -x509 -days 3650 -batch -nodes -newkey rsa:2048 -keyout private/logstash-forwarder.key -out certs/logstash-forwarder.crt

#创建一个01-logstash-initial.conf文件
cat > /etc/logstash/conf.d/01-logstash-initial.conf << EOF
input {
  lumberjack {
    port => 5000
    type => "logs"
    ssl_certificate => "/etc/pki/tls/certs/logstash-forwarder.crt"
    ssl_key => "/etc/pki/tls/private/logstash-forwarder.key"
  }
}

filter {
  if [type] == "syslog" {
    grok {
      match => { "message" => "%{SYSLOGTIMESTAMP:syslog_timestamp} %{SYSLOGHOST:syslog_hostname} %{DATA:syslog_program}(?:\[%{POSINT:syslog_pid}\])?: %{GREEDYDATA:syslog_message}" }
      add_field => [ "received_at", "%{@timestamp}" ]
      add_field => [ "received_from", "%{host}" ]
    }
    syslog_pri { }
    date {
      match => [ "syslog_timestamp", "MMM  d HH:mm:ss", "MMM dd HH:mm:ss" ]
    }
  }
}

output {
  elasticsearch { host => localhost }
  stdout { codec => rubydebug }
}
EOF

#启动logstash服务
service logstash start
service logstash status

#查看5000端口
netstat -nltp

Active Internet connections (only servers)
Proto Recv-Q Send-Q Local Address               Foreign Address             State       PID/Program name
tcp        0      0 0.0.0.0:9200                0.0.0.0:*                   LISTEN      1765/java
tcp        0      0 0.0.0.0:9300                0.0.0.0:*                   LISTEN      1765/java
tcp        0      0 0.0.0.0:9301                0.0.0.0:*                   LISTEN      2309/java
tcp        0      0 0.0.0.0:22                  0.0.0.0:*                   LISTEN      1509/sshd
tcp        0      0 0.0.0.0:5601                0.0.0.0:*                   LISTEN      1876/node
tcp        0      0 0.0.0.0:5000                0.0.0.0:*                   LISTEN      2309/java
tcp        0      0 :::22                       :::*                        LISTEN      1509/sshd

#启动服务
service logstash-forwarder start
service logstash-forwarder status

#访问Kibana,Time-field name 选择 @timestamp
http://localhost:5601/

#增加节点和客户端配置一样,注意同步证书
/etc/pki/tls/certs/logstash-forwarder.crt
|
客户端
Logstash Forwarder
1
2
3
4
5
6
7
8
9
10
11
12
13
14
15
16
17
18
19
20
21
22
23
24
25
26
27
28
29
30
31
32
33
34
35
36
|
#登陆到客户端,安装Logstash Forwarder
wget https://download.elastic.co/logstash-forwarder/binaries/logstash-forwarder-0.4.0-1.x86_64.rpm
yum localinstall logstash-forwarder-0.4.0-1.x86_64.rpm

#查看logstash-forwarder的配置文件位置
rpm -qc logstash-forwarder
/etc/logstash-forwarder.conf

#备份配置文件
cp /etc/logstash-forwarder.conf /etc/logstash-forwarder.conf.save

#编辑 /etc/logstash-forwarder.conf,需要根据实际情况进行修改

cat > /etc/logstash-forwarder.conf << EOF
{
  "network": {
    "servers": [ "elk.ooxx.com:5000" ],

    "ssl ca": "/etc/pki/tls/certs/logstash-forwarder.crt",

    "timeout": 15
  },

  "files": [
    {
      "paths": [
        "/var/log/messages",
        "/var/log/secure"
      ],

      "fields": { "type": "syslog" }
    }
  ]
}
EOF
|
配置Nginx日志策略
1
2
3
4
5
6
7
8
9
10
11
12
13
14
15
16
17
18
19
20
21
22
23
24
25
26
27
28
29
30
31
32
33
34
35
36
37
38
39
40
41
42
43
44
45
46
47
48
49
50
51
52
53
54
55
56
57
58
59
60
61
62
63
64
65
66
67
68
69
70
71
72
73
74
75
76
77
78
79
|
#修改客户端配置
vi /etc/logstash-forwarder.conf

{
  "network": {
    "servers": [ "elk.ooxx.com:5000" ],

    "ssl ca": "/etc/pki/tls/certs/logstash-forwarder.crt",

    "timeout": 15
  },

  "files": [
    {
      "paths": [
        "/var/log/messages",
        "/var/log/secure"
      ],
      "fields": { "type": "syslog" }
    }, {
      "paths": [
        "/app/local/nginx/logs/access.log"
      ],
      "fields": { "type": "nginx" }
    }
  ]
}

#服务端增加patterns
mkdir /opt/logstash/patterns
vi /opt/logstash/patterns/nginx

NGUSERNAME [a-zA-Z\.\@\-\+_%]+
NGUSER %{NGUSERNAME}
NGINXACCESS %{IPORHOST:remote_addr} - - \[%{HTTPDATE:time_local}\] "%{WORD:method} %{URIPATH:path}(?:%{URIPARAM:param})? HTTP/%{NUMBER:httpversion}" %{INT:status} %{INT:body_bytes_sent} %{QS:http_referer} %{QS:http_user_agent}

#官网pattern的debug在线工具
https://grokdebug.herokuapp.com/

#修改logstash权限
chown -R logstash:logstash /opt/logstash/patterns

#修改服务端配置
vi /etc/logstash/conf.d/01-logstash-initial.conf

input {
  lumberjack {
    port => 5000
    type => "logs"
    ssl_certificate => "/etc/pki/tls/certs/logstash-forwarder.crt"
    ssl_key => "/etc/pki/tls/private/logstash-forwarder.key"
  }
}

filter {
  if [type] == "syslog" {
    grok {
      match => { "message" => "%{SYSLOGTIMESTAMP:syslog_timestamp} %{SYSLOGHOST:syslog_hostname} %{DATA:syslog_program}(?:\[%{POSINT:syslog_pid}\])?: %{GREEDYDATA:syslog_message}" }
      add_field => [ "received_at", "%{@timestamp}" ]
      add_field => [ "received_from", "%{host}" ]
    }
    syslog_pri { }
    date {
      match => [ "syslog_timestamp", "MMM  d HH:mm:ss", "MMM dd HH:mm:ss" ]
    }
  }
  if [type] == "nginx" {
    grok {
       match => { "message" => "%{NGINXACCESS}" }
    }
  }
}

output {
  elasticsearch { host => localhost }
  stdout { codec => rubydebug }
}
|
其它注意事项
修改kibana端口
1
2
3
4
5
6
7
8
9
10
11
12
13
14
15
16
17
18
19
20
21
22
23
24
25
26
27
28
29
30
31
32
33
34
35
36
37
38
39
40
41
42
43
44
45
46
47
48
49
50
51
52
53
54
55
56
57
58
59
60
61
62
63
64
65
66
67
68
69
70
71
72
73
74
75
76
77
78
79
80
81
82
|
#编辑kibana.yaml
vi /usr/local/kibana/config/kibana.yml

# Kibana is served by a back end server. This controls which port to use.
#port: 5601
port: 80

# The host to bind the server to.
host: "0.0.0.0"

# The Elasticsearch instance to use for all your queries.
elasticsearch_url: "http://localhost:9200"

# preserve_elasticsearch_host true will send the hostname specified in `elasticsearch`. If you set it to false,
# then the host you use to connect to *this* Kibana instance will be sent.
elasticsearch_preserve_host: true

# Kibana uses an index in Elasticsearch to store saved searches, visualizations
# and dashboards. It will create a new index if it doesn't already exist.
kibana_index: ".kibana"

# If your Elasticsearch is protected with basic auth, this is the user credentials
# used by the Kibana server to perform maintence on the kibana_index at statup. Your Kibana
# users will still need to authenticate with Elasticsearch (which is proxied thorugh
# the Kibana server)
# kibana_elasticsearch_username: user
# kibana_elasticsearch_password: pass

# If your Elasticsearch requires client certificate and key
# kibana_elasticsearch_client_crt: /path/to/your/client.crt
# kibana_elasticsearch_client_key: /path/to/your/client.key

# If you need to provide a CA certificate for your Elasticsarech instance, put
# the path of the pem file here.
# ca: /path/to/your/CA.pem

# The default application to load.
default_app_id: "discover"

# Time in milliseconds to wait for elasticsearch to respond to pings, defaults to
# request_timeout setting
# ping_timeout: 1500

# Time in milliseconds to wait for responses from the back end or elasticsearch.
# This must be > 0
request_timeout: 300000

# Time in milliseconds for Elasticsearch to wait for responses from shards.
# Set to 0 to disable.
shard_timeout: 0

# Time in milliseconds to wait for Elasticsearch at Kibana startup before retrying
# startup_timeout: 5000

# Set to false to have a complete disregard for the validity of the SSL
# certificate.
verify_ssl: true

# SSL for outgoing requests from the Kibana Server (PEM formatted)
# ssl_key_file: /path/to/your/server.key
# ssl_cert_file: /path/to/your/server.crt

# Set the path to where you would like the process id file to be created.
# pid_file: /var/run/kibana.pid

# If you would like to send the log output to a file you can set the path below.
# This will also turn off the STDOUT log output.
# log_file: ./kibana.log

# Plugins that are included in the build, and no longer found in the plugins/ folder
bundled_plugin_ids:
 - plugins/dashboard/index
 - plugins/discover/index
 - plugins/doc/index
 - plugins/kibana/index
 - plugins/markdown_vis/index
 - plugins/metric_vis/index
 - plugins/settings/index
 - plugins/table_vis/index
 - plugins/vis_types/index
 - plugins/visualize/index
|
JVM调优
#修改elasticsearch.in.sh

vi /usr/share/elasticsearch/bin/elasticsearch.in.sh

if [ "x$ES_MIN_MEM" = "x" ]; then

    ES_MIN_MEM=1g

fi

if [ "x$ES_MAX_MEM" = "x" ]; then

    ES_MAX_MEM=1g
- Centos6.5使用ELK(Elasticsearch + Logstash + Kibana) 搭建日志集中分析平台实践
Centos6.5安装Logstash ELK stack 日志管理系统 概述: 日志主要包括系统日志.应用程序日志和安全日志.系统运维和开发人员可以通过日志了解服务器软硬件信息.检查配置过程中的 ...
- 键盘侠Linux干货| ELK(Elasticsearch + Logstash + Kibana) 搭建教程
前言 Elasticsearch + Logstash + Kibana(ELK)是一套开源的日志管理方案,分析网站的访问情况时我们一般会借助 Google / 百度 / CNZZ 等方式嵌入 JS ...
- 【转】ELK(ElasticSearch, Logstash, Kibana)搭建实时日志分析平台
[转自]https://my.oschina.net/itblog/blog/547250 摘要: 前段时间研究的Log4j+Kafka中,有人建议把Kafka收集到的日志存放于ES(ElasticS ...
- 【Big Data - ELK】ELK(ElasticSearch, Logstash, Kibana)搭建实时日志分析平台
摘要: 前段时间研究的Log4j+Kafka中,有人建议把Kafka收集到的日志存放于ES(ElasticSearch,一款基于Apache Lucene的开源分布式搜索引擎)中便于查找和分析,在研究 ...
- ELK(ElasticSearch+Logstash+ Kibana)搭建实时日志分析平台
一.简介 ELK 由三部分组成elasticsearch.logstash.kibana,elasticsearch是一个近似实时的搜索平台,它让你以前所未有的速度处理大数据成为可能. Elastic ...
- Elasticsearch+Logstash+Kibana搭建日志平台
1 ELK简介 ELK是Elasticsearch+Logstash+Kibana的简称 ElasticSearch是一个基于Lucene的分布式全文搜索引擎,提供 RESTful API进行数据读写 ...
- [Big Data - ELK] ELK(ElasticSearch, Logstash, Kibana)搭建实时日志分析平台
ELK平台介绍 在搜索ELK资料的时候,发现这篇文章比较好,于是摘抄一小段: 以下内容来自: http://baidu.blog.51cto.com/71938/1676798 日志主要包括系统日志. ...
- 13: ELK(ElasticSearch+Logstash+ Kibana)搭建实时日志分析平台
参考博客:https://www.cnblogs.com/zclzhao/p/5749736.html 51cto课程:https://edu.51cto.com/center/course/less ...
- 用ElasticSearch,LogStash,Kibana搭建实时日志收集系统
用ElasticSearch,LogStash,Kibana搭建实时日志收集系统 介绍 这套系统,logstash负责收集处理日志文件内容存储到elasticsearch搜索引擎数据库中.kibana ...
随机推荐
- canvas之特丑时钟
感觉是不是特想送钟,老是编写些时钟的效果,今日就发个丑丑的时钟,老实说 有没有什么调试canvas的工具,老是要在浏览器刷新查看效果,好累啊~ (┬_┬) 代码: <!DOCTYPE html& ...
- android: 使用前台服务
9.5.1 使用前台服务 服务几乎都是在后台运行的,一直以来它都是默默地做着辛苦的工作.但是服务的系统 优先级还是比较低的,当系统出现内存不足的情况时,就有可能会回收掉正在后台运行的服 务.如果 ...
- Category和Extension
转: http://blog.csdn.net/leikezhu1981/article/details/19091049 一.概述 类别是一种为现有的类添加新方法的方式. 利用Objective-C ...
- 【转】BitKeeper与Linux,git史前琐事
http://www.path8.net/tn/archives/6039 维持数年的BitKeeper与Linux的关系最终还是落入了好莱坞明星婚姻式的结局.他们曾经相得益彰,最后却走到这个遗憾的地 ...
- [3].jekyll的基础
一.创建新项目 以下是一个获取最简单 Jekyll 模板并生成静态页面的方法.: Administrator@FANGPENG /e $ jekyll new myblog # 创建名为 myblog ...
- c# 操作excel 替代方案
一直使用excel com 接口进行excel 操作,最近一次因为权限折腾了个够呛,果断放弃,使用 NPOI FileStream file = new FileStream(url, FileMod ...
- mybatis中传入String类型参数异常
在使用mybatis时,写了一条sql语句,只有一个String类型的参数, 示例代码 <select id="getApplyNum" parameterType=&quo ...
- sublime Text Pastry使用
来源: https://github.com/duydao/Text-Pastry/wiki/Examples Using a text list Using the Clipboard Clip ...
- Django 源码小剖: 应用程序入口 WSGIHandler
WSGI 有三个部分, 分别为服务器(server), 应用程序(application) 和中间件(middleware). 已经知道, 服务器方面会调用应用程序来处理请求, 在应用程序中有真正的处 ...
- 无法import的原因(ImportError: No module named *****)
python中,每个py文件被称之为模块,每个具有__init__.py文件的目录被称为包.只要模块或者包所在的目录在sys.path中,就可以使用import 模块或import 包来使用. 如果想 ...
