搭建Loki、Promtail、Grafana轻量级日志系统(centos7)
搭建Loki、Promtail、Grafana轻量级日志系统(centos7)--简称PLG
需求
公司项目采用微服务的架构,服务很多,每个服务都有自己的日志,分别存放在不同的服务器上。当查找日志时需要分别登录不同的服务器,有大量的请求的情况下,在日志文件中查找信息十分困难。想要搭建一个日志系统,ELK分布式日志系统对于中小型公司来说开发维护成本太高,经过调研,选择Loki轻量级日志系统。
Loki简介
Loki 是一个水平可扩展,高可用性,多租户日志聚合系统,灵感来自 Prometheus ,其设计非常经济高效,易于操作。它不索引日志的内容,而是为每个日志流设置一组标签。
Loki与其他日志聚合系统差别:
不对日志进行全文本索引。通过存储压缩的,非结构化的日志以及仅索引元数据,Loki更加易于操作且运行成本更低。
使用与Prometheus相同的标签对日志流进行索引和分组,从而使您能够使用与Prometheus相同的标签在指标和日志之间无缝切换。
特别适合存储Kubernetes Pod日志。诸如Pod标签之类的元数据会自动被抓取并建立索引。
在Grafana中原生支持(需要Grafana v6.0及以上)。
Loki的日志系统的组件:
Promtail是代理,负责收集日志并将其发送给Loki。
Loki是主服务器,负责存储日志和处理查询。
Grafana用于查询和显示日志。
搭建步骤
本文采用的搭建方式是分别下载各个组件并安装。也可以参考官方的文档进行搭建安装。
Loki的GitHub地址:https://github.com/grafana/loki
配置文件官网地址:https://grafana.com/docs/loki/latest/installation/local/
Grafana下载官网:https://grafana.com/grafana/download

1.下载安装启动Grafana
官网提供了下图中几种方式,本文采用的是CentOS系统,yum安装的方式。

#下载安装grafana命令,下列命令执行成功后。在/usr/sbin文件夹下会有grafana-server执行文件

wget https://dl.grafana.com/oss/release/grafana-7.3.2-1.x86_64.rpm

sudo yum localinstall grafana-7.3.2-1.x86_64.rpm

#启动grafana,grafana会占用服务器3000端口,记得保证3000端口不被占用

cd /usr/sbin

./grafana-server web
2.下载启动Loki和Promtail
官方文档地址:https://grafana.com/docs/loki/latest/installation/local/
因为采用本地安装的方式,参考文档(下图箭头指向的位置),分别下载执行文件和启动的配置文件。

下载Promtail:https://github.com/grafana/loki/releases/download/v2.0.0/promtail-linux-amd64.zip
#下载压缩文件

curl -O -L "https://github.com/grafana/loki/releases/download/v2.0.0/loki-linux-amd64.zip"

#解压文件

unzip "loki-linux-amd64.zip"

#执行文件授权

chmod a+x "loki-linux-amd64"

#下载Loki和Promtail的配置文件

wget https://raw.githubusercontent.com/grafana/loki/master/cmd/loki/loki-local-config.yaml

wget https://raw.githubusercontent.com/grafana/loki/main/clients/cmd/promtail/promtail-local-config.yaml

若下载失败,使用下面已下载好的文件
loki-local-config.yaml
vim loki-local-config.yaml

auth_enabled: false

server:

  http_listen_port: 3100 # 端口

ingester:

  lifecycler:

    address: 127.0.0.1 # 地址

    ring:

      kvstore:

        store: inmemory

      replication_factor: 1

    final_sleep: 0s

  chunk_idle_period: 1h       # Any chunk not receiving new logs in this time will be flushed

  max_chunk_age: 1h           # All chunks will be flushed when they hit this age, default is 1h

  chunk_target_size: 1048576  # Loki will attempt to build chunks up to 1.5MB, flushing first if chunk_idle_period or max_chunk_age is reached first

  chunk_retain_period: 30s    # Must be greater than index read cache TTL if using an index cache (Default index read cache TTL is 5m)

  max_transfer_retries: 0     # Chunk transfers disabled

schema_config:

  configs:

    - from: 2020-10-24

      store: boltdb-shipper

      object_store: filesystem

      schema: v11

      index:

        prefix: index_

        period: 24h

storage_config:

  boltdb_shipper:

    active_index_directory: /tmp/loki/boltdb-shipper-active

    cache_location: /tmp/loki/boltdb-shipper-cache

    cache_ttl: 24h         # Can be increased for faster performance over longer query periods, uses more disk space

    shared_store: filesystem

  filesystem:

    directory: /tmp/loki/chunks

compactor:

  working_directory: /tmp/loki/boltdb-shipper-compactor

  shared_store: filesystem

limits_config:

  reject_old_samples: true

  reject_old_samples_max_age: 168h

chunk_store_config:

  max_look_back_period: 0s

table_manager:

  retention_deletes_enabled: false

  retention_period: 0s

ruler:

  storage:

    type: local

    local:

      directory: /tmp/loki/rules

  rule_path: /tmp/loki/rules-temp

  alertmanager_url: http://localhost:9093 # alertmanager报警地址

  ring:

    kvstore:

      store: inmemory

  enable_api: true
promtail-local-config.yaml
vim promtail-local-config.yaml

server:

  http_listen_port: 9080

  grpc_listen_port: 0

positions:

  filename: /tmp/positions.yaml

clients:

  - url: http://localhost:3100/loki/api/v1/push

scrape_configs:

- job_name: system

  static_configs:

  - targets:

      - localhost

    labels:

      job: varlogs

      __path__: /var/log/*log
启动Loki,本文采用的Loki默认配置,服务端口为3100
#启动Loki命令

后台启动

nohup ./loki-linux-amd64 -config.file=loki-local-config.yaml  > loki.log 2>&1 &

前台启动

./loki-linux-amd64 -config.file=./loki-local-config.yaml

#查看启动是否成功(查看3100端口的进程是否存在)

netstat -tunlp | grep 3100

#或者根据名称查找进程(执行命令后有下边的显示,则启动成功)

ps -ef | grep loki-linux-amd64

$ root     11037 22022  0 15:44 pts/0    00:00:55 ./loki-linux-amd64 -config.file=loki-local-config.yaml
启动Promtail
前台启动

./promtail-linux-amd64 -config.file=./promtail-local-config.yaml

后台启动

#Promtail默认端口是9080,启动完成后,可以采用上边的方式查看进程是否启动成功

nohup ./promtail-linux-amd64 -config.file=promtail-local-config.yaml > promtail.log 2>&1 &
配置服务
vim /usr/lib/systemd/system/loki.service

[Unit]

Description=loki

Documentation=https://github.com/grafana/loki/tree/master

After=network.target

[Service]

Type=simple

User=loki

ExecStart=/usr/local/src/loki-linux-amd64 -config.file=/usr/local/src/loki-local-config.yaml &>> /opt/logs/loki-3100.log # 具体路径可以根据实际情况修改

Restart=on-failure

[Install]

WantedBy=multi-user.target
# systemctl daemon-reload

# systemctl start loki

# systemctl status loki

# systemctl enable loki
vim /usr/lib/systemd/system/promtail.service

[Unit]

Description=promtail

Documentation=https://github.com/grafana/loki/tree/master

After=network.target

[Service]

Type=simple

User=promtail

ExecStart=/usr/local/src/promtail-linux-amd64 -config.file=/usr/local/src/promtail-local-config.yaml  &>> /opt/logs/promtail-9080.log # 具体路径可以根据实际情况修改

Restart=on-failure

[Install]

WantedBy=multi-user.target
# systemctl daemon-reload

# systemctl start promtail

# systemctl status promtail

# systemctl enable promtail
验证:
curl "http://127.0.0.1:3100/api/prom/label"

curl localhost:3100/loki/api/v1/labels
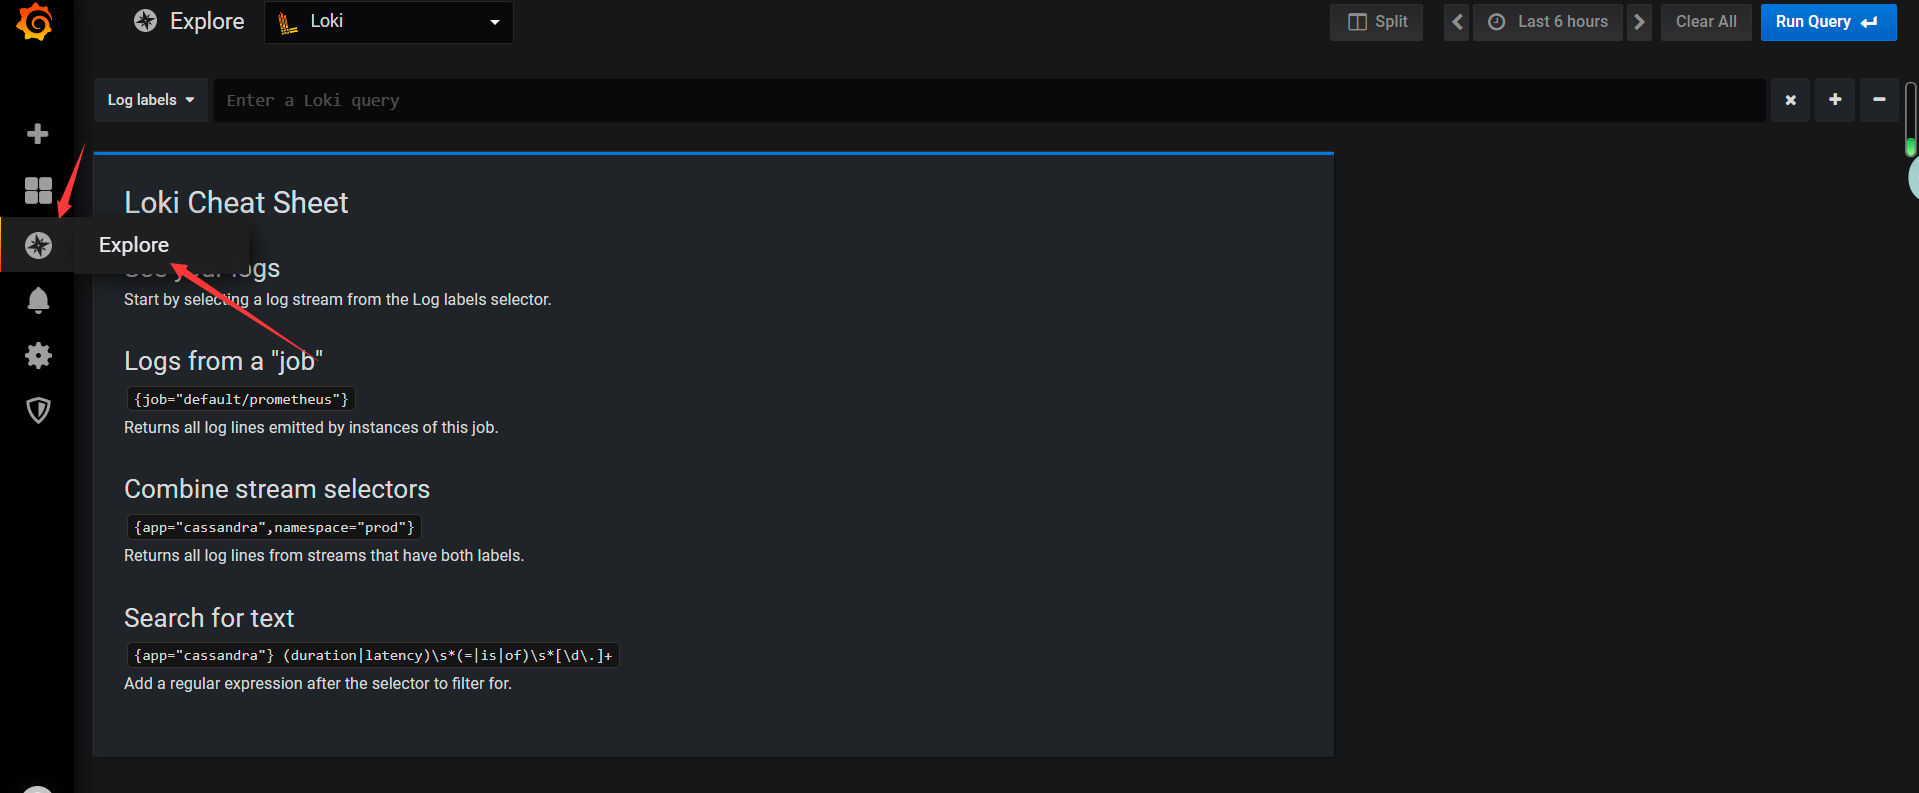
如何配置数据源
访问web页面:http://localhost:3000/ 进行登录(账号密码都是admin),点击下图中的位置,找到Loki,配置数据源。

填写数据源的访问地址并保存。

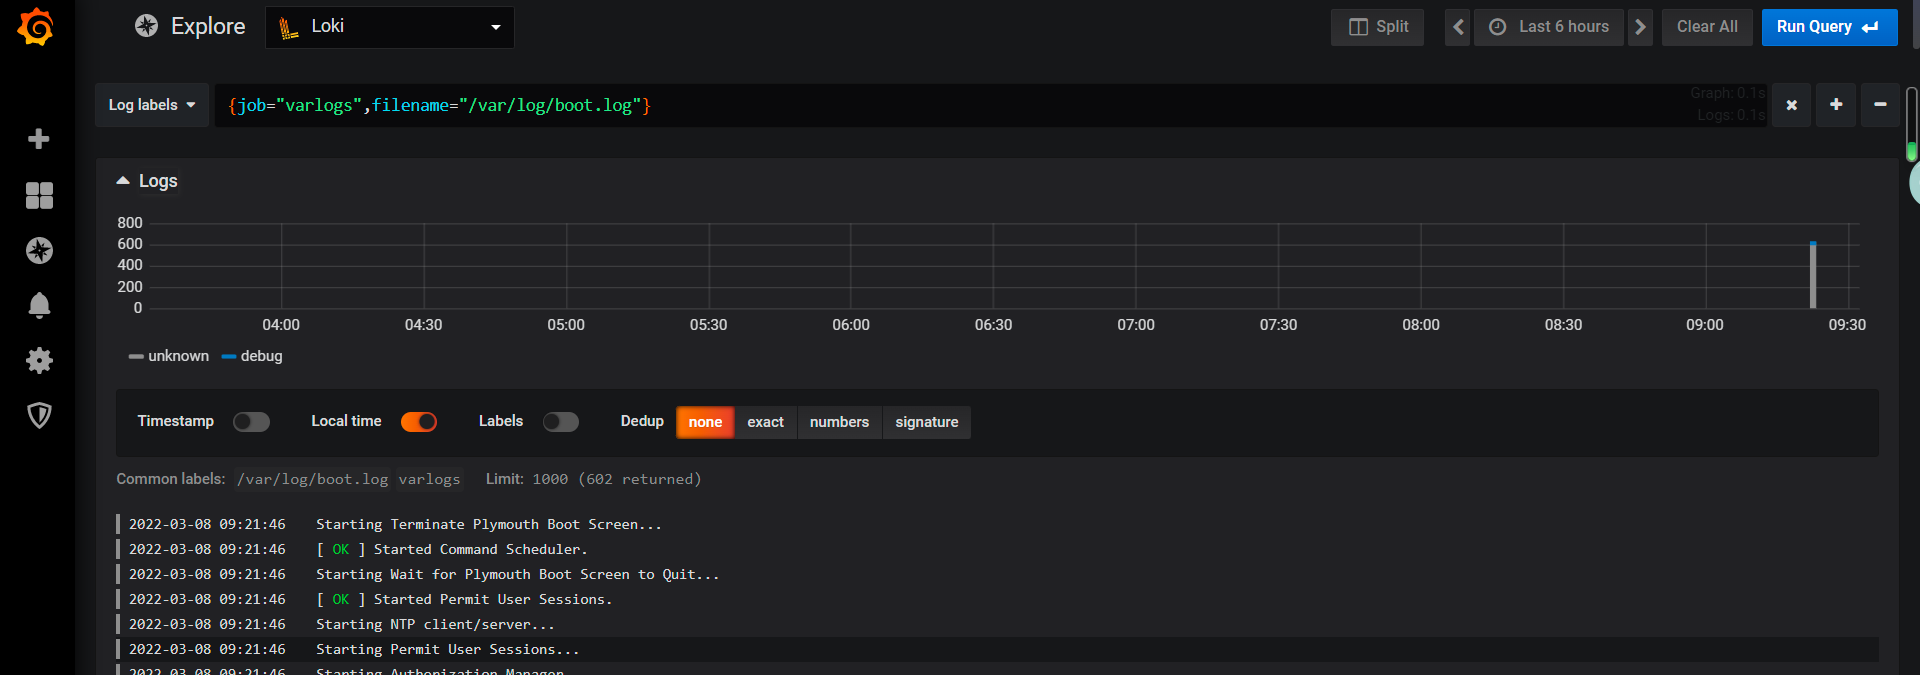
日志查看效果如下图。

配置日志路径
varlog参考写法
参考:https://www.cnblogs.com/sanduzxcvbnm/p/14234953.html
参考:https://blog.csdn.net/tcy1429920627/article/details/109679363
搭建Loki、Promtail、Grafana轻量级日志系统(centos7)的更多相关文章
- Spring Cloud 5分钟搭建教程(附上一个分布式日志系统项目作为参考) - 推荐
http://blog.csdn.net/lc0817/article/details/53266212/ https://github.com/leoChaoGlut/log-sys 上面是我基于S ...
- 轻量级日志收集方案Loki
先看看结果有多轻量吧 官方文档:https://grafana.com/docs/loki/latest/ 简介 Grafana Loki 是一个日志聚合工具,它是功能齐全的日志堆栈的核心. Loki ...
- 利用Asio搭建日志系统
Asio(http://think-async.com)官方示例中给出了一个比较初步的日志服务,主要代码在basic_logger.hpp.logger_service.hpp.logger_serv ...
- .NET下日志系统的搭建——log4net+kafka+elk
.NET下日志系统的搭建--log4net+kafka+elk 前言 我们公司的程序日志之前都是采用log4net记录文件日志的方式(有关log4net的简单使用可以看我另一篇博客),但是随着 ...
- centos7搭建安装loki、promtail、Grafana日志系统
loki.promtail.Grafana安装包 链接:https://pan.baidu.com/s/1vkSa_KYrXM0UEI8i42KdaA 提取码:4d4q 如果安装失败或者下载速度慢可以 ...
- 【日志系统】Loki日志监控 - 入门初体验
使用Grafana+Loki+Promtail入门级部署分布式日志系统(windows环境) 生命不息,写作不止 继续踏上学习之路,学之分享笔记 总有一天我也能像各位大佬一样 一个有梦有戏的人 @怒放 ...
- elk + filebeat,6.3.2版本简单搭建,实现我们自己的集中式日志系统
前言 刚从事开发那段时间不习惯输出日志,认为那是无用功,徒增代码量,总认为自己的代码无懈可击:老大的叮嘱.强调也都视为耳旁风,最终导致的结果是我加班排查问题,花的时间还挺长的,要复现问题.排查问题等, ...
- Loki日志系统
一.概述 背景 Loki的第一个稳定版本于2019年11月19日发布,是 Grafana Labs 团队最新的开源项目,是一个水平可扩展,高可用性,多租户的日志聚合系统. Grafana 对 Loki ...
- Loki日志系统基础知识
文章摘抄转载自:https://lluozh.blog.csdn.net/article/details/111027998 Loki 日志系统由以下3个部分组成: loki是主服务器,负责存储日志和 ...
随机推荐
- 微服务技术栈简单介绍,Eureka和Ribbon的引入和使用
一.了解微服务架构 1.微服务技术栈 整体框架 整体学习规划路线2.微服务与单体架构的区别 单体架构:将业务的所有功能集中在一个项目中开发,打成一个包部署 优势 结构简单 部署成本低 缺点 耦合度高, ...
- JavaEE复制后项目出错或者无法运行的解决方法
eclipse中,直接复制项目,会出现一些错误,解决方法如下: 1,在复制后的工程上点右键->properties->Web Project Settings>web context ...
- python篇第10天【For 循环语句】
实例 #!/usr/bin/python # -*- coding: UTF-8 -*- for a in 'Henry': print "This is ", a fru ...
- 从服务间的一次调用分析整个springcloud的调用过程(二)
先看示例代码 @RestController @RequestMapping("/students") public class StudentController { @Auto ...
- linux中安装swoole框架
简单说说如何在linux中安装swoole框架. 具体的安装步骤其实和安装php源码类似. 下载源码 => 执行configure => make => make install 安 ...
- MySQL数据库初识、下载使用(针对库、表、记录的增删改查)
今日内容概要 数据演变史 数据库软件的本质 MySQL简介 下载与安装 基本配置 基本SQL语句 内容详细 1.数据演变史 # 1.单独的文本文件 没有固定的存放位置和格式 文件名:user.txt ...
- Note -「动态 DP」学习笔记
目录 「CF 750E」New Year and Old Subsequence 「洛谷 P4719」「模板」"动态 DP" & 动态树分治 「洛谷 P6021」洪水 「S ...
- Solution -「JOISC 2021」「LOJ #3491」道路建设
\(\mathcal{Description}\) Link. 平面上有 \(n\) 个互不重合的点 \((x_{1..n},y_{1..n})\),求其两两曼哈顿距离的前 \(m\) 小值. ...
- EasyX库简单中文手册
EasyX库简单中文手册 作者: 时间: 2021/2/2 第一个例程 #include <graphics.h> // 图像相关库 #include <conio.h> // ...
- pagehelper 自循环启动报错
问题原因 问题产生的原因是 ServiceA实现类中引入了ServiceB,而在ServiceB实现类中又引入了ServiceA,导致循环依赖注入. 其实在代码开发过程中应该尽量避免这种操作的出现,即 ...