prometheus-添加监控linux服务器
1. prometheus-添加监控linux服务器
prometheus添加监控linux服务器
- node_exporter:用于监控Linux系统的指标采集器。
- 常用指标:
- CPU
- 内存
- 硬盘
- 网络流量
- 文件描述符
- 系统负载
- 系统服务
- 数据接口:http://IP:9100
- 使用文档:https://prometheus.io/docs/guides/node-exporter/
- GitHub:https://github.com/prometheus/node_exporter
安装部署
下载node_exporter包
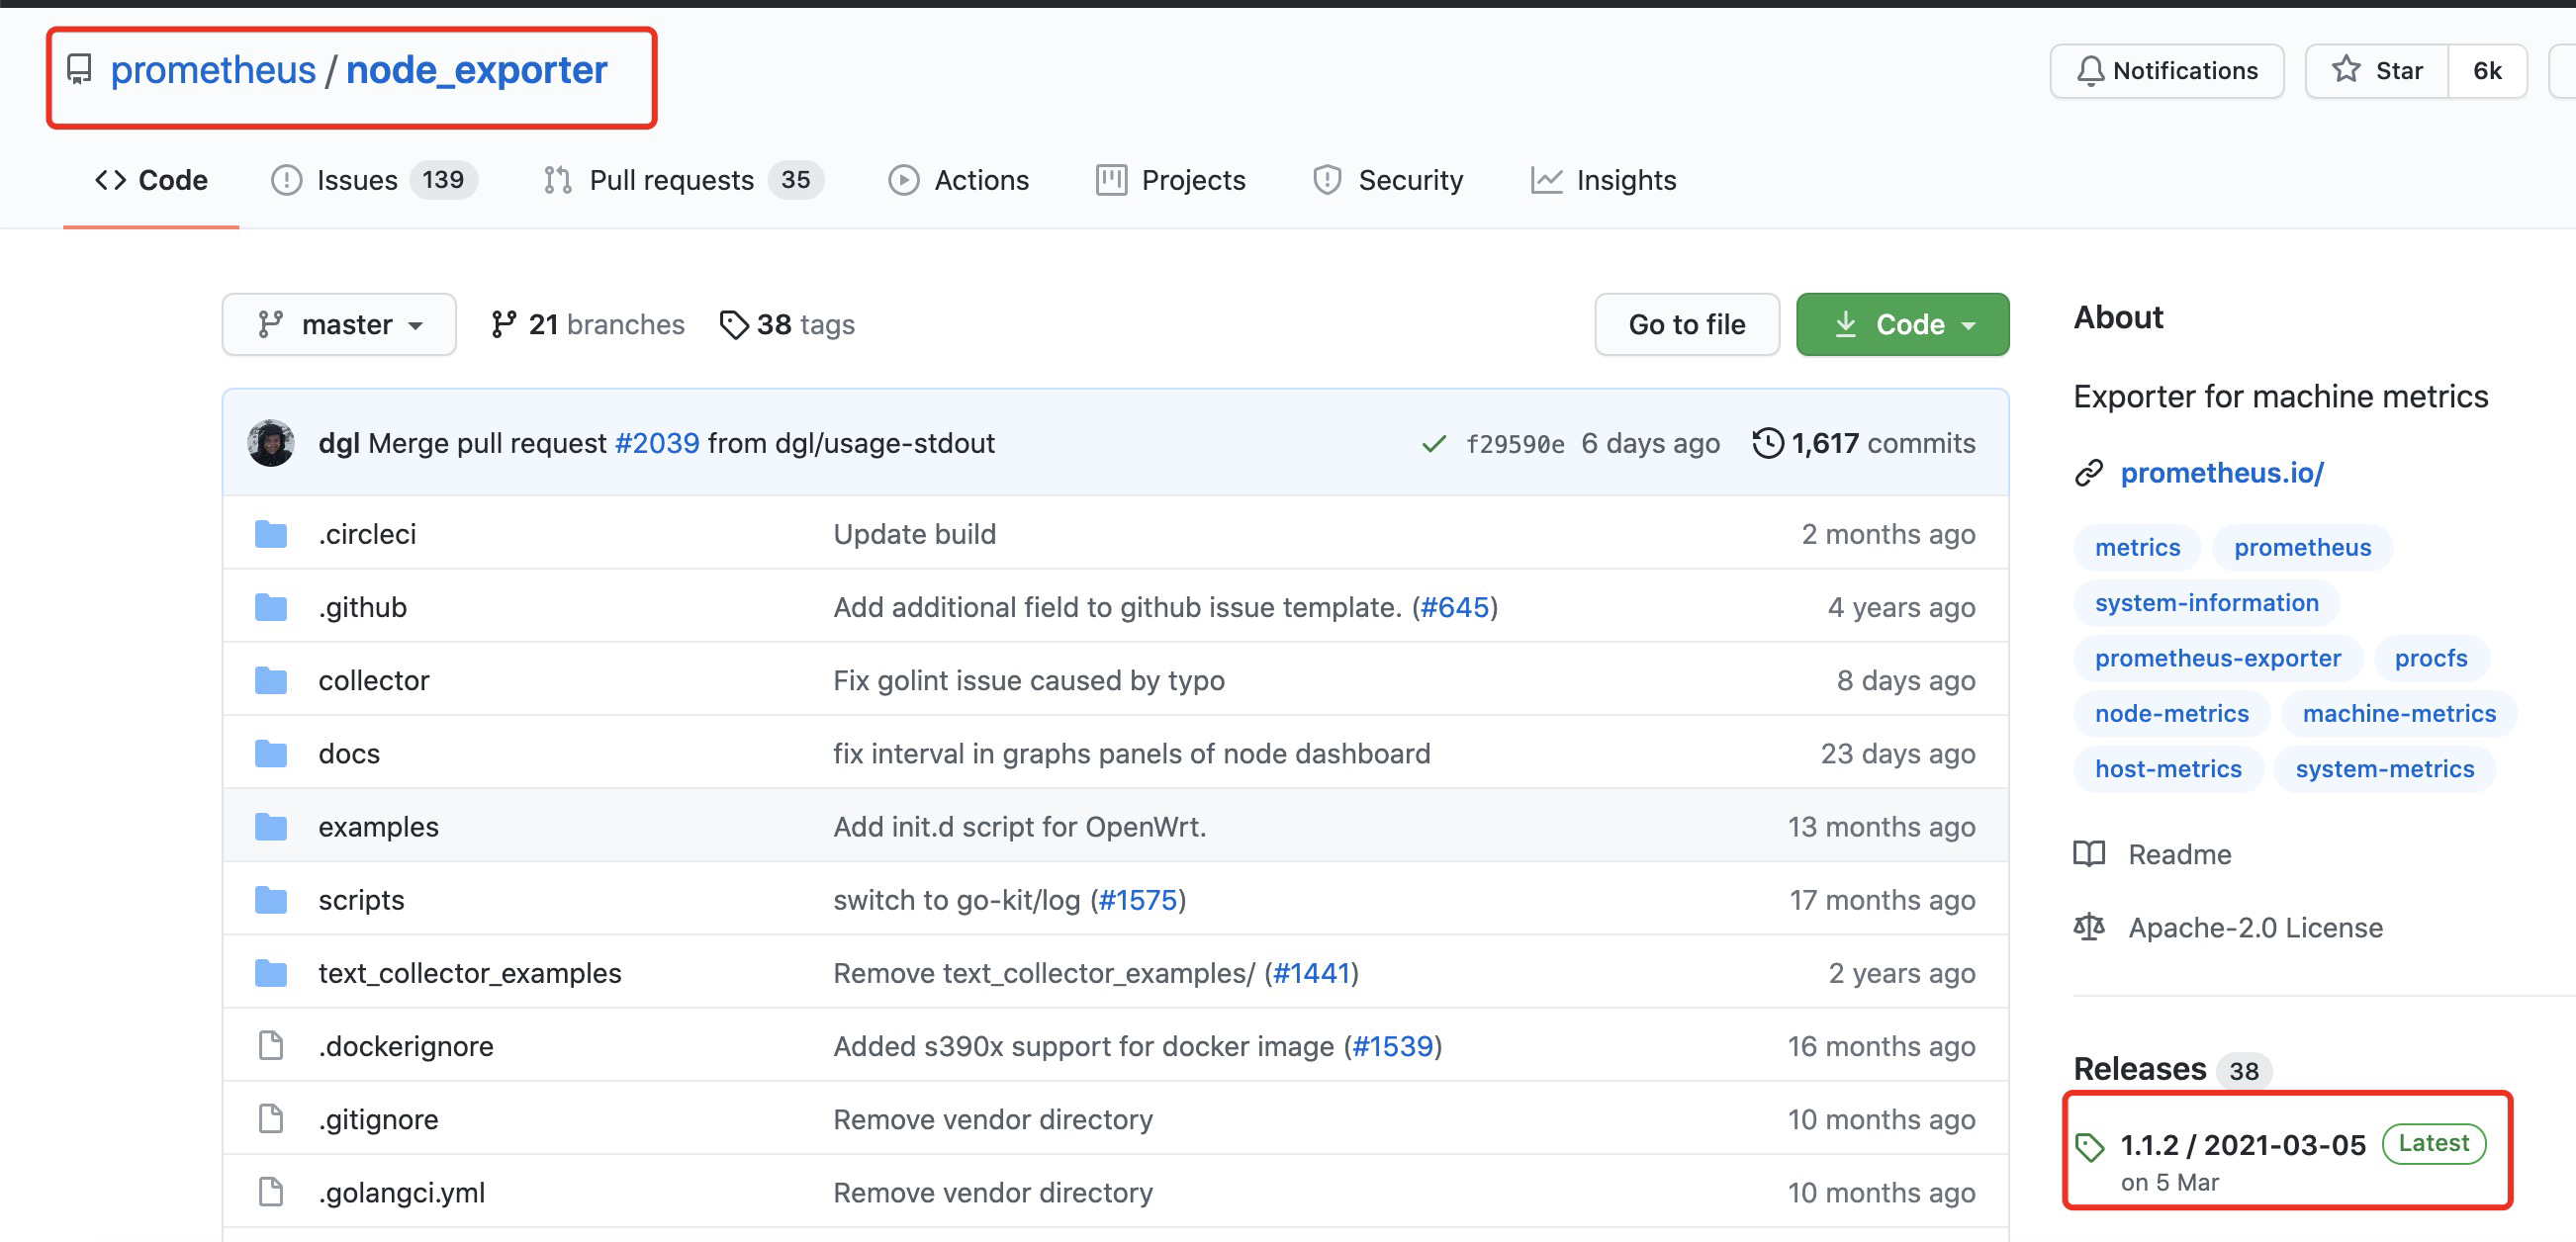
https://github.com/prometheus/node_exporter/releases/download/v1.1.2/node_exporter-1.1.2.linux-amd64.tar.gz
监控端主机下载
[root@VM-0-17-centos ~]# wget https://github.com/prometheus/node_exporter/releases/download/v1.1.2/node_exporter-1.1.2.linux-amd64.tar.gz
解压
[root@VM-0-17-centos ~]# tar  -xvf node_exporter-1.1.2.linux-amd64.tar.gz

node_exporter-1.1.2.linux-amd64/

node_exporter-1.1.2.linux-amd64/LICENSE

node_exporter-1.1.2.linux-amd64/NOTICE

node_exporter-1.1.2.linux-amd64/node_exporter
拷贝到opt目录下存放
[root@VM-0-17-centos ~]# mv node_exporter-1.1.2.linux-amd64 /opt/

[root@VM-0-17-centos ~]# ll /opt/node_exporter-1.1.2.linux-amd64/

total 18748

-rw-r--r-- 1 3434 3434    11357 Mar  5 17:41 LICENSE

-rwxr-xr-x 1 3434 3434 19178528 Mar  5 17:29 node_exporter

-rw-r--r-- 1 3434 3434      463 Mar  5 17:41 NOTICE

[root@VM-0-17-centos ~]# mv /opt/node_exporter-1.1.2.linux-amd64 /opt/node_exporter
切换目录
[root@VM-0-17-centos ~]# cd /opt/node_exporter/

[root@VM-0-17-centos node_exporter]# ll

total 18748

-rw-r--r-- 1 3434 3434    11357 Mar  5 17:41 LICENSE

-rwxr-xr-x 1 3434 3434 19178528 Mar  5 17:29 node_exporter

-rw-r--r-- 1 3434 3434      463 Mar  5 17:41 NOTICE
启动服务尝试
[root@VM-0-17-centos node_exporter]# ./node_exporter

level=info ts=2021-05-19T07:00:05.583Z caller=node_exporter.go:178 msg="Starting node_exporter" version="(version=1.1.2, branch=HEAD, revision=b597c1244d7bef49e6f3359c87a56dd7707f6719)"

level=info ts=2021-05-19T07:00:05.583Z caller=node_exporter.go:179 msg="Build context" build_context="(go=go1.15.8, user=root@f07de8ca602a, date=20210305-09:29:10)"

level=warn ts=2021-05-19T07:00:05.583Z caller=node_exporter.go:181 msg="Node Exporter is running as root user. This exporter is designed to run as unpriviledged user, root is not required."

level=info ts=2021-05-19T07:00:05.583Z caller=filesystem_common.go:74 collector=filesystem msg="Parsed flag --collector.filesystem.ignored-mount-points" flag=^/(dev|proc|sys|var/lib/docker/.+)($|/)

level=info ts=2021-05-19T07:00:05.583Z caller=filesystem_common.go:76 collector=filesystem msg="Parsed flag --collector.filesystem.ignored-fs-types" flag=^(autofs|binfmt_misc|bpf|cgroup2?|configfs|debugfs|devpts|devtmpfs|fusectl|hugetlbfs|iso9660|mqueue|nsfs|overlay|proc|procfs|pstore|rpc_pipefs|securityfs|selinuxfs|squashfs|sysfs|tracefs)$

level=info ts=2021-05-19T07:00:05.584Z caller=node_exporter.go:106 msg="Enabled collectors"

level=info ts=2021-05-19T07:00:05.584Z caller=node_exporter.go:113 collector=arp

level=info ts=2021-05-19T07:00:05.584Z caller=node_exporter.go:113 collector=bcache

level=info ts=2021-05-19T07:00:05.584Z caller=node_exporter.go:113 collector=bonding

level=info ts=2021-05-19T07:00:05.584Z caller=node_exporter.go:113 collector=btrfs

level=info ts=2021-05-19T07:00:05.584Z caller=node_exporter.go:113 collector=conntrack

level=info ts=2021-05-19T07:00:05.584Z caller=node_exporter.go:113 collector=cpu

level=info ts=2021-05-19T07:00:05.584Z caller=node_exporter.go:113 collector=cpufreq

level=info ts=2021-05-19T07:00:05.584Z caller=node_exporter.go:113 collector=diskstats

level=info ts=2021-05-19T07:00:05.584Z caller=node_exporter.go:113 collector=edac

level=info ts=2021-05-19T07:00:05.584Z caller=node_exporter.go:113 collector=entropy

level=info ts=2021-05-19T07:00:05.584Z caller=node_exporter.go:113 collector=fibrechannel

level=info ts=2021-05-19T07:00:05.584Z caller=node_exporter.go:113 collector=filefd

level=info ts=2021-05-19T07:00:05.584Z caller=node_exporter.go:113 collector=filesystem

level=info ts=2021-05-19T07:00:05.584Z caller=node_exporter.go:113 collector=hwmon

level=info ts=2021-05-19T07:00:05.584Z caller=node_exporter.go:113 collector=infiniband

level=info ts=2021-05-19T07:00:05.584Z caller=node_exporter.go:113 collector=ipvs

level=info ts=2021-05-19T07:00:05.584Z caller=node_exporter.go:113 collector=loadavg

level=info ts=2021-05-19T07:00:05.584Z caller=node_exporter.go:113 collector=mdadm

level=info ts=2021-05-19T07:00:05.584Z caller=node_exporter.go:113 collector=meminfo

level=info ts=2021-05-19T07:00:05.584Z caller=node_exporter.go:113 collector=netclass

level=info ts=2021-05-19T07:00:05.584Z caller=node_exporter.go:113 collector=netdev

level=info ts=2021-05-19T07:00:05.584Z caller=node_exporter.go:113 collector=netstat

level=info ts=2021-05-19T07:00:05.584Z caller=node_exporter.go:113 collector=nfs

level=info ts=2021-05-19T07:00:05.584Z caller=node_exporter.go:113 collector=nfsd

level=info ts=2021-05-19T07:00:05.584Z caller=node_exporter.go:113 collector=powersupplyclass

level=info ts=2021-05-19T07:00:05.584Z caller=node_exporter.go:113 collector=pressure

level=info ts=2021-05-19T07:00:05.584Z caller=node_exporter.go:113 collector=rapl

level=info ts=2021-05-19T07:00:05.584Z caller=node_exporter.go:113 collector=schedstat

level=info ts=2021-05-19T07:00:05.584Z caller=node_exporter.go:113 collector=sockstat

level=info ts=2021-05-19T07:00:05.584Z caller=node_exporter.go:113 collector=softnet

level=info ts=2021-05-19T07:00:05.584Z caller=node_exporter.go:113 collector=stat

level=info ts=2021-05-19T07:00:05.584Z caller=node_exporter.go:113 collector=textfile

level=info ts=2021-05-19T07:00:05.584Z caller=node_exporter.go:113 collector=thermal_zone

level=info ts=2021-05-19T07:00:05.584Z caller=node_exporter.go:113 collector=time

level=info ts=2021-05-19T07:00:05.584Z caller=node_exporter.go:113 collector=timex

level=info ts=2021-05-19T07:00:05.584Z caller=node_exporter.go:113 collector=udp_queues

level=info ts=2021-05-19T07:00:05.584Z caller=node_exporter.go:113 collector=uname

level=info ts=2021-05-19T07:00:05.584Z caller=node_exporter.go:113 collector=vmstat

level=info ts=2021-05-19T07:00:05.584Z caller=node_exporter.go:113 collector=xfs

level=info ts=2021-05-19T07:00:05.584Z caller=node_exporter.go:113 collector=zfs

level=info ts=2021-05-19T07:00:05.584Z caller=node_exporter.go:195 msg="Listening on" address=:9100

level=info ts=2021-05-19T07:00:05.584Z caller=tls_config.go:191 msg="TLS is disabled." http2=false
配置为系统服务管理
编写系统配置服务
[root@iZj6cbgktk3zjpge312vq1Z node_exporter]# vim  /usr/lib/systemd/system/node_exporter.service

[root@iZj6cbgktk3zjpge312vq1Z node_exporter]# cat  /usr/lib/systemd/system/node_exporter.service

[Unit]

Description=node_exporter

[Service]

# 添加认证密码文件/opt/node_exporter/config.yml ,默认可以不需要

ExecStart=/opt/node_exporter/node_exporter --web.config=/opt/node_exporter/config.yml

ExecReload=/bin/kill -HUP $MAINPID

KillMode=process

Restart=on-failure

[Install]

WantedBy=multi-user.target
添加config配置文件
[root@VM-0-17-centos node_exporter]# yum install httpd-tools –y

[root@VM-0-17-centos node_exporter]# htpasswd -nBC 12 '' | tr -d ':\n'

New password:       #这里输入的123456

Re-type new password:    #这里输入的123456

$2y$12$.YGKNPkYfSOsm.JataWRUe4vWdTS8nW6YtPQI0Jr14eTv6E5Fpdga          # 这段是生成的key
编写启动配置文件
[root@iZj6cbgktk3zjpge312vq1Z node_exporter]# vim config.yml

[root@iZj6cbgktk3zjpge312vq1Z node_exporter]# cat config.yml

basic_auth_users:

  prometheus: $2y$12$.YGKNPkYfSOsm.JataWRUe4vWdTS8nW6YtPQI0Jr14eTv6E5Fpdga
启动服务
systemctl daemon-reload

systemctl start node_exporter

systemctl enable node_exporter
在prometheus添加主机
添加配置文件
[root@iZj6cbgktk3zjpge312vq2Z prometheus]# vim prometheus.yml

[root@iZj6cbgktk3zjpge312vq2Z prometheus]# cat prometheus.yml

# my global config

global:

  scrape_interval:     15s # Set the scrape interval to every 15 seconds. Default is every 1 minute.

  evaluation_interval: 15s # Evaluate rules every 15 seconds. The default is every 1 minute.

  # scrape_timeout is set to the global default (10s).

# Alertmanager configuration

alerting:

  alertmanagers:

  - static_configs:

    - targets:

      # - alertmanager:9093

# Load rules once and periodically evaluate them according to the global 'evaluation_interval'.

rule_files:

  # - "first_rules.yml"

  # - "second_rules.yml"

# A scrape configuration containing exactly one endpoint to scrape:

# Here it's Prometheus itself.

scrape_configs:

  # The job name is added as a label `job=<job_name>` to any timeseries scraped from this config.

  - job_name: 'prometheus'

    # metrics_path defaults to '/metrics'

    # scheme defaults to 'http'.

    static_configs:

    - targets: ['127.0.0.1:9090']

  - job_name: linux

    # 添加监控主机的用户和密码

    basic_auth:

      username: prometheus

      password: 123456

    static_configs:

      - targets: ['10.1.2.211:9100']

        labels:

          prod: web
重启服务
[root@iZj6cbgktk3zjpge312vq2Z prometheus]# /bin/systemctl restart prometheus
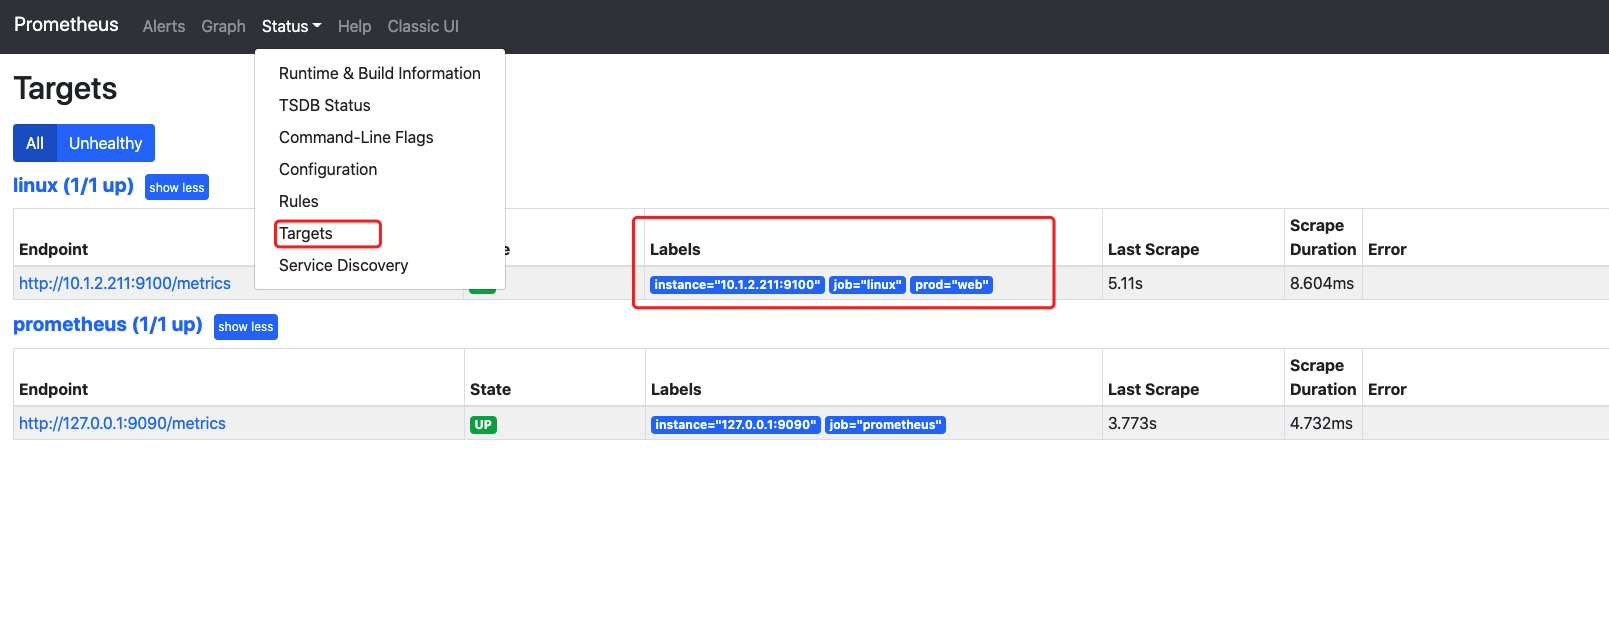
在Prometheus配置文件添加被监控端:
验证prometheus配置文件

验证发现已经有数据了
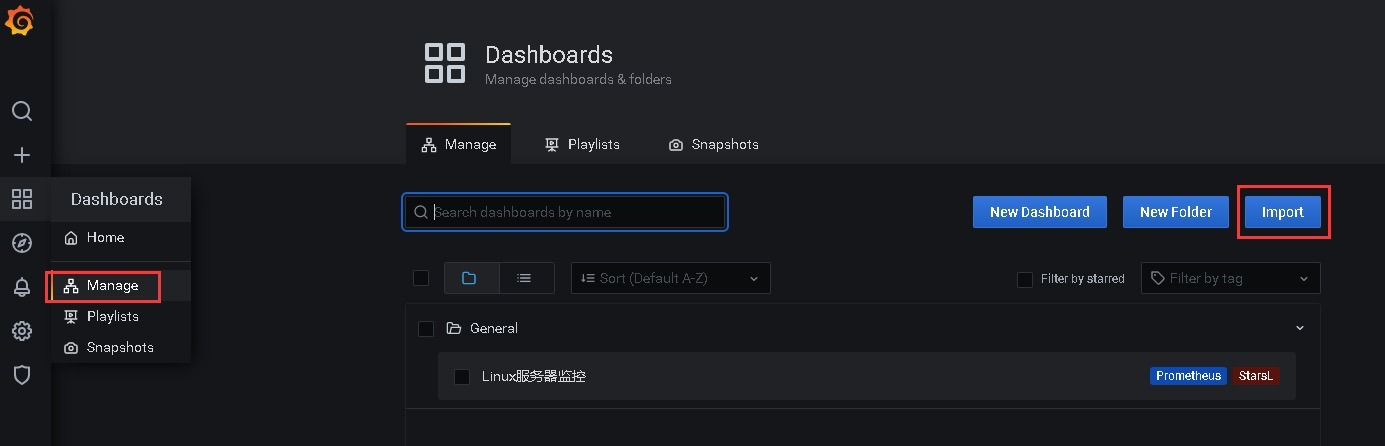
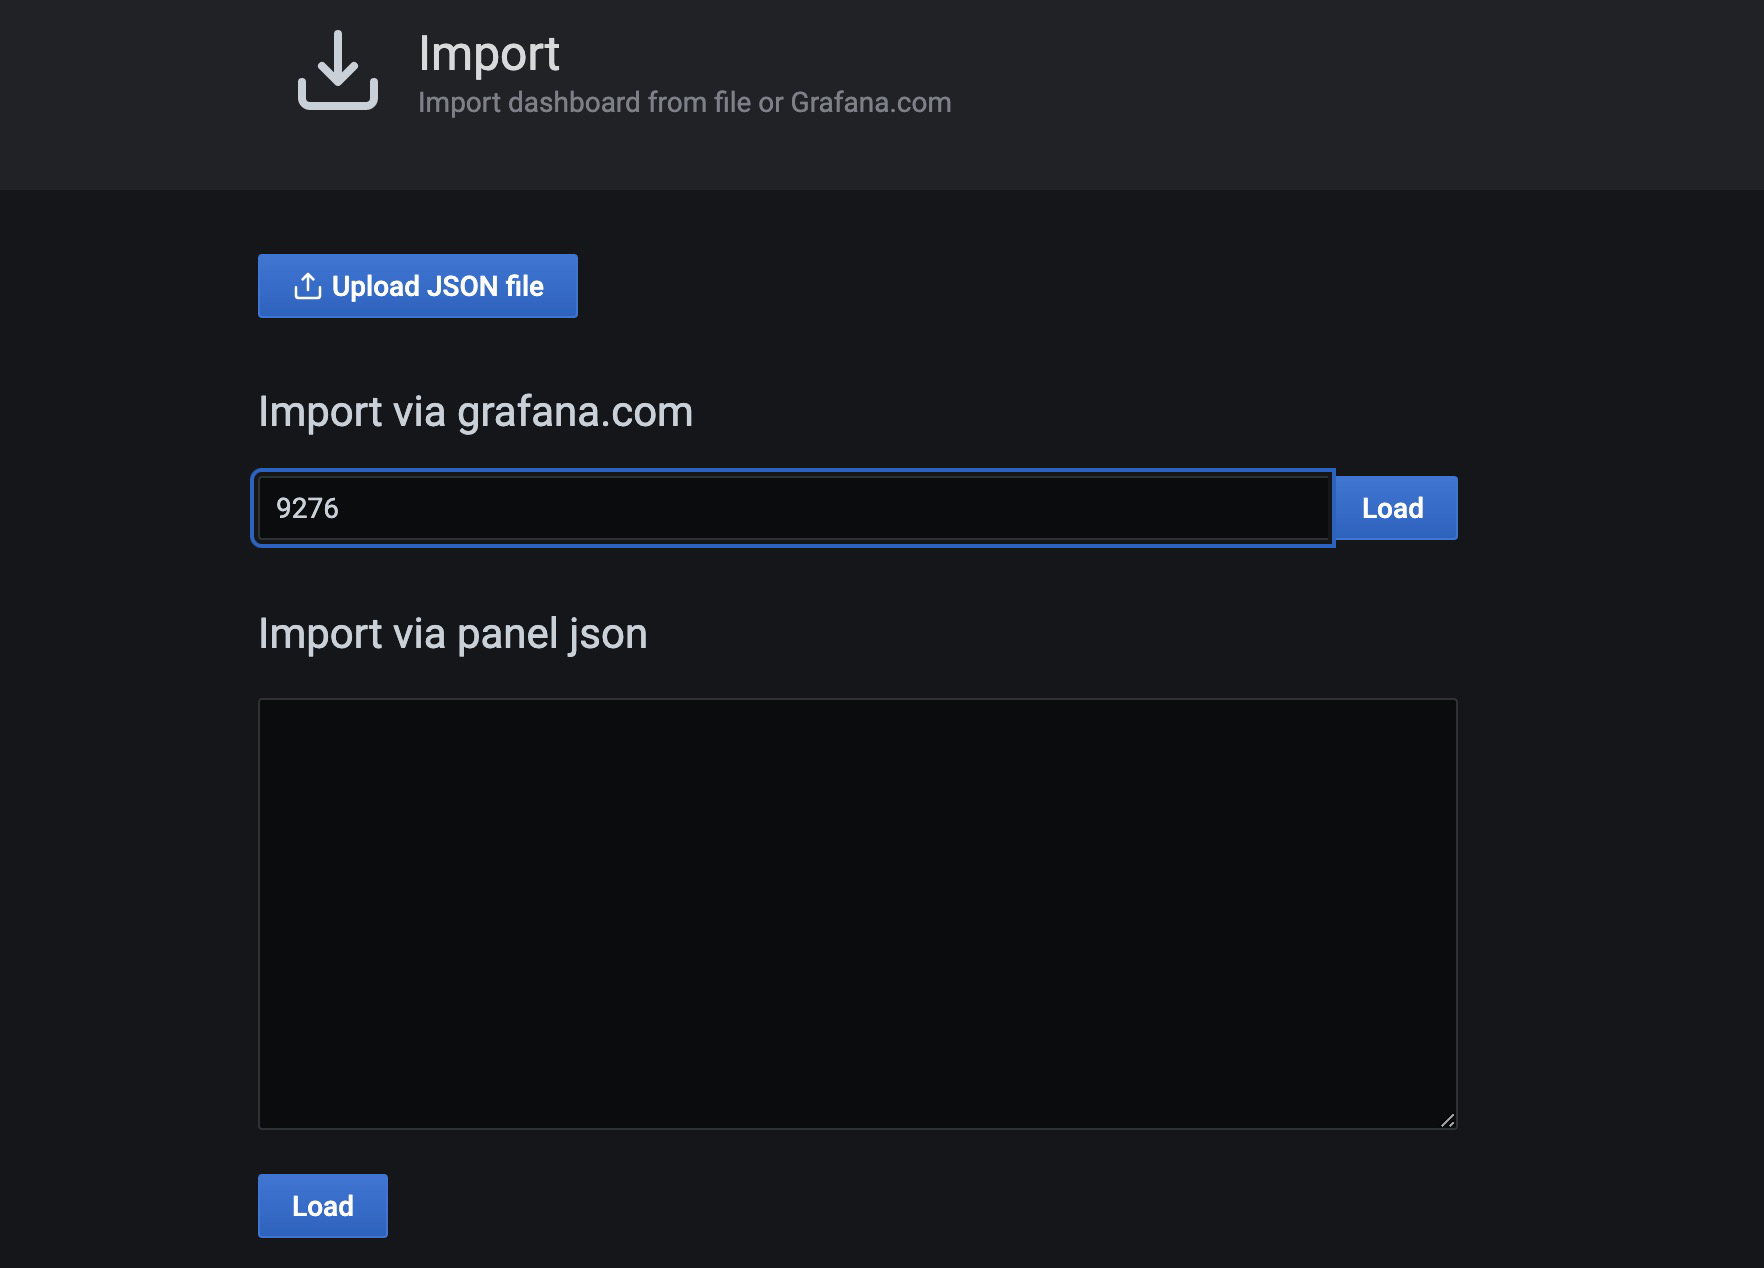
使用Grafana展示node_exporter数据指标,仪表盘ID:9276
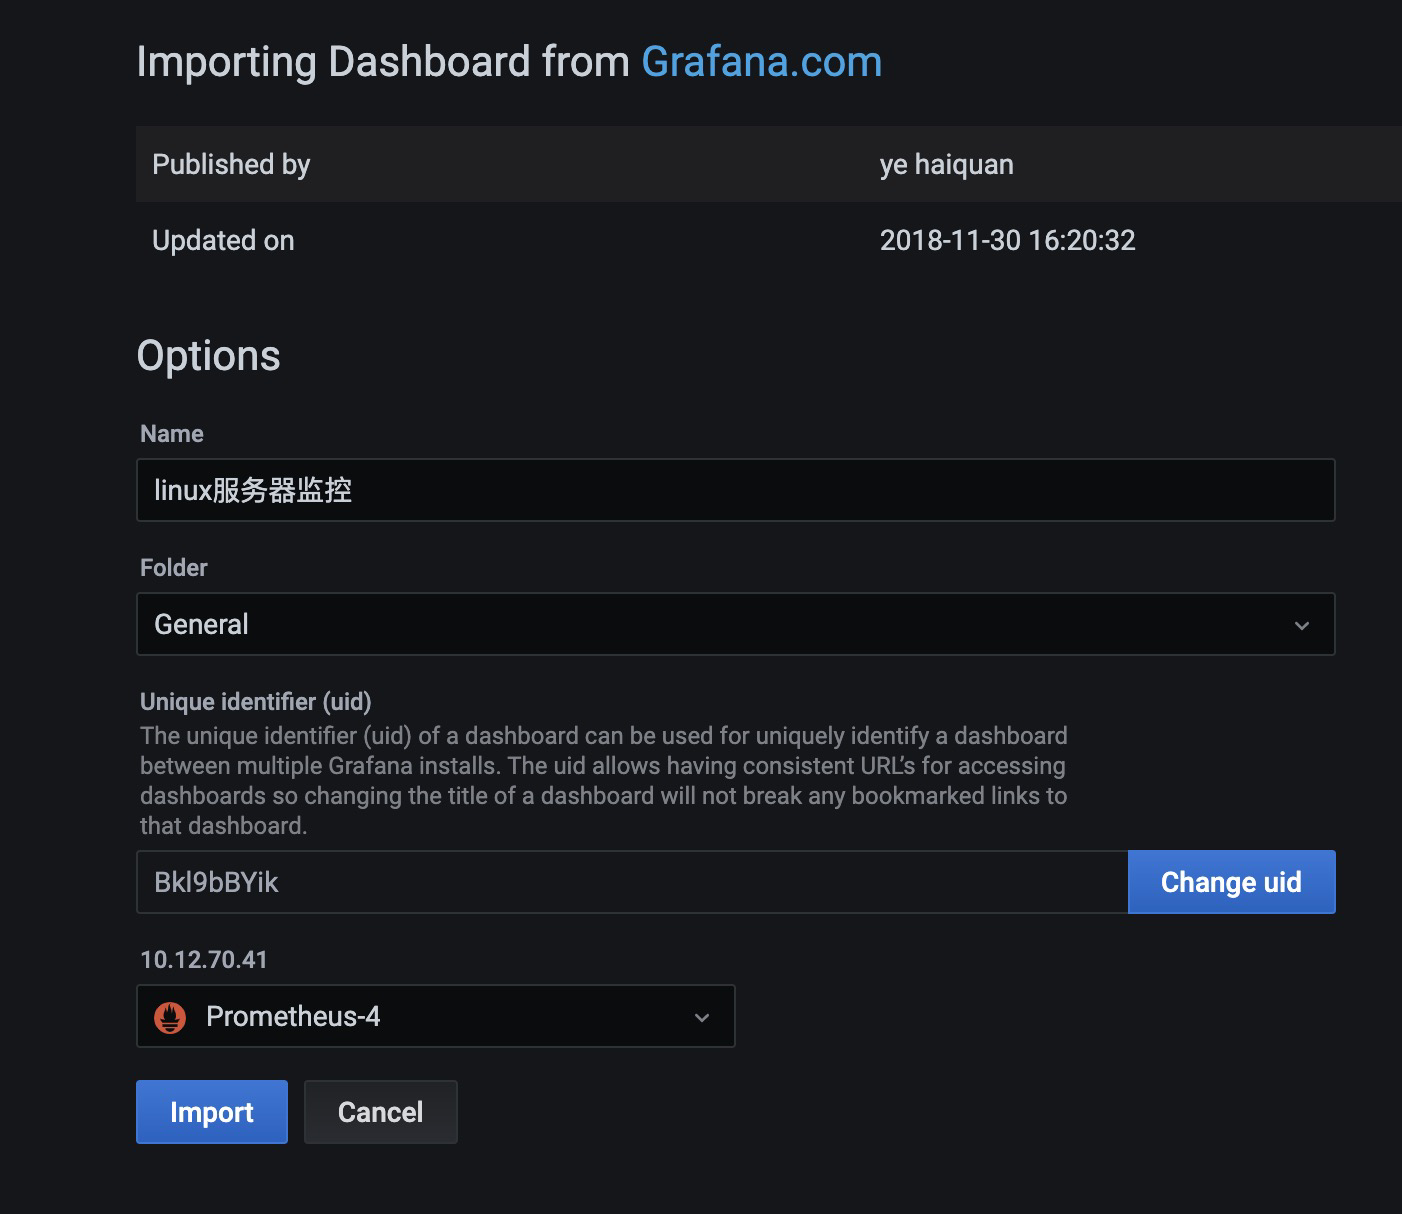
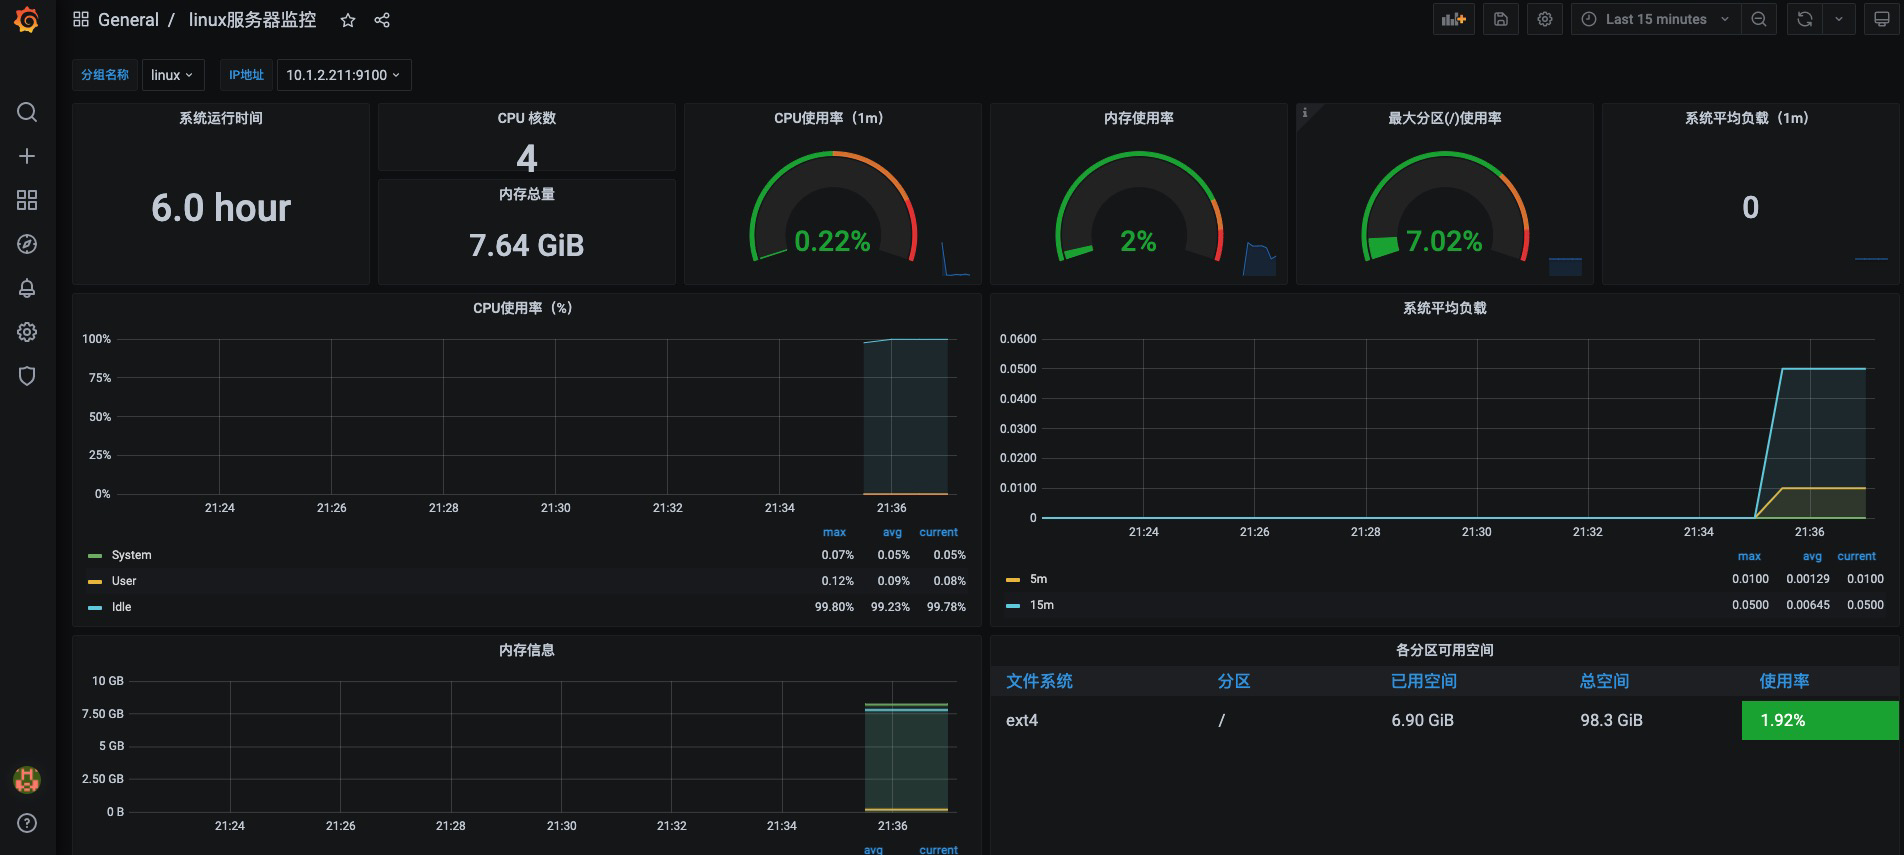
导入仪表盘
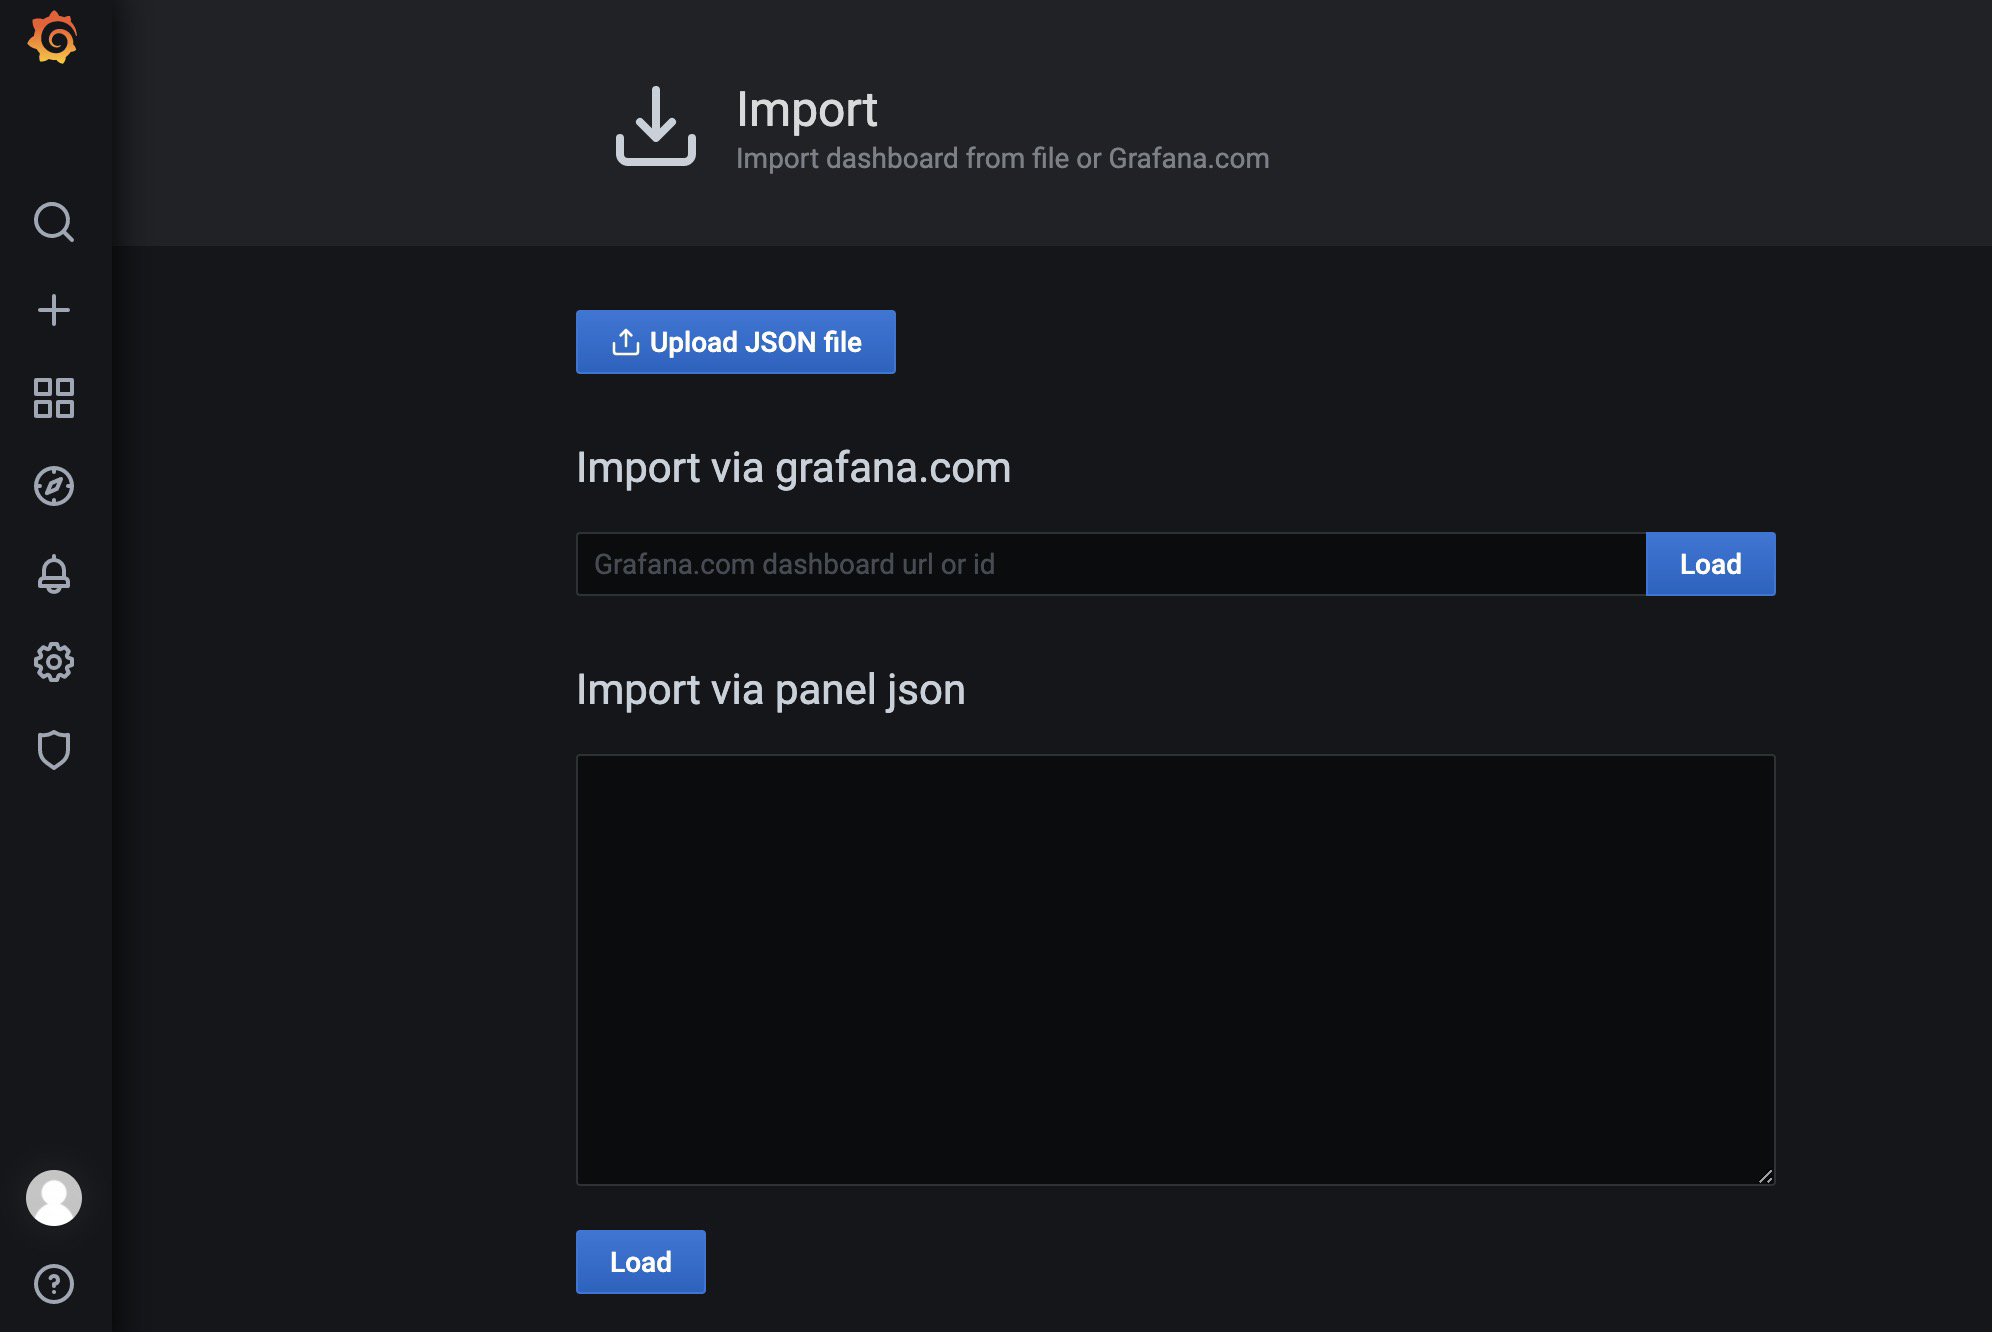
添加
prometheus-添加监控linux服务器的更多相关文章
- Prometheus 监控linux服务器
Prometheus 监控linux服务器 node_exporter:用于*NIX系统监控,使用Go语言编写的收集器. 使用版本 node_exporter 0.17.0 相关文档 使用文档:htt ...
- Grafana+Prometheus通过node_exporter监控Linux服务器信息
Grafana+Prometheus通过node_exporter监控Linux服务器信息 一.Grafana+Prometheus通过node_exporter监控Linux服务器信息 1.1nod ...
- 监控linux服务器网卡流量
监控linux服务器网卡流量 作者:尹正杰 版权声明:原创作品,谢绝转载!否则将追究法律责任. 欢迎加入:高级运维工程师之路 598432640 前言:众所周知,我们安装zabbix服务器 ...
- JMC监控(Windows上远程连接监控Linux服务器的JVM)
Windows上远程连接监控Linux服务器的JVM:1.Linux服务器上配置:在Tomcat的tomcat-wms/bin/catalina.sh中添加CATALINA_OPTS="-X ...
- 监控linux服务器工具nmon的使用
做压测时,需要查看服务器中的cpu.内存变化,但由于服务器是linux环境,则需要监控linux服务器的工具,下面用到的工具是nmon. 1.安装nmon.在网上下载nmon安装包,在linux服务器 ...
- Jmeter监控Linux服务器性能
①.下载JMeterPlugins相关的jar包,放jmeter的安装路径\lib\ext下——这个时候启动jmeter会发现,添加监听器时,出现了一堆的jp@jc……,这些就是插件的功劳. JMet ...
- Windows负载机JVM 远程监控Linux服务器下tomcat
基本是跟着网上的操作进行的,除了遇到一个Local host name unknown的问题: 一.Linux服务器操作部分 服务器地址:10.64.111.68 首先配置JMX: 1.找到jdk目录 ...
- 监控 Linux 服务器活动的几个命令(watch top ac)
watch.top 和 ac 命令为我们监视 Linux 服务器上的活动提供了一些十分高效的途径. 为了在获取系统活动时更加轻松,Linux 系统提供了一系列相关的命令.在这篇文章中,我们就一起来看看 ...
- loadrunner监控linux服务器
参考http://www.cnblogs.com/yangxia-test/archive/2012/11/27/2790771.html http://www.cnblogs.com/candle8 ...
- Spotlight 监控Linux服务器的性能
Spotlight功能:详细的进程跟踪功能远程连接在线的Unix/Linux的调优指南事件日志跟踪配置警报 详细的进程跟踪功能:Spotlight对具体的Unix / Linux的进程长达24小时的历 ...
随机推荐
- Codeforces Round #822 (Div. 2) A-F
比赛链接 A 题解 知识点:贪心. 注意到任意三根木棍的相等最优解是最长减最小,因此从小到大排序,三个三个取,取最小值. 时间复杂度 \(O(n\log n)\) 空间复杂度 \(O(n)\) 代码 ...
- C++ 标准文档
正式的 C++ 标准文档不是免费的,需要付费购买,可以到 ISO Store 或者其成员国的标准商店购买正版(中国 SACinfo 标准信息服务网,美国 ANSI WebStore,其他成员国可查看 ...
- instanceof的使用和向下转型
x instanceof A:检验x是否为类A的对象,返回值为boolean型 使用情境:为了避免在向下转型时出现ClassCastException的异常,我们在向下转型之前,先进行instance ...
- java实现单链表的创建、增、删、改、查
文章目录 单链表的创建.增.删.改.查 1.增加一个节点 2.删除一个节点 3.修改某一个节点 5.遍历单链表 单链表的创建.增.删.改.查 双向链表的增删改查:https://blog.csdn.n ...
- 齐博X1-栏目的调用2
fun('sort@fathers',$fid,'cms') 获取上层多级栏目这样的,比如我们现在所属第三级栏目,现在可以利用这个函数获取第二级和第一级的栏目,当然自身也会被调用出来,所以此函数用的 ...
- 基于GA遗传算法的TSP旅行商问题求解
import random import math import matplotlib.pyplot as plt import city class no: #该类表示每个点的坐标 def __in ...
- 记录一次sshd服务启动失败
记录一次sshd服务启动失败 问题描述: 服务器开机之后发现无法通过远程连接服务器终端,但是服务器并未宕机,于是考虑到sshd服务出现异常 解决思路: 查看服务器sshd服务运行情况 [root@ha ...
- 一、什么是celery
一.什么是Celery 1.1.celery是什么 celery是一个简单.灵活且可靠的,处理大量消息的分布式系统,专注于是心爱处理的异步任务队列,同事也支持任务调度. Celery的架构由三部分组成 ...
- HTTP(s) API 经验总结
目录 参考文章 First URL HTTP(s)-Header 请求方式 参考文章 https://developer.mozilla.org/zh-CN/docs/Web/HTTP/Overvie ...
- KatalonRecorder系列(一):基本使用+XPath元素定位
一.简介 Katalon Recorder是基于selenium的浏览器插件,支持火狐和chrome.可以录制web上的操作并回放,还能导入导出脚本. 二.安装 可在谷歌商店或者火狐附件组件中搜索并选 ...